false--12-28Q32019000005086365342000000711830000000.601.200.631.2645160000004350000000451600000043500000004230000000.0270.024P1Y4837
0000050863
2018-12-30
2019-09-28
0000050863
2019-09-28
0000050863
2018-07-01
2018-09-29
0000050863
2019-06-30
2019-09-28
0000050863
2017-12-31
2018-09-29
0000050863
us-gaap:RetainedEarningsMember
2019-06-30
2019-09-28
0000050863
2018-12-29
0000050863
2018-09-29
0000050863
2017-12-30
0000050863
intc:MobileyeMember
2018-12-29
0000050863
us-gaap:CommonStockIncludingAdditionalPaidInCapitalMember
2018-07-01
2018-09-29
0000050863
us-gaap:CommonStockIncludingAdditionalPaidInCapitalMember
2019-09-28
0000050863
us-gaap:AccumulatedOtherComprehensiveIncomeMember
2018-09-29
0000050863
us-gaap:CommonStockIncludingAdditionalPaidInCapitalMember
2018-06-30
0000050863
us-gaap:CommonStockIncludingAdditionalPaidInCapitalMember
2018-12-30
2019-09-28
0000050863
us-gaap:CommonStockIncludingAdditionalPaidInCapitalMember
2017-12-31
2018-09-29
0000050863
us-gaap:AccumulatedOtherComprehensiveIncomeMember
2018-06-30
0000050863
us-gaap:CommonStockIncludingAdditionalPaidInCapitalMember
2018-09-29
0000050863
us-gaap:AccumulatedOtherComprehensiveIncomeMember
2018-07-01
2018-09-29
0000050863
us-gaap:RetainedEarningsMember
2017-12-31
0000050863
us-gaap:CommonStockIncludingAdditionalPaidInCapitalMember
2019-06-29
0000050863
us-gaap:RetainedEarningsMember
2018-07-01
2018-09-29
0000050863
us-gaap:CommonStockIncludingAdditionalPaidInCapitalMember
2019-06-30
2019-09-28
0000050863
us-gaap:CommonStockIncludingAdditionalPaidInCapitalMember
2018-12-29
0000050863
2017-12-31
0000050863
us-gaap:RetainedEarningsMember
2019-06-29
0000050863
us-gaap:CommonStockIncludingAdditionalPaidInCapitalMember
2017-12-30
0000050863
us-gaap:CommonStockIncludingAdditionalPaidInCapitalMember
2017-12-31
0000050863
us-gaap:RetainedEarningsMember
2018-12-30
2019-09-28
0000050863
us-gaap:AccumulatedOtherComprehensiveIncomeMember
2019-09-28
0000050863
us-gaap:AccumulatedOtherComprehensiveIncomeMember
2018-12-29
0000050863
us-gaap:AccumulatedOtherComprehensiveIncomeMember
2017-12-30
0000050863
us-gaap:RetainedEarningsMember
2017-12-31
2018-09-29
0000050863
us-gaap:AccumulatedOtherComprehensiveIncomeMember
2017-12-31
0000050863
us-gaap:RetainedEarningsMember
2018-12-29
0000050863
us-gaap:AccumulatedOtherComprehensiveIncomeMember
2019-06-29
0000050863
us-gaap:AccumulatedOtherComprehensiveIncomeMember
2018-12-30
2019-09-28
0000050863
us-gaap:RetainedEarningsMember
2017-12-30
0000050863
2018-06-30
0000050863
us-gaap:RetainedEarningsMember
2019-09-28
0000050863
2019-06-29
0000050863
us-gaap:RetainedEarningsMember
2018-06-30
0000050863
us-gaap:RetainedEarningsMember
2018-09-29
0000050863
us-gaap:AccumulatedOtherComprehensiveIncomeMember
2017-12-31
2018-09-29
0000050863
us-gaap:AccumulatedOtherComprehensiveIncomeMember
2019-06-30
2019-09-28
0000050863
2017-12-31
2018-12-29
0000050863
us-gaap:AccountingStandardsUpdate201602Member
2018-12-30
0000050863
us-gaap:AccountingStandardsUpdate201602Member
us-gaap:OtherNoncurrentAssetsMember
2018-12-30
0000050863
us-gaap:OtherNoncurrentAssetsMember
2019-09-28
0000050863
2017-01-01
2017-12-30
0000050863
srt:MaximumMember
2019-09-28
0000050863
us-gaap:OtherNoncurrentLiabilitiesMember
2019-09-28
0000050863
us-gaap:AccruedLiabilitiesMember
2019-09-28
0000050863
srt:MinimumMember
2019-09-28
0000050863
intc:PlatformMember
intc:ClientComputingGroupMember
2018-12-30
2019-09-28
0000050863
intc:ClientComputingGroupMember
2019-06-30
2019-09-28
0000050863
intc:DataCenterGroupMember
2018-07-01
2018-09-29
0000050863
intc:OtherProductOrServiceMember
intc:DataCenterGroupMember
2018-12-30
2019-09-28
0000050863
intc:OtherProductOrServiceMember
intc:ClientComputingGroupMember
2018-07-01
2018-09-29
0000050863
intc:ClientComputingGroupMember
2018-07-01
2018-09-29
0000050863
intc:ClientComputingGroupMember
2017-12-31
2018-09-29
0000050863
intc:MobileyeMember
2017-12-31
2018-09-29
0000050863
intc:DataCenterGroupMember
2017-12-31
2018-09-29
0000050863
intc:InternetofThingsMember
2018-07-01
2018-09-29
0000050863
us-gaap:AllOtherSegmentsMember
2019-06-30
2019-09-28
0000050863
intc:InternetOfThingsGroupMember
2018-07-01
2018-09-29
0000050863
intc:InternetofThingsMember
2019-06-30
2019-09-28
0000050863
us-gaap:AllOtherSegmentsMember
2017-12-31
2018-09-29
0000050863
intc:InternetOfThingsGroupMember
2018-12-30
2019-09-28
0000050863
intc:PlatformMember
intc:ClientComputingGroupMember
2019-06-30
2019-09-28
0000050863
intc:NonVolatileMemorySolutionsGroupMember
2017-12-31
2018-09-29
0000050863
us-gaap:AllOtherSegmentsMember
2018-12-30
2019-09-28
0000050863
intc:ProgrammableSolutionsGroupMember
2019-06-30
2019-09-28
0000050863
intc:InternetofThingsMember
2018-12-30
2019-09-28
0000050863
intc:MobileyeMember
2018-07-01
2018-09-29
0000050863
intc:NonVolatileMemorySolutionsGroupMember
2018-12-30
2019-09-28
0000050863
intc:OtherProductOrServiceMember
intc:ClientComputingGroupMember
2017-12-31
2018-09-29
0000050863
intc:InternetOfThingsGroupMember
2019-06-30
2019-09-28
0000050863
intc:MobileyeMember
2019-06-30
2019-09-28
0000050863
us-gaap:AllOtherSegmentsMember
2018-07-01
2018-09-29
0000050863
intc:OtherProductOrServiceMember
intc:DataCenterGroupMember
2019-06-30
2019-09-28
0000050863
intc:DataCenterGroupMember
2019-06-30
2019-09-28
0000050863
intc:ProgrammableSolutionsGroupMember
2018-07-01
2018-09-29
0000050863
intc:DataCenterGroupMember
2018-12-30
2019-09-28
0000050863
intc:ProgrammableSolutionsGroupMember
2018-12-30
2019-09-28
0000050863
intc:InternetOfThingsGroupMember
2017-12-31
2018-09-29
0000050863
intc:ProgrammableSolutionsGroupMember
2017-12-31
2018-09-29
0000050863
intc:OtherProductOrServiceMember
intc:DataCenterGroupMember
2017-12-31
2018-09-29
0000050863
intc:ClientComputingGroupMember
2018-12-30
2019-09-28
0000050863
intc:DCGPlatformMember
2018-12-30
2019-09-28
0000050863
intc:NonVolatileMemorySolutionsGroupMember
2018-07-01
2018-09-29
0000050863
intc:OtherProductOrServiceMember
intc:ClientComputingGroupMember
2018-12-30
2019-09-28
0000050863
intc:NonVolatileMemorySolutionsGroupMember
2019-06-30
2019-09-28
0000050863
intc:OtherProductOrServiceMember
intc:ClientComputingGroupMember
2019-06-30
2019-09-28
0000050863
intc:DCGPlatformMember
2018-07-01
2018-09-29
0000050863
intc:MobileyeMember
2018-12-30
2019-09-28
0000050863
intc:PlatformMember
intc:ClientComputingGroupMember
2018-07-01
2018-09-29
0000050863
intc:PlatformMember
intc:ClientComputingGroupMember
2017-12-31
2018-09-29
0000050863
intc:DCGPlatformMember
2019-06-30
2019-09-28
0000050863
intc:OtherProductOrServiceMember
intc:DataCenterGroupMember
2018-07-01
2018-09-29
0000050863
intc:DCGPlatformMember
2017-12-31
2018-09-29
0000050863
intc:InternetofThingsMember
2017-12-31
2018-09-29
0000050863
intc:OtherPlatformMember
2017-12-31
2018-09-29
0000050863
intc:IOTGPlatformMember
2018-12-30
2019-09-28
0000050863
intc:IOTGPlatformMember
2019-06-30
2019-09-28
0000050863
intc:PlatformMember
2018-12-30
2019-09-28
0000050863
intc:OtherPlatformMember
2019-06-30
2019-09-28
0000050863
intc:IOTGPlatformMember
2017-12-31
2018-09-29
0000050863
intc:OtherPlatformMember
2018-07-01
2018-09-29
0000050863
intc:DesktopPlatformMember
2019-06-30
2019-09-28
0000050863
intc:DesktopPlatformMember
2018-12-30
2019-09-28
0000050863
intc:OtherProductOrServiceMember
2019-06-30
2019-09-28
0000050863
intc:PlatformMember
2017-12-31
2018-09-29
0000050863
intc:OtherProductOrServiceMember
2018-12-30
2019-09-28
0000050863
intc:OtherProductOrServiceMember
2017-12-31
2018-09-29
0000050863
intc:NotebookPlatformMember
2018-12-30
2019-09-28
0000050863
intc:NotebookPlatformMember
2017-12-31
2018-09-29
0000050863
intc:NotebookPlatformMember
2018-07-01
2018-09-29
0000050863
intc:PlatformMember
2018-07-01
2018-09-29
0000050863
intc:DesktopPlatformMember
2017-12-31
2018-09-29
0000050863
intc:OtherPlatformMember
2018-12-30
2019-09-28
0000050863
intc:NotebookPlatformMember
2019-06-30
2019-09-28
0000050863
intc:OtherProductOrServiceMember
2018-07-01
2018-09-29
0000050863
intc:DesktopPlatformMember
2018-07-01
2018-09-29
0000050863
intc:PlatformMember
2019-06-30
2019-09-28
0000050863
intc:IOTGPlatformMember
2018-07-01
2018-09-29
0000050863
intc:SoftwareServicesandOtherMember
2018-12-29
0000050863
intc:PrepaidSupplyAgreementsMember
2018-12-29
0000050863
intc:PrepaidSupplyAgreementsMember
2019-09-28
0000050863
intc:SoftwareServicesandOtherMember
2019-09-28
0000050863
intc:PrepaidSupplyAgreementsMember
2018-12-30
2019-09-28
0000050863
us-gaap:EmployeeSeveranceMember
intc:RestructuringProgramThreeMember
2019-06-30
2019-09-28
0000050863
us-gaap:EmployeeSeveranceMember
intc:RestructuringProgramThreeMember
2018-12-30
2019-09-28
0000050863
us-gaap:OtherRestructuringMember
intc:RestructuringProgramThreeMember
2018-12-30
2019-09-28
0000050863
intc:RestructuringProgramThreeMember
2018-12-30
2019-09-28
0000050863
intc:RestructuringProgramThreeMember
2019-06-30
2019-09-28
0000050863
us-gaap:OtherRestructuringMember
intc:RestructuringProgramThreeMember
2019-06-30
2019-09-28
0000050863
us-gaap:FixedIncomeSecuritiesMember
2018-12-29
0000050863
intc:GovernmentDebtSecuritiesMember
2018-12-29
0000050863
us-gaap:CorporateDebtSecuritiesMember
2019-09-28
0000050863
intc:GovernmentDebtSecuritiesMember
2019-09-28
0000050863
us-gaap:FixedIncomeSecuritiesMember
2019-09-28
0000050863
us-gaap:CorporateDebtSecuritiesMember
2018-12-29
0000050863
intc:ImFlashTechnologiesLlcMember
2017-12-31
2018-09-29
0000050863
intc:ImFlashTechnologiesLlcMember
2019-06-30
2019-09-28
0000050863
intc:ImFlashTechnologiesLlcMember
2018-12-30
2019-09-28
0000050863
intc:ASMLHoldingN.V.Member
2018-12-29
0000050863
intc:ImFlashTechnologiesLlcMember
2019-09-28
0000050863
intc:ImFlashTechnologiesLlcMember
2018-07-01
2018-09-29
0000050863
us-gaap:DebtSecuritiesMember
2017-12-31
2018-09-29
0000050863
us-gaap:DebtSecuritiesMember
2019-06-30
2019-09-28
0000050863
us-gaap:DebtSecuritiesMember
2018-12-30
2019-09-28
0000050863
us-gaap:DebtSecuritiesMember
2018-07-01
2018-09-29
0000050863
intc:ConvertibleDebenturesdue2039Member
us-gaap:ConvertibleDebtMember
2019-09-28
0000050863
intc:ConvertibleDebenturesdue2039Member
us-gaap:ConvertibleDebtMember
2017-12-31
2018-09-29
0000050863
intc:IndustrialAuthorityoftheCityofChandlerArizonaandStateofOregonBusinessDevelopmentCommissionRemarkedMember
us-gaap:UnsecuredDebtMember
2019-09-28
0000050863
srt:MinimumMember
intc:IndustrialAuthorityoftheCityofChandlerArizonaandStateofOregonBusinessDevelopmentCommissionRemarkedMember
us-gaap:UnsecuredDebtMember
2019-09-28
0000050863
intc:ConvertibleDebenturesdue2039Member
us-gaap:ConvertibleDebtMember
2018-12-30
2019-09-28
0000050863
srt:MaximumMember
intc:IndustrialAuthorityoftheCityofChandlerArizonaandStateofOregonBusinessDevelopmentCommissionRemarkedMember
us-gaap:UnsecuredDebtMember
2019-09-28
0000050863
intc:ConvertibleDebenturesdue2039Member
us-gaap:ConvertibleDebtMember
2018-09-29
0000050863
intc:IndustrialAuthorityoftheCityofChandlerArizonaMember
us-gaap:UnsecuredDebtMember
2019-09-28
0000050863
us-gaap:FairValueMeasurementsNonrecurringMember
2019-09-28
0000050863
us-gaap:FairValueMeasurementsNonrecurringMember
2018-12-29
0000050863
us-gaap:OtherCurrentAssetsMember
us-gaap:FairValueInputsLevel2Member
us-gaap:FairValueMeasurementsRecurringMember
2018-12-29
0000050863
intc:GovernmentDebtSecuritiesMember
us-gaap:FairValueInputsLevel2Member
us-gaap:FairValueMeasurementsRecurringMember
2018-12-29
0000050863
us-gaap:OtherCurrentAssetsMember
us-gaap:FairValueMeasurementsRecurringMember
2019-09-28
0000050863
us-gaap:OtherLongTermInvestmentsMember
us-gaap:CorporateDebtSecuritiesMember
us-gaap:FairValueMeasurementsRecurringMember
2019-09-28
0000050863
us-gaap:OtherNoncurrentAssetsMember
us-gaap:FairValueInputsLevel2Member
us-gaap:FairValueMeasurementsRecurringMember
2018-12-29
0000050863
us-gaap:ShortTermInvestmentsMember
us-gaap:CorporateDebtSecuritiesMember
us-gaap:FairValueMeasurementsRecurringMember
2018-12-29
0000050863
us-gaap:OtherLongTermInvestmentsMember
us-gaap:FixedIncomeSecuritiesMember
us-gaap:FairValueInputsLevel1Member
us-gaap:FairValueMeasurementsRecurringMember
2018-12-29
0000050863
us-gaap:OtherNoncurrentAssetsMember
us-gaap:FairValueMeasurementsRecurringMember
2019-09-28
0000050863
us-gaap:ShortTermInvestmentsMember
intc:GovernmentDebtSecuritiesMember
us-gaap:FairValueInputsLevel2Member
us-gaap:FairValueMeasurementsRecurringMember
2018-12-29
0000050863
us-gaap:OtherCurrentLiabilitiesMember
us-gaap:FairValueInputsLevel1Member
us-gaap:FairValueMeasurementsRecurringMember
2019-09-28
0000050863
us-gaap:CorporateDebtSecuritiesMember
us-gaap:FairValueMeasurementsRecurringMember
2018-12-29
0000050863
us-gaap:ShortTermInvestmentsMember
us-gaap:FixedIncomeSecuritiesMember
us-gaap:FairValueInputsLevel2Member
us-gaap:FairValueMeasurementsRecurringMember
2019-09-28
0000050863
intc:GovernmentDebtSecuritiesMember
us-gaap:FairValueInputsLevel1Member
us-gaap:FairValueMeasurementsRecurringMember
2018-12-29
0000050863
us-gaap:CorporateDebtSecuritiesMember
us-gaap:FairValueInputsLevel3Member
us-gaap:FairValueMeasurementsRecurringMember
2018-12-29
0000050863
us-gaap:FixedIncomeSecuritiesMember
us-gaap:FairValueInputsLevel2Member
us-gaap:FairValueMeasurementsRecurringMember
2019-09-28
0000050863
us-gaap:CashEquivalentsMember
us-gaap:FairValueMeasurementsRecurringMember
2019-09-28
0000050863
us-gaap:OtherLongTermInvestmentsMember
us-gaap:FixedIncomeSecuritiesMember
us-gaap:FairValueMeasurementsRecurringMember
2018-12-29
0000050863
us-gaap:ShortTermInvestmentsMember
us-gaap:FixedIncomeSecuritiesMember
us-gaap:FairValueInputsLevel2Member
us-gaap:FairValueMeasurementsRecurringMember
2018-12-29
0000050863
us-gaap:OtherNoncurrentAssetsMember
us-gaap:FairValueInputsLevel3Member
us-gaap:FairValueMeasurementsRecurringMember
2019-09-28
0000050863
intc:GovernmentDebtSecuritiesMember
us-gaap:FairValueInputsLevel3Member
us-gaap:FairValueMeasurementsRecurringMember
2019-09-28
0000050863
us-gaap:CashEquivalentsMember
us-gaap:FixedIncomeSecuritiesMember
us-gaap:FairValueInputsLevel3Member
us-gaap:FairValueMeasurementsRecurringMember
2019-09-28
0000050863
us-gaap:FairValueInputsLevel2Member
us-gaap:FairValueMeasurementsRecurringMember
2019-09-28
0000050863
us-gaap:ShortTermInvestmentsMember
us-gaap:CorporateDebtSecuritiesMember
us-gaap:FairValueMeasurementsRecurringMember
2019-09-28
0000050863
us-gaap:FairValueHedgingMember
us-gaap:OtherNonoperatingIncomeExpenseMember
2018-12-30
2019-09-28
0000050863
us-gaap:NondesignatedMember
2018-12-30
2019-09-28
0000050863
intc:GovernmentDebtSecuritiesMember
us-gaap:FairValueMeasurementsRecurringMember
2019-09-28
0000050863
us-gaap:ShortTermInvestmentsMember
us-gaap:FixedIncomeSecuritiesMember
us-gaap:FairValueInputsLevel1Member
us-gaap:FairValueMeasurementsRecurringMember
2019-09-28
0000050863
us-gaap:FairValueInputsLevel1Member
us-gaap:FairValueMeasurementsRecurringMember
2019-09-28
0000050863
us-gaap:FairValueInputsLevel3Member
us-gaap:FairValueMeasurementsRecurringMember
2019-09-28
0000050863
us-gaap:OtherNoncurrentAssetsMember
us-gaap:FairValueInputsLevel1Member
us-gaap:FairValueMeasurementsRecurringMember
2019-09-28
0000050863
us-gaap:FairValueInputsLevel1Member
us-gaap:FairValueMeasurementsRecurringMember
2018-12-29
0000050863
us-gaap:OtherLongTermInvestmentsMember
intc:GovernmentDebtSecuritiesMember
us-gaap:FairValueInputsLevel2Member
us-gaap:FairValueMeasurementsRecurringMember
2019-09-28
0000050863
intc:GovernmentDebtSecuritiesMember
us-gaap:FairValueInputsLevel1Member
us-gaap:FairValueMeasurementsRecurringMember
2019-09-28
0000050863
us-gaap:OtherLongTermInvestmentsMember
intc:GovernmentDebtSecuritiesMember
us-gaap:FairValueInputsLevel1Member
us-gaap:FairValueMeasurementsRecurringMember
2018-12-29
0000050863
us-gaap:OtherCurrentAssetsMember
us-gaap:FairValueInputsLevel2Member
us-gaap:FairValueMeasurementsRecurringMember
2019-09-28
0000050863
us-gaap:CashEquivalentsMember
us-gaap:FixedIncomeSecuritiesMember
us-gaap:FairValueMeasurementsRecurringMember
2018-12-29
0000050863
us-gaap:ShortTermInvestmentsMember
us-gaap:CorporateDebtSecuritiesMember
us-gaap:FairValueInputsLevel1Member
us-gaap:FairValueMeasurementsRecurringMember
2018-12-29
0000050863
us-gaap:ShortTermInvestmentsMember
us-gaap:FixedIncomeSecuritiesMember
us-gaap:FairValueInputsLevel3Member
us-gaap:FairValueMeasurementsRecurringMember
2019-09-28
0000050863
us-gaap:ShortTermInvestmentsMember
us-gaap:CorporateDebtSecuritiesMember
us-gaap:FairValueInputsLevel3Member
us-gaap:FairValueMeasurementsRecurringMember
2019-09-28
0000050863
us-gaap:ShortTermInvestmentsMember
intc:GovernmentDebtSecuritiesMember
us-gaap:FairValueInputsLevel3Member
us-gaap:FairValueMeasurementsRecurringMember
2018-12-29
0000050863
us-gaap:OtherLongTermInvestmentsMember
intc:GovernmentDebtSecuritiesMember
us-gaap:FairValueInputsLevel1Member
us-gaap:FairValueMeasurementsRecurringMember
2019-09-28
0000050863
us-gaap:CashEquivalentsMember
us-gaap:FixedIncomeSecuritiesMember
us-gaap:FairValueInputsLevel3Member
us-gaap:FairValueMeasurementsRecurringMember
2018-12-29
0000050863
us-gaap:CashEquivalentsMember
us-gaap:FairValueInputsLevel3Member
us-gaap:FairValueMeasurementsRecurringMember
2019-09-28
0000050863
us-gaap:FixedIncomeSecuritiesMember
us-gaap:FairValueInputsLevel1Member
us-gaap:FairValueMeasurementsRecurringMember
2018-12-29
0000050863
us-gaap:OtherCurrentLiabilitiesMember
us-gaap:FairValueMeasurementsRecurringMember
2018-12-29
0000050863
intc:GovernmentDebtSecuritiesMember
us-gaap:FairValueInputsLevel2Member
us-gaap:FairValueMeasurementsRecurringMember
2019-09-28
0000050863
us-gaap:OtherCurrentLiabilitiesMember
us-gaap:FairValueMeasurementsRecurringMember
2019-09-28
0000050863
us-gaap:CashEquivalentsMember
us-gaap:CorporateDebtSecuritiesMember
us-gaap:FairValueMeasurementsRecurringMember
2019-09-28
0000050863
us-gaap:OtherNoncurrentLiabilitiesMember
us-gaap:FairValueInputsLevel2Member
us-gaap:FairValueMeasurementsRecurringMember
2018-12-29
0000050863
us-gaap:ShortTermInvestmentsMember
intc:GovernmentDebtSecuritiesMember
us-gaap:FairValueInputsLevel2Member
us-gaap:FairValueMeasurementsRecurringMember
2019-09-28
0000050863
us-gaap:CashEquivalentsMember
us-gaap:CorporateDebtSecuritiesMember
us-gaap:FairValueInputsLevel2Member
us-gaap:FairValueMeasurementsRecurringMember
2019-09-28
0000050863
intc:GovernmentDebtSecuritiesMember
us-gaap:FairValueInputsLevel3Member
us-gaap:FairValueMeasurementsRecurringMember
2018-12-29
0000050863
us-gaap:OtherLongTermInvestmentsMember
us-gaap:CorporateDebtSecuritiesMember
us-gaap:FairValueMeasurementsRecurringMember
2018-12-29
0000050863
us-gaap:CorporateDebtSecuritiesMember
us-gaap:FairValueInputsLevel1Member
us-gaap:FairValueMeasurementsRecurringMember
2019-09-28
0000050863
us-gaap:OtherNoncurrentLiabilitiesMember
us-gaap:FairValueInputsLevel1Member
us-gaap:FairValueMeasurementsRecurringMember
2018-12-29
0000050863
us-gaap:ShortTermInvestmentsMember
us-gaap:CorporateDebtSecuritiesMember
us-gaap:FairValueInputsLevel3Member
us-gaap:FairValueMeasurementsRecurringMember
2018-12-29
0000050863
us-gaap:ShortTermInvestmentsMember
intc:GovernmentDebtSecuritiesMember
us-gaap:FairValueInputsLevel1Member
us-gaap:FairValueMeasurementsRecurringMember
2018-12-29
0000050863
us-gaap:OtherCurrentAssetsMember
us-gaap:FairValueInputsLevel3Member
us-gaap:FairValueMeasurementsRecurringMember
2019-09-28
0000050863
us-gaap:OtherLongTermInvestmentsMember
us-gaap:FixedIncomeSecuritiesMember
us-gaap:FairValueInputsLevel2Member
us-gaap:FairValueMeasurementsRecurringMember
2019-09-28
0000050863
us-gaap:ShortTermInvestmentsMember
intc:GovernmentDebtSecuritiesMember
us-gaap:FairValueInputsLevel1Member
us-gaap:FairValueMeasurementsRecurringMember
2019-09-28
0000050863
us-gaap:OtherNoncurrentAssetsMember
us-gaap:FairValueInputsLevel2Member
us-gaap:FairValueMeasurementsRecurringMember
2019-09-28
0000050863
us-gaap:OtherLongTermInvestmentsMember
intc:GovernmentDebtSecuritiesMember
us-gaap:FairValueMeasurementsRecurringMember
2018-12-29
0000050863
us-gaap:OtherLongTermInvestmentsMember
us-gaap:FixedIncomeSecuritiesMember
us-gaap:FairValueInputsLevel3Member
us-gaap:FairValueMeasurementsRecurringMember
2019-09-28
0000050863
us-gaap:OtherCurrentAssetsMember
us-gaap:FairValueInputsLevel1Member
us-gaap:FairValueMeasurementsRecurringMember
2018-12-29
0000050863
us-gaap:OtherLongTermInvestmentsMember
us-gaap:FixedIncomeSecuritiesMember
us-gaap:FairValueInputsLevel1Member
us-gaap:FairValueMeasurementsRecurringMember
2019-09-28
0000050863
us-gaap:FixedIncomeSecuritiesMember
us-gaap:FairValueInputsLevel3Member
us-gaap:FairValueMeasurementsRecurringMember
2018-12-29
0000050863
us-gaap:ShortTermInvestmentsMember
us-gaap:FixedIncomeSecuritiesMember
us-gaap:FairValueInputsLevel3Member
us-gaap:FairValueMeasurementsRecurringMember
2018-12-29
0000050863
us-gaap:OtherLongTermInvestmentsMember
us-gaap:CorporateDebtSecuritiesMember
us-gaap:FairValueInputsLevel1Member
us-gaap:FairValueMeasurementsRecurringMember
2019-09-28
0000050863
us-gaap:OtherCurrentAssetsMember
us-gaap:FairValueMeasurementsRecurringMember
2018-12-29
0000050863
us-gaap:FixedIncomeSecuritiesMember
us-gaap:FairValueInputsLevel2Member
us-gaap:FairValueMeasurementsRecurringMember
2018-12-29
0000050863
us-gaap:CashEquivalentsMember
us-gaap:CorporateDebtSecuritiesMember
us-gaap:FairValueInputsLevel3Member
us-gaap:FairValueMeasurementsRecurringMember
2019-09-28
0000050863
us-gaap:OtherNoncurrentAssetsMember
us-gaap:FairValueInputsLevel3Member
us-gaap:FairValueMeasurementsRecurringMember
2018-12-29
0000050863
us-gaap:OtherNoncurrentAssetsMember
us-gaap:FairValueMeasurementsRecurringMember
2018-12-29
0000050863
us-gaap:OtherCurrentAssetsMember
us-gaap:FairValueInputsLevel3Member
us-gaap:FairValueMeasurementsRecurringMember
2018-12-29
0000050863
us-gaap:FixedIncomeSecuritiesMember
us-gaap:FairValueInputsLevel1Member
us-gaap:FairValueMeasurementsRecurringMember
2019-09-28
0000050863
us-gaap:OtherNoncurrentLiabilitiesMember
us-gaap:FairValueInputsLevel3Member
us-gaap:FairValueMeasurementsRecurringMember
2019-09-28
0000050863
us-gaap:OtherLongTermInvestmentsMember
intc:GovernmentDebtSecuritiesMember
us-gaap:FairValueInputsLevel2Member
us-gaap:FairValueMeasurementsRecurringMember
2018-12-29
0000050863
us-gaap:CashEquivalentsMember
us-gaap:FixedIncomeSecuritiesMember
us-gaap:FairValueInputsLevel2Member
us-gaap:FairValueMeasurementsRecurringMember
2019-09-28
0000050863
us-gaap:OtherNoncurrentLiabilitiesMember
us-gaap:FairValueInputsLevel1Member
us-gaap:FairValueMeasurementsRecurringMember
2019-09-28
0000050863
us-gaap:ShortTermInvestmentsMember
us-gaap:FixedIncomeSecuritiesMember
us-gaap:FairValueInputsLevel1Member
us-gaap:FairValueMeasurementsRecurringMember
2018-12-29
0000050863
us-gaap:OtherLongTermInvestmentsMember
us-gaap:CorporateDebtSecuritiesMember
us-gaap:FairValueInputsLevel2Member
us-gaap:FairValueMeasurementsRecurringMember
2019-09-28
0000050863
us-gaap:OtherNoncurrentLiabilitiesMember
us-gaap:FairValueMeasurementsRecurringMember
2018-12-29
0000050863
us-gaap:CorporateDebtSecuritiesMember
us-gaap:FairValueInputsLevel3Member
us-gaap:FairValueMeasurementsRecurringMember
2019-09-28
0000050863
us-gaap:FixedIncomeSecuritiesMember
us-gaap:FairValueMeasurementsRecurringMember
2018-12-29
0000050863
us-gaap:OtherCurrentAssetsMember
us-gaap:FairValueInputsLevel1Member
us-gaap:FairValueMeasurementsRecurringMember
2019-09-28
0000050863
us-gaap:CashEquivalentsMember
us-gaap:CorporateDebtSecuritiesMember
us-gaap:FairValueInputsLevel3Member
us-gaap:FairValueMeasurementsRecurringMember
2018-12-29
0000050863
us-gaap:OtherCurrentLiabilitiesMember
us-gaap:FairValueInputsLevel3Member
us-gaap:FairValueMeasurementsRecurringMember
2019-09-28
0000050863
us-gaap:FixedIncomeSecuritiesMember
us-gaap:FairValueInputsLevel3Member
us-gaap:FairValueMeasurementsRecurringMember
2019-09-28
0000050863
us-gaap:FairValueMeasurementsRecurringMember
2018-12-29
0000050863
us-gaap:OtherLongTermInvestmentsMember
us-gaap:CorporateDebtSecuritiesMember
us-gaap:FairValueInputsLevel1Member
us-gaap:FairValueMeasurementsRecurringMember
2018-12-29
0000050863
us-gaap:FairValueMeasurementsRecurringMember
2019-09-28
0000050863
us-gaap:ShortTermInvestmentsMember
us-gaap:FixedIncomeSecuritiesMember
us-gaap:FairValueMeasurementsRecurringMember
2018-12-29
0000050863
us-gaap:OtherLongTermInvestmentsMember
intc:GovernmentDebtSecuritiesMember
us-gaap:FairValueMeasurementsRecurringMember
2019-09-28
0000050863
us-gaap:ShortTermInvestmentsMember
us-gaap:FixedIncomeSecuritiesMember
us-gaap:FairValueMeasurementsRecurringMember
2019-09-28
0000050863
us-gaap:OtherLongTermInvestmentsMember
intc:GovernmentDebtSecuritiesMember
us-gaap:FairValueInputsLevel3Member
us-gaap:FairValueMeasurementsRecurringMember
2019-09-28
0000050863
us-gaap:CorporateDebtSecuritiesMember
us-gaap:FairValueInputsLevel2Member
us-gaap:FairValueMeasurementsRecurringMember
2018-12-29
0000050863
us-gaap:ShortTermInvestmentsMember
us-gaap:CorporateDebtSecuritiesMember
us-gaap:FairValueInputsLevel2Member
us-gaap:FairValueMeasurementsRecurringMember
2019-09-28
0000050863
us-gaap:FairValueInputsLevel3Member
us-gaap:FairValueMeasurementsRecurringMember
2018-12-29
0000050863
us-gaap:CashEquivalentsMember
us-gaap:CorporateDebtSecuritiesMember
us-gaap:FairValueMeasurementsRecurringMember
2018-12-29
0000050863
us-gaap:ShortTermInvestmentsMember
us-gaap:CorporateDebtSecuritiesMember
us-gaap:FairValueInputsLevel1Member
us-gaap:FairValueMeasurementsRecurringMember
2019-09-28
0000050863
us-gaap:OtherLongTermInvestmentsMember
us-gaap:CorporateDebtSecuritiesMember
us-gaap:FairValueInputsLevel3Member
us-gaap:FairValueMeasurementsRecurringMember
2019-09-28
0000050863
us-gaap:CashEquivalentsMember
us-gaap:CorporateDebtSecuritiesMember
us-gaap:FairValueInputsLevel1Member
us-gaap:FairValueMeasurementsRecurringMember
2018-12-29
0000050863
us-gaap:EquitySecuritiesMember
us-gaap:FairValueMeasurementsRecurringMember
2019-09-28
0000050863
us-gaap:EquitySecuritiesMember
us-gaap:FairValueInputsLevel3Member
us-gaap:FairValueMeasurementsRecurringMember
2019-09-28
0000050863
intc:GovernmentDebtSecuritiesMember
us-gaap:FairValueMeasurementsRecurringMember
2018-12-29
0000050863
us-gaap:EquitySecuritiesMember
us-gaap:FairValueInputsLevel2Member
us-gaap:FairValueMeasurementsRecurringMember
2018-12-29
0000050863
us-gaap:OtherCurrentLiabilitiesMember
us-gaap:FairValueInputsLevel3Member
us-gaap:FairValueMeasurementsRecurringMember
2018-12-29
0000050863
us-gaap:EquitySecuritiesMember
us-gaap:FairValueInputsLevel3Member
us-gaap:FairValueMeasurementsRecurringMember
2018-12-29
0000050863
us-gaap:OtherLongTermInvestmentsMember
intc:GovernmentDebtSecuritiesMember
us-gaap:FairValueInputsLevel3Member
us-gaap:FairValueMeasurementsRecurringMember
2018-12-29
0000050863
us-gaap:OtherNoncurrentLiabilitiesMember
us-gaap:FairValueInputsLevel3Member
us-gaap:FairValueMeasurementsRecurringMember
2018-12-29
0000050863
us-gaap:CorporateDebtSecuritiesMember
us-gaap:FairValueInputsLevel1Member
us-gaap:FairValueMeasurementsRecurringMember
2018-12-29
0000050863
us-gaap:ShortTermInvestmentsMember
intc:GovernmentDebtSecuritiesMember
us-gaap:FairValueInputsLevel3Member
us-gaap:FairValueMeasurementsRecurringMember
2019-09-28
0000050863
us-gaap:CashEquivalentsMember
us-gaap:FixedIncomeSecuritiesMember
us-gaap:FairValueInputsLevel1Member
us-gaap:FairValueMeasurementsRecurringMember
2019-09-28
0000050863
us-gaap:CorporateDebtSecuritiesMember
us-gaap:FairValueMeasurementsRecurringMember
2019-09-28
0000050863
us-gaap:CashEquivalentsMember
us-gaap:FairValueInputsLevel2Member
us-gaap:FairValueMeasurementsRecurringMember
2018-12-29
0000050863
us-gaap:ShortTermInvestmentsMember
intc:GovernmentDebtSecuritiesMember
us-gaap:FairValueMeasurementsRecurringMember
2019-09-28
0000050863
us-gaap:CashEquivalentsMember
us-gaap:CorporateDebtSecuritiesMember
us-gaap:FairValueInputsLevel1Member
us-gaap:FairValueMeasurementsRecurringMember
2019-09-28
0000050863
us-gaap:EquitySecuritiesMember
us-gaap:FairValueInputsLevel1Member
us-gaap:FairValueMeasurementsRecurringMember
2018-12-29
0000050863
us-gaap:OtherLongTermInvestmentsMember
us-gaap:CorporateDebtSecuritiesMember
us-gaap:FairValueInputsLevel3Member
us-gaap:FairValueMeasurementsRecurringMember
2018-12-29
0000050863
us-gaap:OtherCurrentLiabilitiesMember
us-gaap:FairValueInputsLevel1Member
us-gaap:FairValueMeasurementsRecurringMember
2018-12-29
0000050863
us-gaap:CashEquivalentsMember
us-gaap:CorporateDebtSecuritiesMember
us-gaap:FairValueInputsLevel2Member
us-gaap:FairValueMeasurementsRecurringMember
2018-12-29
0000050863
us-gaap:OtherCurrentLiabilitiesMember
us-gaap:FairValueInputsLevel2Member
us-gaap:FairValueMeasurementsRecurringMember
2018-12-29
0000050863
us-gaap:EquitySecuritiesMember
us-gaap:FairValueInputsLevel1Member
us-gaap:FairValueMeasurementsRecurringMember
2019-09-28
0000050863
us-gaap:EquitySecuritiesMember
us-gaap:FairValueInputsLevel2Member
us-gaap:FairValueMeasurementsRecurringMember
2019-09-28
0000050863
us-gaap:OtherLongTermInvestmentsMember
us-gaap:FixedIncomeSecuritiesMember
us-gaap:FairValueInputsLevel3Member
us-gaap:FairValueMeasurementsRecurringMember
2018-12-29
0000050863
us-gaap:OtherCurrentLiabilitiesMember
us-gaap:FairValueInputsLevel2Member
us-gaap:FairValueMeasurementsRecurringMember
2019-09-28
0000050863
us-gaap:CorporateDebtSecuritiesMember
us-gaap:FairValueInputsLevel2Member
us-gaap:FairValueMeasurementsRecurringMember
2019-09-28
0000050863
us-gaap:ShortTermInvestmentsMember
intc:GovernmentDebtSecuritiesMember
us-gaap:FairValueMeasurementsRecurringMember
2018-12-29
0000050863
us-gaap:ShortTermInvestmentsMember
us-gaap:CorporateDebtSecuritiesMember
us-gaap:FairValueInputsLevel2Member
us-gaap:FairValueMeasurementsRecurringMember
2018-12-29
0000050863
us-gaap:OtherLongTermInvestmentsMember
us-gaap:FixedIncomeSecuritiesMember
us-gaap:FairValueInputsLevel2Member
us-gaap:FairValueMeasurementsRecurringMember
2018-12-29
0000050863
us-gaap:OtherNoncurrentAssetsMember
us-gaap:FairValueInputsLevel1Member
us-gaap:FairValueMeasurementsRecurringMember
2018-12-29
0000050863
us-gaap:CashEquivalentsMember
us-gaap:FairValueInputsLevel3Member
us-gaap:FairValueMeasurementsRecurringMember
2018-12-29
0000050863
us-gaap:EquitySecuritiesMember
us-gaap:FairValueMeasurementsRecurringMember
2018-12-29
0000050863
us-gaap:FairValueInputsLevel2Member
us-gaap:FairValueMeasurementsRecurringMember
2018-12-29
0000050863
us-gaap:OtherNoncurrentLiabilitiesMember
us-gaap:FairValueMeasurementsRecurringMember
2019-09-28
0000050863
us-gaap:CashEquivalentsMember
us-gaap:FairValueMeasurementsRecurringMember
2018-12-29
0000050863
us-gaap:CashEquivalentsMember
us-gaap:FairValueInputsLevel1Member
us-gaap:FairValueMeasurementsRecurringMember
2018-12-29
0000050863
us-gaap:CashEquivalentsMember
us-gaap:FixedIncomeSecuritiesMember
us-gaap:FairValueInputsLevel1Member
us-gaap:FairValueMeasurementsRecurringMember
2018-12-29
0000050863
us-gaap:CashEquivalentsMember
us-gaap:FairValueInputsLevel1Member
us-gaap:FairValueMeasurementsRecurringMember
2019-09-28
0000050863
us-gaap:CashEquivalentsMember
us-gaap:FairValueInputsLevel2Member
us-gaap:FairValueMeasurementsRecurringMember
2019-09-28
0000050863
us-gaap:OtherLongTermInvestmentsMember
us-gaap:CorporateDebtSecuritiesMember
us-gaap:FairValueInputsLevel2Member
us-gaap:FairValueMeasurementsRecurringMember
2018-12-29
0000050863
us-gaap:OtherLongTermInvestmentsMember
us-gaap:FixedIncomeSecuritiesMember
us-gaap:FairValueMeasurementsRecurringMember
2019-09-28
0000050863
us-gaap:OtherNoncurrentLiabilitiesMember
us-gaap:FairValueInputsLevel2Member
us-gaap:FairValueMeasurementsRecurringMember
2019-09-28
0000050863
us-gaap:FixedIncomeSecuritiesMember
us-gaap:FairValueMeasurementsRecurringMember
2019-09-28
0000050863
us-gaap:CashEquivalentsMember
us-gaap:FixedIncomeSecuritiesMember
us-gaap:FairValueInputsLevel2Member
us-gaap:FairValueMeasurementsRecurringMember
2018-12-29
0000050863
us-gaap:CashEquivalentsMember
us-gaap:FixedIncomeSecuritiesMember
us-gaap:FairValueMeasurementsRecurringMember
2019-09-28
0000050863
us-gaap:ForeignExchangeContractMember
2019-06-30
2019-09-28
0000050863
us-gaap:InterestRateSwapMember
us-gaap:FairValueHedgingMember
2019-09-28
0000050863
us-gaap:ForeignExchangeContractMember
2017-12-31
2018-09-29
0000050863
us-gaap:ForeignExchangeContractMember
2018-07-01
2018-09-29
0000050863
us-gaap:LongTermDebtMember
us-gaap:InterestRateSwapMember
us-gaap:FairValueHedgingMember
2019-09-28
0000050863
us-gaap:ForeignExchangeContractMember
2018-12-30
2019-09-28
0000050863
us-gaap:LongTermDebtMember
us-gaap:InterestRateSwapMember
us-gaap:FairValueHedgingMember
2018-12-29
0000050863
us-gaap:LongTermDebtMember
us-gaap:InterestRateSwapMember
us-gaap:FairValueHedgingMember
2017-12-31
2018-12-29
0000050863
us-gaap:LongTermDebtMember
us-gaap:InterestRateSwapMember
us-gaap:FairValueHedgingMember
2018-12-30
2019-09-28
0000050863
us-gaap:ForeignExchangeContractMember
2018-12-29
0000050863
us-gaap:OtherContractMember
2018-12-29
0000050863
us-gaap:InterestRateContractMember
2019-09-28
0000050863
us-gaap:OtherContractMember
2019-09-28
0000050863
us-gaap:ForeignExchangeContractMember
2019-09-28
0000050863
us-gaap:InterestRateContractMember
2018-12-29
0000050863
us-gaap:OtherAssetsMember
us-gaap:OtherContractMember
us-gaap:NondesignatedMember
2018-12-29
0000050863
us-gaap:OtherLiabilitiesMember
us-gaap:ForeignExchangeContractMember
us-gaap:NondesignatedMember
2019-09-28
0000050863
us-gaap:OtherLiabilitiesMember
us-gaap:InterestRateContractMember
us-gaap:DesignatedAsHedgingInstrumentMember
2018-12-29
0000050863
us-gaap:OtherLiabilitiesMember
us-gaap:InterestRateContractMember
us-gaap:NondesignatedMember
2018-12-29
0000050863
us-gaap:OtherLiabilitiesMember
us-gaap:OtherContractMember
us-gaap:NondesignatedMember
2018-12-29
0000050863
us-gaap:OtherLiabilitiesMember
us-gaap:OtherContractMember
us-gaap:NondesignatedMember
2019-09-28
0000050863
us-gaap:OtherAssetsMember
us-gaap:NondesignatedMember
2018-12-29
0000050863
us-gaap:OtherAssetsMember
us-gaap:OtherContractMember
us-gaap:NondesignatedMember
2019-09-28
0000050863
us-gaap:OtherAssetsMember
us-gaap:DesignatedAsHedgingInstrumentMember
2018-12-29
0000050863
us-gaap:OtherLiabilitiesMember
us-gaap:ForeignExchangeContractMember
us-gaap:DesignatedAsHedgingInstrumentMember
2018-12-29
0000050863
us-gaap:OtherAssetsMember
2019-09-28
0000050863
us-gaap:OtherLiabilitiesMember
us-gaap:ForeignExchangeContractMember
us-gaap:NondesignatedMember
2018-12-29
0000050863
us-gaap:OtherAssetsMember
us-gaap:ForeignExchangeContractMember
us-gaap:NondesignatedMember
2018-12-29
0000050863
us-gaap:OtherAssetsMember
us-gaap:InterestRateContractMember
us-gaap:DesignatedAsHedgingInstrumentMember
2018-12-29
0000050863
us-gaap:OtherAssetsMember
us-gaap:ForeignExchangeContractMember
us-gaap:DesignatedAsHedgingInstrumentMember
2019-09-28
0000050863
us-gaap:OtherAssetsMember
us-gaap:NondesignatedMember
2019-09-28
0000050863
us-gaap:OtherLiabilitiesMember
2018-12-29
0000050863
us-gaap:OtherLiabilitiesMember
us-gaap:ForeignExchangeContractMember
us-gaap:DesignatedAsHedgingInstrumentMember
2019-09-28
0000050863
us-gaap:OtherLiabilitiesMember
us-gaap:DesignatedAsHedgingInstrumentMember
2018-12-29
0000050863
us-gaap:OtherAssetsMember
us-gaap:InterestRateContractMember
us-gaap:DesignatedAsHedgingInstrumentMember
2019-09-28
0000050863
us-gaap:OtherLiabilitiesMember
us-gaap:InterestRateContractMember
us-gaap:DesignatedAsHedgingInstrumentMember
2019-09-28
0000050863
us-gaap:OtherLiabilitiesMember
2019-09-28
0000050863
us-gaap:OtherAssetsMember
us-gaap:DesignatedAsHedgingInstrumentMember
2019-09-28
0000050863
us-gaap:OtherAssetsMember
2018-12-29
0000050863
us-gaap:OtherAssetsMember
us-gaap:ForeignExchangeContractMember
us-gaap:NondesignatedMember
2019-09-28
0000050863
us-gaap:OtherAssetsMember
us-gaap:InterestRateContractMember
us-gaap:NondesignatedMember
2018-12-29
0000050863
us-gaap:OtherAssetsMember
us-gaap:ForeignExchangeContractMember
us-gaap:DesignatedAsHedgingInstrumentMember
2018-12-29
0000050863
us-gaap:OtherLiabilitiesMember
us-gaap:DesignatedAsHedgingInstrumentMember
2019-09-28
0000050863
us-gaap:OtherLiabilitiesMember
us-gaap:InterestRateContractMember
us-gaap:NondesignatedMember
2019-09-28
0000050863
us-gaap:OtherLiabilitiesMember
us-gaap:NondesignatedMember
2018-12-29
0000050863
us-gaap:OtherAssetsMember
us-gaap:InterestRateContractMember
us-gaap:NondesignatedMember
2019-09-28
0000050863
us-gaap:OtherLiabilitiesMember
us-gaap:NondesignatedMember
2019-09-28
0000050863
us-gaap:ForeignExchangeContractMember
us-gaap:NondesignatedMember
us-gaap:OtherNonoperatingIncomeExpenseMember
2017-12-31
2018-09-29
0000050863
us-gaap:OtherContractMember
us-gaap:NondesignatedMember
intc:VariousMember
2018-07-01
2018-09-29
0000050863
us-gaap:InterestRateContractMember
us-gaap:NondesignatedMember
us-gaap:OtherNonoperatingIncomeExpenseMember
2019-06-30
2019-09-28
0000050863
us-gaap:NondesignatedMember
2018-07-01
2018-09-29
0000050863
us-gaap:ForeignExchangeContractMember
us-gaap:NondesignatedMember
us-gaap:OtherNonoperatingIncomeExpenseMember
2018-12-30
2019-09-28
0000050863
us-gaap:NondesignatedMember
2017-12-31
2018-09-29
0000050863
us-gaap:ForeignExchangeContractMember
us-gaap:NondesignatedMember
us-gaap:OtherNonoperatingIncomeExpenseMember
2018-07-01
2018-09-29
0000050863
us-gaap:OtherContractMember
us-gaap:NondesignatedMember
intc:VariousMember
2017-12-31
2018-09-29
0000050863
us-gaap:OtherContractMember
us-gaap:NondesignatedMember
intc:VariousMember
2018-12-30
2019-09-28
0000050863
us-gaap:OtherContractMember
us-gaap:NondesignatedMember
intc:VariousMember
2019-06-30
2019-09-28
0000050863
us-gaap:ForeignExchangeContractMember
us-gaap:NondesignatedMember
us-gaap:OtherNonoperatingIncomeExpenseMember
2019-06-30
2019-09-28
0000050863
us-gaap:InterestRateContractMember
us-gaap:NondesignatedMember
us-gaap:OtherNonoperatingIncomeExpenseMember
2017-12-31
2018-09-29
0000050863
us-gaap:InterestRateContractMember
us-gaap:NondesignatedMember
us-gaap:OtherNonoperatingIncomeExpenseMember
2018-07-01
2018-09-29
0000050863
us-gaap:InterestRateContractMember
us-gaap:NondesignatedMember
us-gaap:OtherNonoperatingIncomeExpenseMember
2018-12-30
2019-09-28
0000050863
us-gaap:NondesignatedMember
2019-06-30
2019-09-28
0000050863
us-gaap:InterestRateContractMember
2019-06-30
2019-09-28
0000050863
us-gaap:InterestRateContractMember
2018-07-01
2018-09-29
0000050863
us-gaap:InterestRateContractMember
2017-12-31
2018-09-29
0000050863
us-gaap:InterestRateContractMember
2018-12-30
2019-09-28
0000050863
intc:EcFineMember
2009-05-01
2009-05-31
0000050863
intc:ShareholderDerivativeActionMember
us-gaap:PendingLitigationMember
2018-12-30
2019-09-28
0000050863
intc:McAfeeShareholderLitigationMember
intc:McAfeeIncMember
us-gaap:PendingLitigationMember
2012-06-01
2012-06-30
0000050863
intc:McAfeeShareholderLitigationMember
intc:McAfeeIncMember
2010-08-19
0000050863
intc:ClassActionDomain
us-gaap:PendingLitigationMember
2018-12-30
2019-09-28
0000050863
intc:SecuritiesClassActionDomain
us-gaap:PendingLitigationMember
2018-12-30
2019-09-28
iso4217:USD
xbrli:pure
iso4217:USD
xbrli:shares
xbrli:shares
iso4217:EUR
intc:lawsuit
UNITED STATES SECURITIES AND EXCHANGE COMMISSION
Washington, D.C. 20549
FORM 10-Q
(Mark One)
|
| | | |
| ☑ | QUARTERLY REPORT PURSUANT TO SECTION 13 OR 15(d) OF THE SECURITIES EXCHANGE ACT OF 1934 |
| | For the quarterly period ended | September 28, 2019 |
Or
|
| | |
| ☐ | TRANSITION REPORT PURSUANT TO SECTION 13 OR 15(d) OF THE SECURITIES EXCHANGE ACT OF 1934 |
| | For the transition period from to |
Commission File Number 000-06217
INTEL CORPORATION
(Exact name of registrant as specified in its charter)
|
| | | | |
| Delaware | | | 94-1672743 |
(State or other jurisdiction of incorporation or organization) | | (I.R.S. Employer Identification No.) |
2200 Mission College Boulevard, | Santa Clara, | California | | 95054-1549 |
(Address of principal executive offices) | | (Zip Code) |
(408) 765-8080
(Registrant’s telephone number, including area code)
N/A
(Former name, former address and former fiscal year, if changed since last report)
Securities registered pursuant to Section 12(b) of the Act:
|
| | |
Title of each class | Trading Symbol(s) | Name of each exchange on which registered |
Common stock, $0.001 par value | INTC | Nasdaq Global Select Market |
Indicate by check mark whether the registrant (1) has filed all reports required to be filed by Section 13 or 15(d) of the Securities Exchange Act of 1934 during the preceding 12 months (or for such shorter period that the registrant was required to file such reports), and (2) has been subject to such filing requirements for the past 90 days. Yes ☑ No ¨
Indicate by check mark whether the registrant has submitted electronically every Interactive Data File required to be submitted pursuant to Rule 405 of Regulation S-T (§232.405 of this chapter) during the preceding 12 months (or for such shorter period that the registrant was required to submit such files). Yes ☑ No ¨
Indicate by check mark whether the registrant is a large accelerated filer, an accelerated filer, a non-accelerated filer, a smaller reporting company, or an emerging growth company. See the definitions of “large accelerated filer,” “accelerated filer,” “smaller reporting company,” and "emerging growth company" in Rule 12b-2 of the Exchange Act.
|
| | | | |
Large Accelerated Filer | Accelerated filer | Non-accelerated filer | Smaller reporting company | Emerging growth company |
☑ | ¨ | ¨ | ☐ | ☐ |
If an emerging growth company, indicate by check mark if the registrant has elected not to use the extended transition period for complying with any new or revised financial accounting standards provided pursuant to Section 13(a) of the Exchange Act. ¨
Indicate by check mark whether the registrant is a shell company (as defined in Rule 12b-2 of the Exchange Act). Yes ☐ No ☑
As of September 28, 2019, the registrant had outstanding 4,350 million shares of common stock.
TABLE OF CONTENTS
THE ORGANIZATION OF OUR QUARTERLY REPORT ON FORM 10-Q
The order and presentation of content in our Quarterly Report on Form 10-Q (Form 10-Q) differs from the traditional U.S. Securities and Exchange Commission (SEC) Form 10-Q format. We believe that our format improves readability and better presents how we organize and manage our business. See "Form 10-Q Cross-Reference Index" within Other Key Information for a cross-reference index to the traditional SEC Form 10-Q format.
The preparation of our consolidated condensed financial statements is in conformity with U.S. generally accepted accounting principles (GAAP). We have included key metrics that we use to measure our business, some of which are non-GAAP measures. See these "Non-GAAP Financial Measures" within Other Key Information. |
| | | |
| | | Page |
FORWARD-LOOKING STATEMENTS | |
A QUARTER IN REVIEW | |
CONSOLIDATED CONDENSED FINANCIAL STATEMENTS AND SUPPLEMENTAL DETAILS | |
| Consolidated Condensed Statements of Income | |
| Consolidated Condensed Statements of Comprehensive Income | |
| Consolidated Condensed Balance Sheets | |
| Consolidated Condensed Statements of Cash Flows | |
| Consolidated Condensed Statements of Stockholders' Equity | |
| Notes to Consolidated Condensed Financial Statements | |
| | | |
MANAGEMENT'S DISCUSSION AND ANALYSIS (MD&A) | |
| Overview | |
| Revenue, Gross Margin, and Operating Expenses | |
| Business Unit Trends and Results | |
| Other Consolidated Results of Operations | |
| Liquidity and Capital Resources | |
| Quantitative and Qualitative Disclosures about Market Risk | |
| | | |
OTHER KEY INFORMATION | |
| Risk Factors | |
| Controls and Procedures | |
| Non-GAAP Financial Measures | |
| Issuer Purchases of Equity Securities | |
| Exhibits | |
| Form 10-Q Cross-Reference Index | |
FORWARD-LOOKING STATEMENTS
This Quarterly Report on Form 10-Q contains forward-looking statements that involve a number of risks and uncertainties. Words such as "anticipates," "expects," "intends," "goals," "plans," "believes," "seeks," "estimates," "continues," "may," "will," "would," "should," "could," and variations of such words and similar expressions are intended to identify such forward-looking statements. In addition, any statements that refer to projections of our future financial performance, our anticipated growth and trends in our businesses, projected growth of markets relevant to our businesses, future products and technology and the expected availability and benefits of such products and technology, expected timing and impact of acquisitions, divestitures, and other significant transactions, expected completion of restructuring activities, uncertain events or assumptions, and other characterizations of future events or circumstances are forward-looking statements. Such statements are based on management's expectations as of the date of this filing and involve many risks and uncertainties that could cause our actual results to differ materially from those expressed or implied in our forward-looking statements. Such risks and uncertainties include those described throughout this report and our Annual Report on Form 10-K for the year ended December 29, 2018, particularly the "Risk Factors" sections of such reports. Given these risks and uncertainties, readers are cautioned not to place undue reliance on such forward-looking statements. Readers are urged to carefully review and consider the various disclosures made in this Form 10-Q and in other documents we file from time to time with the SEC that disclose risks and uncertainties that may affect our business. Unless specifically indicated otherwise, the forward-looking statements in this Form 10-Q do not reflect the potential impact of any divestitures, mergers, acquisitions, or other business combinations that had not been completed as of the date of this filing. In addition, the forward-looking statements in this Form 10-Q are made as of the date of this filing, including expectations based on third-party information and projections that management believes to be reputable, and Intel does not undertake, and expressly disclaims any duty, to update such statements, whether as a result of new information, new developments, or otherwise, except to the extent that disclosure may be required by law.
INTEL UNIQUE TERMS
We use specific terms throughout this document to describe our business and results. Below are key terms and how we define them:
|
| | |
PLATFORM PRODUCTS | | A microprocessor (processor or central processing unit (CPU)) and chipset, a stand-alone System-on-Chip (SoC), or a multichip package, based on Intel® architecture. Platform products, or platforms, are primarily used in solutions sold through the Client Computing Group (CCG), Data Center Group (DCG), and Internet of Things Group (IOTG) segments. |
| | |
ADJACENT PRODUCTS | | All of our non-platform products for CCG, DCG, and IOTG, such as modem, Ethernet and silicon photonics, as well as Mobileye, Non-Volatile Memory Solutions Group (NSG), and Programmable Solutions Group (PSG) products. Combined with our platform products, adjacent products form comprehensive platform solutions to meet customer needs. |
| | |
PC-CENTRIC BUSINESS | | Our CCG business, including both platform and adjacent products. |
| | |
DATA-CENTRIC BUSINESSES | | Our DCG, Internet of Things (IOTG and Mobileye), NSG, PSG, and all other businesses. |
Intel, the Intel logo, Intel Agilex, Intel Core, Intel Optane, Thunderbolt, Xeon, 3D NAND, and 3D XPoint are trademarks of Intel Corporation or its subsidiaries in the U.S. and/or other countries.
* Other names and brands may be claimed as the property of others.
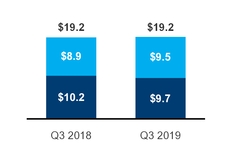
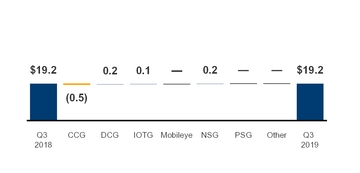
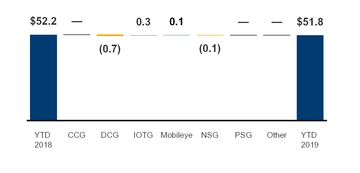
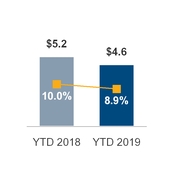
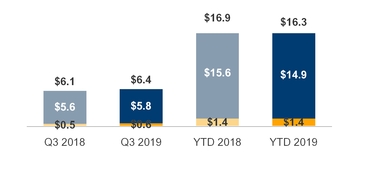
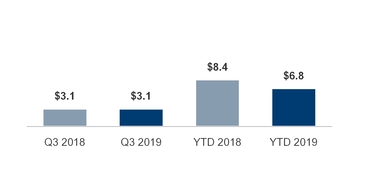
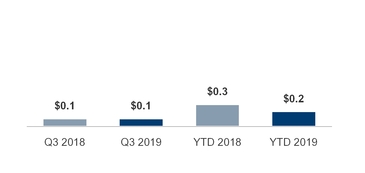
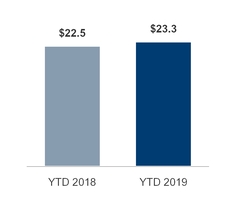
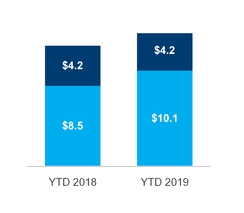
Third quarter revenue was $19.2 billion as our data-centric businesses grew 6% year over year, offset by the PC-centric business decline of 5%. Data-centric revenue was up compared to a year ago, driven by a strong mix of high-performance Intel® Xeon® processors in our DCG business and growth across all businesses. Our PC-centric business was down on lower year over year platform volume, partially offset by a strong mix of higher performance products as the commercial segment of the PC market remained strong. Lower platform unit sales and margin compression on memory products resulted in lower gross margins and operating income, which was partially offset by platform ASP strength and lower investments in modem. In the first nine months we generated $23.3 billion of cash flow from operations and returned $14.3 billion to stockholders, including $4.2 billion in dividends and $10.1 billion in buybacks.
|
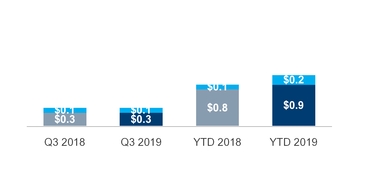
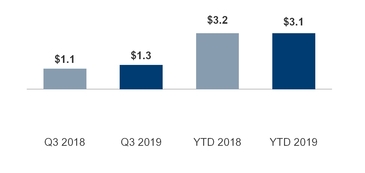
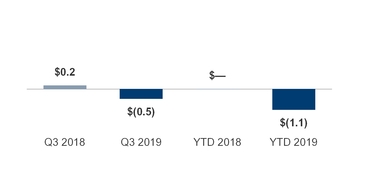
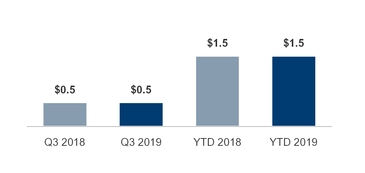
| | | | |
REVENUE | | OPERATING INCOME | | DILUTED EPS |
■ PC-CENTRIC $B ■ DATA-CENTRIC $B | | ■ GAAP $B ■ NON-GAAP $B | | ■ GAAP ■ NON-GAAP |
|
| | | | | | | | | | |
| | | | |
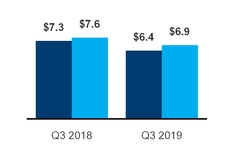
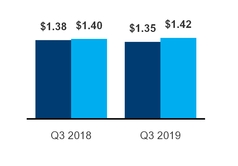
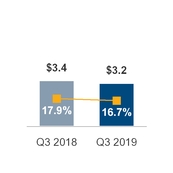
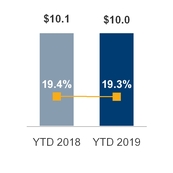
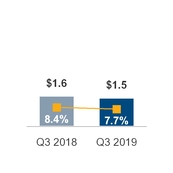
$19.2B | | | | $6.4B | | $6.9B | | $1.35 | | $1.42 |
GAAP | | | | GAAP | | non-GAAP1 | | GAAP | | non-GAAP1 |
flat in comparison to Q3 2018 | | down $902M or 12% from Q3 2018 | | down $714M or 9% from Q3 2018 | | down $0.03 or 2% from Q3 2018 | | up $0.02 or 1% from Q3 2018 |
| | | | | | | | |
Growth in data-centric businesses with record revenue from DCG, NSG, IOTG and Mobileye, offset by decline in PC-centric business | | Lower gross margin from decrease in platform unit sales and lower NAND market pricing, partially offset by platform ASP strength | | Impact from lower platform volume and lower NAND market pricing, partially offset by lower shares outstanding and ASP strength |
BUSINESS SUMMARY
| |
• | We launched the first wave of 10th generation Intel® Core™ processors, with 11 new 10 nanometer (nm)-based Ice Lake processors that integrate artificial intelligence, graphics, Wi-Fi 6 and Thunderbolt™ 3 all on the SoC. We began shipping our 10nm Intel® Agilex® field programmable gate arrays (FPGAs) to early access program customers. |
| |
• | We experienced growth across all data-centric businesses. DCG grew across all segments, with the cloud and enterprise and government market segments returning to growth. NSG grew with NAND and Intel® Optane™ bit growth, partially offset by lower NAND market pricing. Demand for edge compute drove double digit revenue growth for Mobileye and high single digit growth for IOTG. |
| |
• | PC-centric decline was driven by lower product shipments compared to Q3 2018, when internal inventory was drawn on to meet demand, partially offset by adjacencies growth and ASP strength. We continued to be supply constrained in Q3, particularly at the value-end of the market, as higher than expected PC demand strength continues to outpace our supply despite capacity additions we have made this year. |
| |
• | In July, we signed an agreement to divest the majority of our smartphone modem business, including certain employees, intellectual property, equipment and leases. The transaction enables us to increase the focus of our 5G efforts on the broader opportunity to modernize network and edge infrastructure, and is expected to close in the fourth quarter of 2019. |
1 See "Non-GAAP Financial Measures" within Other Key Information.
|
| | |
 A QUARTER IN REVIEW A QUARTER IN REVIEW | | 2 |
|
|
CONSOLIDATED CONDENSED STATEMENTS OF INCOME |
|
| | | | | | | | | | | | | | | | |
| | Three Months Ended | | Nine Months Ended |
(In Millions, Except Per Share Amounts; Unaudited) | | Sep 28,
2019 | | Sep 29,
2018 | | Sep 28,
2019 | | Sep 29,
2018 |
Net revenue | | $ | 19,190 |
| | $ | 19,163 |
| | $ | 51,756 |
| | $ | 52,191 |
|
Cost of sales | | 7,895 |
| | 6,803 |
| | 21,494 |
| | 19,681 |
|
Gross margin | | 11,295 |
| | 12,360 |
| | 30,262 |
| | 32,510 |
|
Research and development | | 3,208 |
| | 3,428 |
| | 9,978 |
| | 10,110 |
|
Marketing, general and administrative | | 1,486 |
| | 1,605 |
| | 4,608 |
| | 5,230 |
|
Restructuring and other charges | | 104 |
| | (72 | ) | | 288 |
| | (72 | ) |
Amortization of acquisition-related intangibles | | 50 |
| | 50 |
| | 150 |
| | 150 |
|
Operating expenses | | 4,848 |
| | 5,011 |
| | 15,024 |
| | 15,418 |
|
Operating income | | 6,447 |
| | 7,349 |
| | 15,238 |
| | 17,092 |
|
Gains (losses) on equity investments, net | | 318 |
| | (75 | ) | | 922 |
| | 365 |
|
Interest and other, net | | (46 | ) | | (132 | ) | | (170 | ) | | 225 |
|
Income before taxes | | 6,719 |
| | 7,142 |
| | 15,990 |
| | 17,682 |
|
Provision for taxes | | 729 |
| | 744 |
| | 1,847 |
| | 1,824 |
|
Net income | | $ | 5,990 |
| | $ | 6,398 |
| | $ | 14,143 |
| | $ | 15,858 |
|
Earnings per share – basic | | $ | 1.36 |
| | $ | 1.40 |
| | $ | 3.18 |
| | $ | 3.42 |
|
Earnings per share – diluted | | $ | 1.35 |
| | $ | 1.38 |
| | $ | 3.14 |
| | $ | 3.35 |
|
Weighted average shares of common stock outstanding: | | | | | | | | |
Basic | | 4,391 |
| | 4,574 |
| | 4,450 |
| | 4,632 |
|
Diluted | | 4,433 |
| | 4,648 |
| | 4,507 |
| | 4,728 |
|
See accompanying notes.
|
| | |
FINANCIAL STATEMENTS | Consolidated Condensed Statements of Income | 3 |
|
|
CONSOLIDATED CONDENSED STATEMENTS OF COMPREHENSIVE INCOME |
|
| | | | | | | | | | | | | | | | |
| | Three Months Ended | | Nine Months Ended |
(In Millions; Unaudited) | | Sep 28,
2019 | | Sep 29,
2018 | | Sep 28,
2019 | | Sep 29,
2018 |
Net income | | $ | 5,990 |
| | $ | 6,398 |
| | $ | 14,143 |
| | $ | 15,858 |
|
Changes in other comprehensive income, net of tax: | | | | | | | | |
Net unrealized holding gains (losses) on derivatives | | (115 | ) | | (25 | ) | | 138 |
| | (199 | ) |
Actuarial valuation and other pension benefits (expenses), net | | 9 |
| | 13 |
| | 26 |
| | 39 |
|
Translation adjustments and other | | 6 |
| | (2 | ) | | 88 |
| | (15 | ) |
Other comprehensive income (loss) | | (100 | ) | | (14 | ) | | 252 |
| | (175 | ) |
Total comprehensive income | | $ | 5,890 |
| | $ | 6,384 |
| | $ | 14,395 |
| | $ | 15,683 |
|
See accompanying notes.
|
| | |
FINANCIAL STATEMENTS | Consolidated Condensed Statements of Comprehensive Income | 4 |
|
|
CONSOLIDATED CONDENSED BALANCE SHEETS |
|
| | | | | | | | |
(In Millions) | | Sep 28,
2019 | | Dec 29,
2018 |
| | (unaudited) | | |
Assets | | | | |
Current assets: | | | | |
Cash and cash equivalents | | $ | 3,935 |
| | $ | 3,019 |
|
Short-term investments | | 1,849 |
| | 2,788 |
|
Trading assets | | 6,241 |
| | 5,843 |
|
Accounts receivable | | 6,880 |
| | 6,722 |
|
Inventories | | 8,638 |
| | 7,253 |
|
Other current assets | | 2,414 |
| | 3,162 |
|
Total current assets | | 29,957 |
| | 28,787 |
|
Property, plant and equipment, net of accumulated depreciation of $71,183 ($65,342 as of December 29, 2018) | | 53,563 |
| | 48,976 |
|
Equity investments | | 4,819 |
| | 6,042 |
|
Other long-term investments | | 3,428 |
| | 3,388 |
|
Goodwill | | 24,727 |
| | 24,513 |
|
Identified intangible assets, net | | 11,019 |
| | 11,836 |
|
Other long-term assets | | 6,255 |
| | 4,421 |
|
Total assets | | $ | 133,768 |
| | $ | 127,963 |
|
| | | | |
Liabilities, temporary equity, and stockholders’ equity | | | | |
Current liabilities: | | | | |
Short-term debt | | $ | 5,200 |
| | $ | 1,261 |
|
Accounts payable | | 4,809 |
| | 3,824 |
|
Accrued compensation and benefits | | 3,220 |
| | 3,622 |
|
Other accrued liabilities | | 11,835 |
| | 7,919 |
|
Total current liabilities |
| 25,064 |
| | 16,626 |
|
Debt | | 23,707 |
| | 25,098 |
|
Contract liabilities | | 1,413 |
| | 2,049 |
|
Income taxes payable, non-current | | 4,974 |
| | 4,897 |
|
Deferred income taxes | | 1,696 |
| | 1,665 |
|
Other long-term liabilities | | 2,506 |
| | 2,646 |
|
Contingencies (Note 12) | |
| |
|
Temporary equity | | 166 |
| | 419 |
|
Stockholders’ equity: | | | | |
Preferred stock | | — |
| | — |
|
Common stock and capital in excess of par value, 4,350 issued and outstanding (4,516 issued and outstanding as of December 29, 2018) | | 25,290 |
| | 25,365 |
|
Accumulated other comprehensive income (loss) | | (722 | ) | | (974 | ) |
Retained earnings | | 49,674 |
| | 50,172 |
|
Total stockholders’ equity | | 74,242 |
| | 74,563 |
|
Total liabilities, temporary equity, and stockholders’ equity | | $ | 133,768 |
| | $ | 127,963 |
|
See accompanying notes.
|
| | |
FINANCIAL STATEMENTS | Consolidated Condensed Balance Sheets | 5 |
|
|
CONSOLIDATED CONDENSED STATEMENTS OF CASH FLOWS |
|
| | | | | | | | |
| | Nine Months Ended |
(In Millions; Unaudited) | | Sep 28,
2019 | | Sep 29,
2018 |
| | | | |
Cash and cash equivalents, beginning of period | | $ | 3,019 |
| | $ | 3,433 |
|
Cash flows provided by (used for) operating activities: | | | | |
Net income | | 14,143 |
| | 15,858 |
|
Adjustments to reconcile net income to net cash provided by operating activities: | | | | |
Depreciation | | 6,647 |
| | 5,420 |
|
Share-based compensation | | 1,290 |
| | 1,203 |
|
Amortization of intangibles | | 1,211 |
| | 1,172 |
|
(Gains) losses on equity investments, net | | (395 | ) | | (329 | ) |
Changes in assets and liabilities: | | | | |
Accounts receivable | | (156 | ) | | (449 | ) |
Inventories | | (1,376 | ) | | (362 | ) |
Accounts payable | | 728 |
| | 430 |
|
Accrued compensation and benefits | | (365 | ) | | (801 | ) |
Customer deposits and prepaid supply agreements | | (674 | ) | | 1,472 |
|
Income taxes | | 435 |
| | (1,057 | ) |
Other assets and liabilities | | 1,769 |
| | (25 | ) |
Total adjustments | | 9,114 |
| | 6,674 |
|
Net cash provided by operating activities | | 23,257 |
| | 22,532 |
|
Cash flows provided by (used for) investing activities: | | | | |
Additions to property, plant and equipment | | (11,547 | ) | | (11,291 | ) |
Purchases of available-for-sale debt investments | | (2,028 | ) | | (3,090 | ) |
Sales of available-for-sale debt investments | | 1,198 |
| | 135 |
|
Maturities of available-for-sale debt investments | | 1,920 |
| | 2,232 |
|
Purchases of trading assets | | (5,769 | ) | | (8,316 | ) |
Maturities and sales of trading assets | | 5,467 |
| | 9,705 |
|
Sales of equity investments | | 1,414 |
| | 1,646 |
|
Other investing | | (575 | ) | | (440 | ) |
Net cash used for investing activities | | (9,920 | ) | | (9,419 | ) |
Cash flows provided by (used for) financing activities: | | | | |
Increase (decrease) in short-term debt, net | | 835 |
| | 1,707 |
|
Issuance of long-term debt, net of issuance costs | | 650 |
| | 423 |
|
Repayment of debt and debt conversion | | (1,478 | ) | | (1,928 | ) |
Proceeds from sales of common stock through employee equity incentive plans | | 797 |
| | 545 |
|
Repurchase of common stock | | (10,100 | ) | | (8,464 | ) |
Payment of dividends to stockholders | | (4,214 | ) | | (4,173 | ) |
Other financing | | 1,089 |
| | (1,249 | ) |
Net cash provided by (used for) financing activities | | (12,421 | ) | | (13,139 | ) |
Net increase (decrease) in cash and cash equivalents | | 916 |
| | (26 | ) |
Cash and cash equivalents, end of period | | $ | 3,935 |
| | $ | 3,407 |
|
| | | | |
Supplemental disclosures of noncash investing activities and cash flow information: | | | | |
Acquisition of property, plant, and equipment included in accounts payable and accrued liabilities | | $ | 2,376 |
| | $ | 1,988 |
|
Cash paid during the period for: | | | | |
Interest, net of capitalized interest | | $ | 312 |
| | $ | 316 |
|
Income taxes, net of refunds | | $ | 1,334 |
| | $ | 2,854 |
|
See accompanying notes.
|
| | |
FINANCIAL STATEMENTS | Consolidated Condensed Statements of Cash Flows | 6 |
|
|
CONSOLIDATED CONDENSED STATEMENTS OF STOCKHOLDERS' EQUITY |
|
| | | | | | | | | | | | | | | | | | | |
| | Common Stock and Capital in Excess of Par Value | | Accumulated Other Comprehensive Income (Loss) | | Retained Earnings | | Total |
(In Millions, Except Per Share Amounts) | | Shares | | Amount | | | |
Three Months Ended | | | | | | | | | | |
| | | | | | | | | | |
Balance as of June 29, 2019 | | 4,430 |
| | $ | 25,140 |
| | $ | (622 | ) | | $ | 50,429 |
| | $ | 74,947 |
|
Net income | | — |
| | — |
| | — |
| | 5,990 |
| | 5,990 |
|
Other comprehensive income (loss) | | — |
| | — |
| | (100 | ) | | — |
| | (100 | ) |
Employee equity incentive plans and other | | 13 |
| | 466 |
| | — |
| | — |
| | 466 |
|
Share-based compensation | | — |
| | 427 |
| | — |
| | — |
| | 427 |
|
Temporary equity reduction | | — |
| | 80 |
| | — |
| | — |
| | 80 |
|
Convertible debt | | — |
| | (278 | ) | | — |
| | — |
| | (278 | ) |
Repurchase of common stock | | (92 | ) | | (523 | ) | | — |
| | (3,966 | ) | | (4,489 | ) |
Restricted stock unit withholdings | | (1 | ) | | (22 | ) | | — |
| | (6 | ) | | (28 | ) |
Cash dividends declared ($0.63 per share) | | — |
| | — |
| | — |
| | (2,773 | ) | | (2,773 | ) |
Balance as of September 28, 2019 | | 4,350 |
| | $ | 25,290 |
| | $ | (722 | ) | | $ | 49,674 |
| | $ | 74,242 |
|
| | | | | | | | | | |
Balance as of June 30, 2018 | | 4,607 |
| | $ | 25,470 |
| | $ | (1,089 | ) | | $ | 45,666 |
| | $ | 70,047 |
|
Net income | | — |
| | — |
| | — |
| | 6,398 |
| | 6,398 |
|
Other comprehensive income (loss) | | — |
| | — |
| | (14 | ) | | — |
| | (14 | ) |
Employee equity incentive plans and other | | 8 |
| | 300 |
| | — |
| | — |
| | 300 |
|
Share-based compensation | | — |
| | 377 |
| | — |
| | — |
| | 377 |
|
Temporary equity reduction | | — |
| | 139 |
| | — |
| | — |
| | 139 |
|
Convertible debt | | — |
| | (497 | ) | | — |
| | — |
| | (497 | ) |
Repurchase of common stock | | (50 | ) | | (275 | ) | | — |
| | (2,219 | ) | | (2,494 | ) |
Restricted stock unit withholdings | | (1 | ) | | (22 | ) | | — |
| | (6 | ) | | (28 | ) |
Cash dividends declared ($0.60 per share) | | — |
| | — |
| | — |
| | (2,745 | ) | | (2,745 | ) |
Balance as of September 29, 2018 | | 4,564 |
| | $ | 25,492 |
| | $ | (1,103 | ) | | $ | 47,094 |
| | $ | 71,483 |
|
| | | | | | | | | | |
Nine Months Ended | | | | | | | | | | |
| | | | | | | | | | |
Balance as of December 29, 2018 | | 4,516 |
| | $ | 25,365 |
| | $ | (974 | ) | | $ | 50,172 |
| | $ | 74,563 |
|
Net income | | — |
| | — |
| | — |
| | 14,143 |
| | 14,143 |
|
Other comprehensive income (loss) | | — |
| | — |
| | 252 |
| | — |
| | 252 |
|
Employee equity incentive plans and other | | 52 |
| | 869 |
| | — |
| | — |
| | 869 |
|
Share-based compensation | | — |
| | 1,287 |
| | — |
| | — |
| | 1,287 |
|
Temporary equity reduction | | — |
| | 253 |
| | — |
| | — |
| | 253 |
|
Convertible debt | | — |
| | (990 | ) | | — |
| | — |
| | (990 | ) |
Repurchase of common stock | | (209 | ) | | (1,182 | ) | | — |
| | (8,902 | ) | | (10,084 | ) |
Restricted stock unit withholdings | | (9 | ) | | (312 | ) | | — |
| | (137 | ) | | (449 | ) |
Cash dividends declared ($1.26 per share) | | — |
| | — |
| | — |
| | (5,602 | ) | | (5,602 | ) |
Balance as of September 28, 2019 | | 4,350 |
| | $ | 25,290 |
| | $ | (722 | ) | | $ | 49,674 |
| | $ | 74,242 |
|
| | | | | | | | | | |
Balance as of December 30, 2017 | | 4,687 |
| | $ | 26,074 |
| | $ | 862 |
| | $ | 42,083 |
| | $ | 69,019 |
|
Adjustment for change in accounting principle | | — |
| | — |
| | (1,790 | ) | | 2,424 |
| | 634 |
|
Opening balance as of December 31, 2017 | | 4,687 |
| | 26,074 |
| | (928 | ) | | 44,507 |
| | 69,653 |
|
Net income | | — |
| | — |
| | — |
| | 15,858 |
| | 15,858 |
|
Other comprehensive income (loss) | | — |
| | — |
| | (175 | ) | | — |
| | (175 | ) |
Employee equity incentive plans and other¹ | | 54 |
| | 358 |
| | — |
| | — |
| | 358 |
|
Share-based compensation | | — |
| | 1,202 |
| | — |
| | — |
| | 1,202 |
|
Temporary equity reduction | | — |
| | 351 |
| | — |
| | — |
| | 351 |
|
Convertible debt | | — |
| | (1,267 | ) | | — |
| | — |
| | (1,267 | ) |
Repurchase of common stock | | (167 | ) | | (924 | ) | | — |
| | (7,538 | ) | | (8,462 | ) |
Restricted stock unit withholdings | | (10 | ) | | (302 | ) | | — |
| | (187 | ) | | (489 | ) |
Cash dividends declared ($1.20 per share) | | — |
| | — |
| | — |
| | (5,546 | ) | | (5,546 | ) |
Balance as of September 29, 2018 | | 4,564 |
| | $ | 25,492 |
| | $ | (1,103 | ) | | $ | 47,094 |
| | $ | 71,483 |
|
| |
1 | Includes approximately $375 million of non-controlling interest activity due to our acquisition of Mobileye in 2017, which was eliminated in 2018 due to the purchase of remaining shares. |
See accompanying notes.
|
| | |
FINANCIAL STATEMENTS | Consolidated Condensed Statements of Stockholders' Equity | 7 |
|
|
NOTES TO CONSOLIDATED CONDENSED FINANCIAL STATEMENTS |
|
| |
NOTE 1 : | BASIS OF PRESENTATION |
We prepared our interim consolidated condensed financial statements that accompany these notes in conformity with GAAP, consistent in all material respects with those applied in our Annual Report on Form 10-K for the fiscal year ended December 29, 2018 (2018 Form 10-K), except for changes associated with leases as detailed in "Note 2: Recent Accounting Standards and Accounting Policies." We have reclassified certain prior period amounts to conform to current period presentation.
We have made estimates and judgments affecting the amounts reported in our consolidated condensed financial statements and the accompanying notes. The actual results that we experience may differ materially from our estimates. The interim financial information is unaudited, and reflects all normal adjustments that are, in our opinion, necessary to provide a fair statement of results for the interim periods presented. This report should be read in conjunction with the consolidated financial statements in our 2018 Form 10-K.
|
| |
NOTE 2 : | RECENT ACCOUNTING STANDARDS AND ACCOUNTING POLICIES |
We assess the adoption impacts of recently issued accounting standards by the Financial Accounting Standards Board on our financial statements and below describe impacts from newly adopted standards, as well as material updates to our previous assessments, if any, from our 2018 Form 10-K.
ACCOUNTING STANDARDS ADOPTED
Leases
Standard/Description: This new lease accounting standard requires that we recognize leased assets and corresponding liabilities on the balance sheet and provide enhanced disclosure of lease activity.
Effective Date and Adoption Considerations: Effective in the first quarter of 2019. The standard was adopted applying the modified retrospective approach at the beginning of the period of adoption. Our leased assets and corresponding liabilities exclude non-lease components.
Effect on Financial Statements or Other Significant Matters: Within the opening balances for the fiscal year beginning December 30, 2018, we recognized leased assets and corresponding liabilities in other long-term assets of $706 million, which includes $81 million of previously recognized prepaid land use rights, as well as corresponding accrued liabilities of $180 million and other long-term liabilities of $445 million.
Accounting Policy Updates and Disclosures: We determine if an arrangement is a lease at inception and classify it as finance or operating. Leased assets and corresponding liabilities are recognized based on the present value of the lease payments over the lease term. Our lease terms may include options to extend when it is reasonably certain that we will exercise that option. We have lease agreements with lease and non-lease components, and the non-lease components are accounted for separately and not included in our leased assets and corresponding liabilities. Leases primarily consist of real property, and, to a lesser extent, certain machinery and equipment.
We recognized leased assets in other long-term assets of $652 million and corresponding accrued liabilities of $174 million, and other long-term liabilities of $399 million as of September 28, 2019. Our leases have remaining lease terms of 1 to 9 years, some of which may include options to extend the leases for up to 39 years. The weighted average remaining lease term was 4.8 years, and the weighted average discount rate was 3.4% as of September 28, 2019.
For the nine months ended September 28, 2019, lease expense was $141 million. In accordance with the new leases standard, discounted and undiscounted lease payments under non-cancelable leases as of September 28, 2019, excluding non-lease components, are as follows: |
| | | | | | | | | | | | | | | | | | | | | | | | | | | | |
(In Millions) | | Remainder of 2019 | | 2020 | | 2021 | | 2022 | | 2023 | | 2024 and Thereafter | | Total |
Lease payments | | $ | 44 |
| | $ | 178 |
| | $ | 125 |
| | $ | 96 |
| | $ | 71 |
| | $ | 108 |
| | $ | 622 |
|
Present value of lease payments | | | | | | | | | | | | | | $ | 573 |
|
|
| | |
FINANCIAL STATEMENTS | Notes to Financial Statements | 8 |
Lease expense was $231 million in 2018 ($264 million in 2017). Prior to our adoption of the new leases standard, future minimum lease payments as of December 29, 2018, which were undiscounted and included lease and non-lease components, were as follows: |
| | | | | | | | | | | | | | | | | | | | | | | | | | | | |
(In Millions) | | 2019 | | 2020 | | 2021 | | 2022 | | 2023 | | 2024 and Thereafter | | Total |
Minimum rental commitments under all non-cancelable leases | | $ | 229 |
| | $ | 181 |
| | $ | 133 |
| | $ | 101 |
| | $ | 70 |
| | $ | 121 |
| | $ | 835 |
|
|
| |
NOTE 3 : | OPERATING SEGMENTS |
We manage our business through the following operating segments:
| |
• | Client Computing Group (CCG) |
| |
• | Internet of Things Group (IOTG) |
| |
• | Non-Volatile Memory Solutions Group (NSG) |
| |
• | Programmable Solutions Group (PSG) |
We offer platform products that incorporate various components and technologies, including a microprocessor and chipset, a stand-alone SoC, or a multichip package. A platform product may be enhanced by additional hardware, software, and services offered by Intel. Platform products are used in various form factors across our CCG, DCG, and IOTG operating segments. We derive a substantial majority of our revenue from platform products, which are our principal products and considered as one class of product.
CCG and DCG are our reportable operating segments. IOTG, Mobileye, NSG, and PSG do not meet the quantitative thresholds to qualify as reportable operating segments; however, we have elected to disclose the results of these non-reportable operating segments. Our Internet of Things portfolio, presented as Internet of Things, is comprised of IOTG and Mobileye operating segments.
The “all other” category includes revenue, expenses, and charges such as:
| |
• | results of operations from non-reportable segments not otherwise presented; |
| |
• | historical results of operations from divested businesses; |
| |
• | results of operations of start-up businesses that support our initiatives, including our foundry business; |
| |
• | amounts included within restructuring and other charges; |
| |
• | a portion of employee benefits, compensation, and other expenses not allocated to the operating segments; and |
| |
• | acquisition-related costs, including amortization and any impairment of acquisition-related intangibles and goodwill. |
The Chief Operating Decision Maker (CODM), which is our Chief Executive Officer (CEO), does not evaluate operating segments using discrete asset information. Operating segments do not record inter-segment revenue. We do not allocate gains and losses from equity investments, interest and other income, or taxes to operating segments. Although the CODM uses operating income to evaluate the segments, operating costs included in one segment may benefit other segments. Except for these differences, the accounting policies for segment reporting are the same as for Intel as a whole.
|
| | |
FINANCIAL STATEMENTS | Notes to Financial Statements | 9 |
Net revenue and operating income (loss) for each period were as follows:
|
| | | | | | | | | | | | | | | | |
| | Three Months Ended | | Nine Months Ended |
(In Millions) | | Sep 28,
2019 | | Sep 29,
2018 | | Sep 28,
2019 | | Sep 29,
2018 |
Net revenue: | | | | | | | | |
Client Computing Group | | | | | | | | |
Platform | | $ | 8,379 |
| | $ | 9,023 |
| | $ | 24,128 |
| | $ | 24,703 |
|
Adjacent | | 1,330 |
| | 1,211 |
| | 3,008 |
| | 2,479 |
|
| | 9,709 |
| | 10,234 |
| | 27,136 |
| | 27,182 |
|
Data Center Group | | | | | | | | |
Platform | | 5,819 |
| | 5,637 |
| | 14,854 |
| | 15,561 |
|
Adjacent | | 564 |
| | 502 |
| | 1,414 |
| | 1,361 |
|
| | 6,383 |
| | 6,139 |
| | 16,268 |
| | 16,922 |
|
Internet of Things | | | | | | | | |
IOTG | | 1,005 |
| | 919 |
| | 2,901 |
| | 2,639 |
|
Mobileye | | 229 |
| | 191 |
| | 639 |
| | 515 |
|
| | 1,234 |
| | 1,110 |
| | 3,540 |
| | 3,154 |
|
| | | | | | | | |
Non-Volatile Memory Solutions Group | | 1,290 |
| | 1,081 |
| | 3,145 |
| | 3,200 |
|
Programmable Solutions Group | | 507 |
| | 496 |
| | 1,482 |
| | 1,511 |
|
All other | | 67 |
| | 103 |
| | 185 |
| | 222 |
|
Total net revenue | | $ | 19,190 |
| | $ | 19,163 |
| | $ | 51,756 |
| | $ | 52,191 |
|
| | | | | | | | |
Operating income (loss): | | | | | | | | |
Client Computing Group | | $ | 4,305 |
| | $ | 4,532 |
| | $ | 11,114 |
| | $ | 10,557 |
|
Data Center Group | | 3,115 |
| | 3,082 |
| | 6,756 |
| | 8,421 |
|
| | | | | | | | |
Internet of Things | | | | | | | | |
IOTG | | 309 |
| | 321 |
| | 854 |
| | 791 |
|
Mobileye | | 67 |
| | 52 |
| | 188 |
| | 106 |
|
| | 376 |
| | 373 |
| | 1,042 |
| | 897 |
|
| | | | | | | | |
Non-Volatile Memory Solutions Group | | (499 | ) | | 160 |
| | (1,080 | ) | | 14 |
|
Programmable Solutions Group | | 92 |
| | 106 |
| | 233 |
| | 304 |
|
All other | | (942 | ) | | (904 | ) | | (2,827 | ) | | (3,101 | ) |
Total operating income | | $ | 6,447 |
| | $ | 7,349 |
| | $ | 15,238 |
| | $ | 17,092 |
|
|
| | |
FINANCIAL STATEMENTS | Notes to Financial Statements | 10 |
Disaggregated net revenue for each period was as follows:
|
| | | | | | | | | | | | | | | | |
| | Three Months Ended | | Nine Months Ended |
(In Millions) | | Sep 28,
2019 | | Sep 29,
2018 | | Sep 28,
2019 | | Sep 29,
2018 |
Platform revenue | | | | | | | | |
Desktop platform | | $ | 2,968 |
| | $ | 3,225 |
| | $ | 8,621 |
| | $ | 9,087 |
|
Notebook platform | | 5,393 |
| | 5,774 |
| | 15,456 |
| | 15,549 |
|
DCG platform | | 5,819 |
| | 5,637 |
| | 14,854 |
| | 15,561 |
|
IOTG platform | | 923 |
| | 855 |
| | 2,639 |
| | 2,319 |
|
Other platform1 | | 18 |
| | 24 |
| | 51 |
| | 67 |
|
| | 15,121 |
| | 15,515 |
| | 41,621 |
| | 42,583 |
|
| | | | | | | | |
Adjacent revenue2 | | 4,069 |
| | 3,648 |
| | 10,135 |
| | 9,608 |
|
Total revenue | | $ | 19,190 |
| | $ | 19,163 |
| | $ | 51,756 |
| | $ | 52,191 |
|
| |
1 | Includes our tablet and service provider revenue. |
| |
2 | Includes all of our non-platform products for CCG, DCG, and IOTG such as modem, Ethernet, and silicon photonics, as well as Mobileye, NSG, and PSG products. |
Planned divestiture of smartphone modem business
On July 25, 2019, we signed a definitive agreement to sell the majority of our smartphone modem business. We will continue to meet current customer commitments for our existing 4G smartphone modem product line. We expect to close the transaction, which will include certain employees, intellectual property, equipment and leases, in the fourth quarter of 2019. $235 million net assets of the modem business are classified as held for sale. We expect to record a gain on divestiture of approximately $500 million, net of tax.
|
| |
NOTE 4 : | EARNINGS PER SHARE |
We computed basic earnings per share of common stock based on the weighted average number of shares of common stock outstanding during the period. We computed diluted earnings per share of common stock based on the weighted average number of shares of common stock outstanding plus potentially dilutive shares of common stock outstanding during the period. |
| | | | | | | | | | | | | | | | |
| | Three Months Ended | | Nine Months Ended |
(In Millions, Except Per Share Amounts) | | Sep 28,
2019 | | Sep 29,
2018 | | Sep 28,
2019 | | Sep 29,
2018 |
Net income available to common stockholders | | $ | 5,990 |
| | $ | 6,398 |
| | $ | 14,143 |
| | $ | 15,858 |
|
Weighted average shares of common stock outstanding – basic | | 4,391 |
| | 4,574 |
| | 4,450 |
| | 4,632 |
|
Dilutive effect of employee equity incentive plans | | 30 |
| | 40 |
| | 41 |
| | 52 |
|
Dilutive effect of convertible debt | | 12 |
| | 34 |
| | 16 |
| | 44 |
|
Weighted average shares of common stock outstanding – diluted | | 4,433 |
| | 4,648 |
| | 4,507 |
| | 4,728 |
|
Earnings per share – basic | | $ | 1.36 |
| | $ | 1.40 |
| | $ | 3.18 |
| | $ | 3.42 |
|
Earnings per share – diluted | | $ | 1.35 |
| | $ | 1.38 |
| | $ | 3.14 |
| | $ | 3.35 |
|
Potentially dilutive shares of common stock from employee equity incentive plans are determined by applying the treasury stock method to the assumed exercise of outstanding stock options, the assumed vesting of outstanding restricted stock units (RSUs), and the assumed issuance of common stock under the stock purchase plan. Our 3.25% junior subordinated convertible debentures due 2039 (2009 debentures) require settlement of the principal amount of the debt in cash upon conversion. Since the conversion premium is paid in cash or stock at our option, we determined the potentially dilutive shares of common stock by applying the treasury stock method. We included our 2009 debentures in the calculation of diluted earnings per share of common stock in all periods presented because the average market price was above the conversion price.
Securities which would have been anti-dilutive are insignificant and are excluded from the computation of diluted earnings per share in all periods presented.
|
| | |
FINANCIAL STATEMENTS | Notes to Financial Statements | 11 |
|
| |
NOTE 5 : | CONTRACT LIABILITIES |
|
| | | | | | | | |
(In Millions) | | Sep 28,
2019 | | Dec 29,
2018 |
Prepaid supply agreements
| | $ | 1,913 |
| | $ | 2,587 |
|
Other | | 180 |
| | 122 |
|
Total contract liabilities | | $ | 2,093 |
| | $ | 2,709 |
|
Contract liabilities are primarily related to partial prepayments received from customers on long-term supply agreements towards future NSG product delivery. The timing and amount of future anticipated revenues may vary from our expectations due to changes in supply, demand, and market pricing.
As new prepaid supply agreements are entered into and performance obligations are negotiated, this component of the contract liability balance will increase, and as customers purchase product and utilize their prepaid balances, the balance will decrease. The short-term portion of prepayments from supply agreements is reported on the consolidated condensed balance sheets within other accrued liabilities.
The following table shows the changes in contract liability balances relating to prepaid supply agreements during the first nine months of 2019:
|
| | | | |
(In Millions) | | |
Prepaid supply agreements balance as of December 29, 2018 | | $ | 2,587 |
|
Prepaids utilized | | (674 | ) |
Prepaid supply agreements balance as of September 28, 2019 | | $ | 1,913 |
|
|
| |
NOTE 6 : | OTHER FINANCIAL STATEMENT DETAILS |
INVENTORIES
|
| | | | | | | | |
(In Millions) | | Sep 28,
2019 | | Dec 29,
2018 |
Raw materials | | $ | 803 |
| | $ | 813 |
|
Work in process | | 5,945 |
| | 4,511 |
|
Finished goods | | 1,890 |
| | 1,929 |
|
Total inventories | | $ | 8,638 |
| | $ | 7,253 |
|
INTEREST AND OTHER, NET
The components of interest and other, net for each period were as follows: |
| | | | | | | | | | | | | | | | |
| | Three Months Ended | | Nine Months Ended |
(In Millions) | | Sep 28,
2019 | | Sep 29,
2018 | | Sep 28,
2019 | | Sep 29,
2018 |
Interest income | | $ | 114 |
| | $ | 109 |
| | $ | 374 |
| | $ | 308 |
|
Interest expense | | (107 | ) | | (109 | ) | | (381 | ) | | (337 | ) |
Other, net | | (53 | ) | | (132 | ) | | (163 | ) | | 254 |
|
Total interest and other, net | | $ | (46 | ) | | $ | (132 | ) | | $ | (170 | ) | | $ | 225 |
|
Interest expense in the preceding table is net of $122 million of interest capitalized in the third quarter of 2019 and $366 million in the first nine months of 2019 ($142 million in the third quarter of 2018 and $381 million in the first nine months of 2018).
In the second quarter of 2018, we completed the divestiture of Wind River, and recognized a pre-tax gain of $494 million.
|
| | |
FINANCIAL STATEMENTS | Notes to Financial Statements | 12 |
|
| |
NOTE 7 : | RESTRUCTURING AND OTHER CHARGES |
A restructuring program was approved in the second quarter of 2019 to align our workforce with the planned exit of the smartphone modem business. We expect these actions to be substantially complete in the second quarter of 2020.
Restructuring and other charges by type for the 2019 Restructuring Program for each period were as follows:
|
| | | | | | | | |
| | Three Months Ended | | Nine Months Ended |
(In Millions) | | Sep 28,
2019 | | Sep 28,
2019 |
Employee severance and benefit arrangements | | $ | 40 |
| | $ | 208 |
|
Asset impairment and other charges | | 64 |
| | 80 |
|
Total restructuring and other charges | | $ | 104 |
| | $ | 288 |
|
DEBT INVESTMENTS
Trading Assets
Net losses related to trading assets still held at the reporting date were $75 million in the third quarter of 2019 and net gains were $21 million in the first nine months of 2019 ($4 million of net losses in the third quarter of 2018 and $169 million of net losses in the first nine months of 2018). Net gains on the related derivatives were $81 million in the third quarter of 2019 and net losses were $7 million in the first nine months of 2019 (net losses of $11 million in the third quarter of 2018 and net gains of $159 million in the first nine months of 2018).
Available-for-Sale Debt Investments |
| | | | | | | | | | | | | | | | | | | | | | | | | | | | | | | | |
| | September 28, 2019 | | December 29, 2018 |
(In Millions) | | Adjusted Cost | | Gross Unrealized Gains | | Gross Unrealized Losses | | Fair Value | | Adjusted Cost | | Gross Unrealized Gains | | Gross Unrealized Losses | | Fair Value |
Corporate debt | | $ | 3,012 |
| | $ | 46 |
| | $ | (1 | ) | | $ | 3,057 |
| | $ | 3,068 |
| | $ | 2 |
| | $ | (28 | ) | | $ | 3,042 |
|
Financial institution
instruments | | $ | 3,347 |
| | $ | 16 |
| | $ | (1 | ) | | $ | 3,362 |
| | $ | 3,076 |
| | $ | 3 |
| | $ | (11 | ) | | $ | 3,068 |
|
Government debt | | $ | 743 |
| | $ | 5 |
| | $ | — |
| | $ | 748 |
| | $ | 1,069 |
| | $ | 1 |
| | $ | (9 | ) | | $ | 1,061 |
|
Total available-for-sale debt investments | | $ | 7,102 |
| | $ | 67 |
| | $ | (2 | ) | | $ | 7,167 |
| | $ | 7,213 |
| | $ | 6 |
| | $ | (48 | ) | | $ | 7,171 |
|
Government debt includes instruments such as non-U.S. government bonds and U.S. agency securities. Financial institution instruments include instruments issued or managed by financial institutions in various forms such as commercial paper, fixed and floating rate bonds, money market fund deposits, and time deposits. Substantially all time deposits were issued by institutions outside the U.S. as of September 28, 2019 and December 29, 2018.
The fair value of available-for-sale debt investments, by contractual maturity, as of September 28, 2019, was as follows: |
| | | | |
(In Millions) | | Fair Value |
Due in 1 year or less | | $ | 2,638 |
|
Due in 1–2 years | | 794 |
|
Due in 2–5 years | | 2,509 |
|
Due after 5 years | | 125 |
|
Instruments not due at a single maturity date | | 1,101 |
|
Total | | $ | 7,167 |
|
|
| | |
FINANCIAL STATEMENTS | Notes to Financial Statements | 13 |
EQUITY INVESTMENTS
|
| | | | | | | | |
(In Millions) | | Sep 28,
2019 | | Dec 29,
2018 |
Marketable equity securities | | $ | 352 |
| | $ | 1,440 |
|
Non-marketable equity securities | | 3,287 |
| | 2,978 |
|
Equity method investments | | 1,180 |
| | 1,624 |
|
Total | | $ | 4,819 |
|
| $ | 6,042 |
|
The components of gains (losses) on equity investments, net for each period were as follows: |
| | | | | | | | | | | | | | | | |
| | Three Months Ended | | Nine Months Ended |
(In Millions) | | Sep 28,
2019 | | Sep 29,
2018 | | Sep 28,
2019 | | Sep 29,
2018 |
Ongoing mark-to-market adjustments on marketable equity securities | | $ | 114 |
| | $ | 8 |
| | $ | 188 |
| | $ | 379 |
|
Observable price adjustments on non-marketable equity securities | | 84 |
| | 43 |
| | 100 |
| | 191 |
|
Impairments | | (17 | ) | | (328 | ) | | (79 | ) | | (372 | ) |
Sale of equity investments and other¹ | | 137 |
| | 202 |
| | 713 |
| | 167 |
|
Total gains (losses) on equity investments, net | | $ | 318 |
| | $ | (75 | ) | | $ | 922 |
| | $ | 365 |
|
1 Sale of equity investments and other includes realized gains (losses) on sales of non-marketable equity investments, our share of equity method investee gains (losses) and distributions, and initial fair value adjustments recorded upon a security becoming marketable.
Gains and losses for our marketable and non-marketable equity securities during the period were as follows: |
| | | | | | | | | | | | | | | | |
| | Three Months Ended | | Nine Months Ended |
(In Millions) | | Sep 28,
2019 | | Sep 29,
2018 | | Sep 28,
2019 | | Sep 29,
2018 |
Net gains (losses) recognized during the period on equity securities | | $ | 281 |
| | $ | 215 |
| | $ | 366 |
| | $ | 808 |
|
Less: Net (gains) losses recognized during the period on equity securities sold during the period | | (54 | ) | | (225 | ) | | (321 | ) | | (463 | ) |
Unrealized gains (losses) recognized during the reporting period on equity securities still held at the reporting date | | $ | 227 |
| | $ | (10 | ) | | $ | 45 |
| | $ | 345 |
|
IM Flash Technologies, LLC
IM Flash Technologies, LLC (IMFT) was formed in 2006 by Micron Technology, Inc. (Micron) and Intel to jointly develop NAND flash memory and 3D XPoint™ technology products. IMFT is an unconsolidated variable interest entity and all costs of IMFT are passed on to Micron and Intel through sale of products or services in proportional share of ownership. As of September 28, 2019, we own a 49% interest in IMFT. Our portion of IMFT costs was approximately $140 million in the third quarter of 2019 and approximately $496 million in the first nine months of 2019 (approximately $97 million in the third quarter of 2018 and $324 million in the first nine months of 2018).
IMFT depends on Micron and Intel for any additional cash needs to be provided in the form of cash calls or member debt financing (MDF). Extensions of MDF may be converted to a capital contribution at the lender's request, or may be repaid upon availability of funds. During the first nine months of 2019, IMFT repaid $432 million of MDF to Intel. The carrying balance of our equity method investment in IMFT as of September 28, 2019 is $1.1 billion.
In January 2019, Micron exercised its right to call our interest in IMFT. The sale of our non-controlling interest in IMFT to Micron is expected to close on October 31, 2019. We will continue to purchase product manufactured at the IMFT facility for a period of up to one year following the close date.
ASML Holding N.V.
As of December 29, 2018, Intel owned $1.1 billion in ASML Holding N.V. (ASML). We have fully sold our equity investment in ASML.
|
| | |
FINANCIAL STATEMENTS | Notes to Financial Statements | 14 |
In the first nine months of 2019, we settled conversion requests for our 2009 debentures totaling $590 million in principal, resulting in a cumulative loss of $148 million recorded in interest and other, net. In the first nine months of 2018, we settled conversion requests for our 2009 debentures totaling $793 million in principal, resulting in a cumulative loss of $211 million.
During the first nine months of 2019, we received proceeds of $648 million in aggregate from the sale of bonds issued by the Industrial Development Authority of the City of Chandler, Arizona (the Arizona bonds) and the State of Oregon Business Development Commission (the Oregon bonds). The bonds are our unsecured general obligations in accordance with loan agreements we entered into with the Industrial Development Authority of the City of Chandler, Arizona and the State of Oregon Business Development Commission. The bonds mature in 2049 and carry an interest rate of 5.0%. The Arizona bonds and the Oregon bonds are subject to mandatory tender in June 2024 and March 2022, respectively, at which time we can re-market the bonds as either fixed-rate bonds for a specified period or as variable-rate bonds until another fixed-rate period is selected or until their final maturity date.
|
| | |
FINANCIAL STATEMENTS | Notes to Financial Statements | 15 |
For information about our fair value policies, and methods and assumptions used in estimating the fair value of our financial assets and liabilities, see "Note 2: Accounting Policies" and "Note 16: Fair Value" in our 2018 Form 10-K.
ASSETS AND LIABILITIES MEASURED AND RECORDED AT FAIR VALUE ON A RECURRING BASIS
|
| | | | | | | | | | | | | | | | | | | | | | | | | | | | | | | | |
| | September 28, 2019 | | December 29, 2018 |
| | Fair Value Measured and Recorded at Reporting Date Using | | | Fair Value Measured and Recorded at Reporting Date Using | |
(In Millions) | | Level 1 | | Level 2 | | Level 3 | | Total | | Level 1 | | Level 2 | | Level 3 | | Total |
Assets | | | | | | | | | | | | | | | | |
Cash equivalents: | | | | | | | | | | | | | | | | |
Corporate debt | | $ | — |
| | $ | 329 |
| | $ | — |
| | $ | 329 |
| | $ | — |
| | $ | 262 |
| | $ | — |
| | $ | 262 |
|
Financial institution instruments¹ | | 1,101 |
| | 460 |
| | — |
| | 1,561 |
| | 550 |
| | 183 |
| | — |
| | 733 |
|
Reverse repurchase agreements | | — |
| | 1,495 |
| | — |
| | 1,495 |
| | — |
| | 1,850 |
| | — |
| | 1,850 |
|
Short-term investments: | | | | | | | | | | | | | | | | |
Corporate debt | | — |
| | 828 |
| | — |
| | 828 |
| | — |
| | 937 |
| | — |
| | 937 |
|
Financial institution instruments¹ | | — |
| | 911 |
| | — |
| | 911 |
| | — |
| | 1,423 |
| | — |
| | 1,423 |
|
Government debt² | | — |
| | 110 |
| | — |
| | 110 |
| | — |
| | 428 |
| | — |
| | 428 |
|
Trading assets: | | | | | | | | | | | | | | | | |
Corporate debt | | — |
| | 2,921 |
| | — |
| | 2,921 |
| | — |
| | 2,635 |
| | — |
| | 2,635 |
|
Financial institution instruments¹ | | 70 |
| | 1,477 |
| | — |
| | 1,547 |
| | 67 |
| | 1,273 |
| | — |
| | 1,340 |
|
Government debt² | | — |
| | 1,773 |
| | — |
| | 1,773 |
| | — |
| | 1,868 |
| | — |
| | 1,868 |
|
Other current assets: | | | | | | | | | | | | | | | | |
Derivative assets | | 62 |
| | 295 |
| | — |
| | 357 |
| | — |
| | 180 |
| | — |
| | 180 |
|
Loans receivable³ | | — |
| | 55 |
| | — |
| | 55 |
| | — |
| | 354 |
| | — |
| | 354 |
|
Marketable equity securities | | 352 |
| | — |
| | — |
| | 352 |
| | 1,440 |
| | — |
| | — |
| | 1,440 |
|
Other long-term investments: | | | | | | | | | | | | | | | | |
Corporate debt | | — |
| | 1,900 |
| | — |
| | 1,900 |
| | — |
| | 1,843 |
| | — |
| | 1,843 |
|
Financial institution instruments¹ | | — |
| | 890 |
| | — |
| | 890 |
| | — |
| | 912 |
| | — |
| | 912 |
|
Government debt² | | — |
| | 638 |
| | — |
| | 638 |
| | — |
| | 633 |
| | — |
| | 633 |
|
Other long-term assets: | | | | | | | | | | | | | | | | |
Derivative assets | | — |
| | 933 |
| | 23 |
| | 956 |
| | — |
| | 100 |
| | — |
| | 100 |
|
Loans receivable³ | | — |
| | 494 |
| | — |
| | 494 |
| | — |
| | 229 |
| | — |
| | 229 |
|
Total assets measured and recorded at fair value | | $ | 1,585 |
| | $ | 15,509 |
| | $ | 23 |
| | $ | 17,117 |
| | $ | 2,057 |
| | $ | 15,110 |
| | $ | — |
| | $ | 17,167 |
|
Liabilities | | | | | | | | | | | | | | | | |
Other accrued liabilities: | | | | | | | | | | | | | | | | |
Derivative liabilities | | $ | — |
| | $ | 440 |
| | $ | — |
| | $ | 440 |
| | $ | — |
| | $ | 412 |
| | $ | — |
| | $ | 412 |
|
Other long-term liabilities: | | | | | | | | | | | | | | | | |
Derivative liabilities | | — |
| | 19 |
| | — |
| | 19 |
| | — |
| | 415 |
| | 68 |
| | 483 |
|
Total liabilities measured and recorded at fair value | | $ | — |
| | $ | 459 |
| | $ | — |
| | $ | 459 |
| | $ | — |
| | $ | 827 |
| | $ | 68 |
| | $ | 895 |
|
| |
1 | Level 1 investments consist of money market funds. Level 2 investments consist primarily of commercial paper, certificates of deposit, time deposits, and notes and bonds issued by financial institutions. |
| |
2 | Level 2 investments consist primarily of U.S. agency notes and non-U.S. government debt. |
| |
3 | The fair value of our loans receivable for which we elected the fair value option did not significantly differ from the contractual principal balance based on the contractual currency. |
|
| | |
FINANCIAL STATEMENTS | Notes to Financial Statements | 16 |
ASSETS MEASURED AND RECORDED AT FAIR VALUE ON A NON-RECURRING BASIS
Our non-marketable equity securities, equity method investments, and certain non-financial assets, such as intangible assets and property, plant and equipment, are recorded at fair value only if an impairment or observable price adjustment is recognized in the current period. If an observable price adjustment or impairment is recognized on our non-marketable equity securities during the period, we classify these assets as Level 3 within the fair value hierarchy based on the nature of the fair value inputs.
FINANCIAL INSTRUMENTS NOT RECORDED AT FAIR VALUE ON A RECURRING BASIS
Financial instruments not recorded at fair value on a recurring basis include non-marketable equity securities (that have not been re-measured or impaired in the current period), equity method investments, grants receivable, loans receivable, reverse repurchase agreements, and our short-term and long-term debt.
As of September 28, 2019, the aggregate carrying value of grants receivable, loans receivable, and reverse repurchase agreements was $1.3 billion (the aggregate carrying amount as of December 29, 2018 was $833 million). The estimated fair value of these financial instruments approximates their carrying value and is categorized as Level 2 within the fair value hierarchy based on the nature of the fair value inputs.
As of September 28, 2019, the fair value of short and long-term debt (excluding drafts payable) was $30.3 billion (the fair value as of December 29, 2018 was $27.1 billion). These liabilities are classified as Level 2 within the fair value hierarchy based on the nature of the fair value inputs.
|
| |
NOTE 11 : | DERIVATIVE FINANCIAL INSTRUMENTS |
For further information on our derivative policies, see "Note 2: Accounting Policies" in our 2018 Form 10-K.
VOLUME OF DERIVATIVE ACTIVITY
Total gross notional amounts for outstanding derivatives (recorded at fair value) at the end of each period were as follows:
|
| | | | | | | | |
(In Millions) | | Sep 28,
2019 | | Dec 29,
2018 |
Foreign currency contracts | | $ | 23,144 |
| | $ | 19,223 |
|
Interest rate contracts | | 15,194 |
| | 22,447 |
|
Other | | 1,594 |
| | 1,356 |
|
Total | | $ | 39,932 |
| | $ | 43,026 |
|
FAIR VALUE OF DERIVATIVE INSTRUMENTS
|
| | | | | | | | | | | | | | | | |
| | September 28, 2019 | | December 29, 2018 |
(In Millions) | | Assets1 | | Liabilities2 | | Assets1 | | Liabilities2 |
Derivatives designated as hedging instruments: | | | | | | | | |
Foreign currency contracts3 | | $ | 84 |
| | $ | 259 |
| | $ | 44 |
| | $ | 244 |
|
Interest rate contracts | | 922 |
| | — |
| | 84 |
| | 474 |
|
Total derivatives designated as hedging instruments | | 1,006 |
| | 259 |
| | 128 |
| | 718 |
|
Derivatives not designated as hedging instruments: | | | | | | | | |
Foreign currency contracts3 | | 236 |
| | 131 |
| | 132 |
| | 155 |
|
Interest rate contracts | | 9 |
| | 69 |
| | 20 |
| | 22 |
|
Equity contracts | | 62 |
| | — |
| | — |
| | — |
|
Total derivatives not designated as hedging instruments | | 307 |
| | 200 |
| | 152 |
| | 177 |
|
Total derivatives | | $ | 1,313 |
| | $ | 459 |
| | $ | 280 |
| | $ | 895 |
|
| |
1 | Derivative assets are recorded as other assets, current and non-current. |
| |
2 | Derivative liabilities are recorded as other liabilities, current and non-current. |
| |
3 | The majority of these instruments mature within 12 months. |
|
| | |
FINANCIAL STATEMENTS | Notes to Financial Statements | 17 |
AMOUNTS OFFSET IN THE CONSOLIDATED CONDENSED BALANCE SHEETS
The gross amounts of our derivative instruments and reverse repurchase agreements subject to master netting arrangements with various counterparties, and cash and non-cash collateral posted under such agreements at the end of each period were as follows:
|
| | | | | | | | | | | | | | | | | | | | | | | | |
| | September 28, 2019 |
| | | | | | | | Gross Amounts Not Offset in the Balance Sheet | | |
(In Millions) | | Gross Amounts Recognized | | Gross Amounts Offset in the Balance Sheet | | Net Amounts Presented in the Balance Sheet | | Financial Instruments | | Cash and Non-Cash Collateral Received or Pledged | | Net Amount |
Assets: | | | | | | | | | | | | |
Derivative assets subject to master netting arrangements | | $ | 1,299 |
| | $ | — |
| | $ | 1,299 |
| | $ | (240 | ) | | $ | (1,053 | ) | | $ | 6 |
|
Reverse repurchase agreements | | 1,845 |
| | — |
| | 1,845 |
| | — |
| | (1,845 | ) | | — |
|
Total assets | | 3,144 |
| | — |
| | 3,144 |
| | (240 | ) | | (2,898 | ) | | 6 |
|
Liabilities: | | | | | | | | | | | | |
Derivative liabilities subject to master netting arrangements | | 407 |
| | — |
| | 407 |
| | (240 | ) | | (128 | ) | | 39 |
|
Total liabilities | | $ | 407 |
| | $ | — |
| | $ | 407 |
| | $ | (240 | ) | | $ | (128 | ) | | $ | 39 |
|
|
| | | | | | | | | | | | | | | | | | | | | | | | |
| | December 29, 2018 |
| | | | | | | | Gross Amounts Not Offset in the Balance Sheet | | |
(In Millions) | | Gross Amounts Recognized | | Gross Amounts Offset in the Balance Sheet | | Net Amounts Presented in the Balance Sheet | | Financial Instruments | | Cash and Non-Cash Collateral Received or Pledged | | Net Amount |
Assets: | | | | | | | | | | | | |
Derivative assets subject to master netting arrangements | | $ | 292 |
| | $ | — |
| | $ | 292 |
| | $ | (220 | ) | | $ | (72 | ) | | $ | — |
|
Reverse repurchase agreements | | 2,099 |
| | — |
| | 2,099 |
| | — |
| | (1,999 | ) | | 100 |
|
Total assets | | 2,391 |
| | — |
| | 2,391 |
| | (220 | ) | | (2,071 | ) | | 100 |
|
Liabilities: | | | | | | | | | | | | |
Derivative liabilities subject to master netting arrangements | | 890 |
| | — |
| | 890 |
| | (220 | ) | | (576 | ) | | 94 |
|
Total liabilities | | $ | 890 |
| | $ | — |
| | $ | 890 |
| | $ | (220 | ) | | $ | (576 | ) | | $ | 94 |
|
We obtain and secure available collateral from counterparties against obligations, including securities lending transactions and reverse repurchase agreements, when we deem it appropriate.
DERIVATIVES IN CASH FLOW HEDGING RELATIONSHIPS
The before-tax net gains or losses attributed to the effective portion of cash flow hedges, recognized in other comprehensive income (loss), were $203 million net losses in the third quarter of 2019 and $52 million net losses in the first nine months of 2019 ($69 million net losses in the third quarter of 2018 and $203 million net losses in the first nine months of 2018). Substantially all of our cash flow hedges were foreign currency contracts for all periods presented.
During the first nine months of 2019 and 2018, the amounts excluded from effectiveness testing were insignificant.
|
| | |
FINANCIAL STATEMENTS | Notes to Financial Statements | 18 |
DERIVATIVES IN FAIR VALUE HEDGING RELATIONSHIPS
The effects of derivative instruments designated as fair value hedges, recognized in interest and other, net for each period were as follows:
|
| | | | | | | | | | | | | | | | |
| | Three Months Ended | | Nine Months Ended |
(In Millions) | | Sep 28,
2019 | | Sep 29,
2018 | | Sep 28,
2019 | | Sep 29,
2018 |
Interest rate contracts | | $ | 273 |
| | $ | (230 | ) | | $ | 1,312 |
| | $ | (601 | ) |
Hedged items | | (273 | ) | | 230 |
| | (1,312 | ) | | 601 |
|
Total | | $ | — |
| | $ | — |
| | $ | — |
| | $ | — |
|
The amounts recorded on the consolidated condensed balance sheets related to cumulative basis adjustments for fair value hedges for each period were as follows: |
| | | | | | | | | | | | | | | | |
Line Item in the Consolidated Condensed Balance Sheet in Which the Hedged Item is Included | | Carrying Amount of the Hedged Item Asset/(Liabilities) | | Cumulative Amount of Fair Value Hedging Adjustment Included in the Carrying Amount Assets/(Liabilities) |
Years Ended
(In Millions) | | Sep 28,
2019 | | Dec 29,
2018 | | Sep 28,
2019 | | Dec 29,
2018 |
Long-term debt | | $ | (13,834 | ) | | $ | (19,622 | ) | | $ | (922 | ) | | $ | 390 |
|
As of September 28, 2019 and December 29, 2018, the total notional amount of pay variable/receive fixed-interest rate swaps was $12.9 billion and $20.0 billion, respectively. During the third quarter of 2019, we unwound $7.1 billion of swaps resulting in a $111 million gain to be amortized over the remaining life of the debt.
DERIVATIVES NOT DESIGNATED AS HEDGING INSTRUMENTS
The effects of derivative instruments not designated as hedging instruments on the consolidated condensed statements of income for each period were as follows:
|
| | | | | | | | | | | | | | | | | | |
| | | | Three Months Ended | | Nine Months Ended |
(In Millions) | | Location of Gains (Losses) Recognized in Income on Derivatives | | Sep 28,
2019 | | Sep 29,
2018 | | Sep 28,
2019 | | Sep 29,
2018 |
Foreign currency contracts | | Interest and other, net | | $ | 150 |
| | $ | (1 | ) | | $ | 187 |
| | $ | 268 |
|
Interest rate contracts | | Interest and other, net | | (12 | ) | | 3 |
| | (51 | ) | | 22 |
|
Other | | Various | | 17 |
| | 53 |
| | 198 |
| | 49 |
|
Total | | | | $ | 155 |
| | $ | 55 |
| | $ | 334 |
| | $ | 339 |
|
LEGAL PROCEEDINGS
We are a party to various legal proceedings, including those noted in this section. Although management at present believes that the ultimate outcome of these proceedings, individually and in the aggregate, will not materially harm our financial position, results of operations, cash flows, or overall trends, legal proceedings and related government investigations are subject to inherent uncertainties, and unfavorable rulings or other events could occur. Unfavorable resolutions could include substantial monetary damages. In addition, in matters for which injunctive relief or other conduct remedies are sought, unfavorable resolutions could include an injunction or other order prohibiting us from selling one or more products at all or in particular ways, precluding particular business practices, or requiring other remedies. An unfavorable outcome may result in a material adverse impact on our business, results of operations, financial position, and overall trends. We might also conclude that settling one or more such matters is in the best interests of our stockholders, employees, and customers, and any such settlement could include substantial payments. Except as specifically described below, we have not concluded that settlement of any of the legal proceedings noted in this section is appropriate at this time.
|
| | |
FINANCIAL STATEMENTS | Notes to Financial Statements | 19 |
European Commission Competition Matter
In 2001, the European Commission (EC) commenced an investigation regarding claims by Advanced Micro Devices, Inc. (AMD) that we used unfair business practices to persuade customers to buy our microprocessors. We received numerous requests for information and documents from the EC and we responded to each of those requests. The EC issued a Statement of Objections in July 2007 and held a hearing on that Statement in March 2008. The EC issued a Supplemental Statement of Objections in July 2008. In May 2009, the EC issued a decision finding that we had violated Article 82 of the EC Treaty and Article 54 of the European Economic Area Agreement. In general, the EC found that we violated Article 82 (later renumbered as Article 102 by a new treaty) by offering alleged "conditional rebates and payments" that required our customers to purchase all or most of their x86 microprocessors from us. The EC also found that we violated Article 82 by making alleged "payments to prevent sales of specific rival products." The EC imposed a fine in the amount of €1.1 billion ($1.4 billion as of May 2009), which we subsequently paid during the third quarter of 2009, and ordered us to "immediately bring to an end the infringement referred to in" the EC decision.
The EC decision contained no specific direction on whether or how we should modify our business practices. Instead, the decision stated that we should "cease and desist" from further conduct that, in the EC's opinion, would violate applicable law. We took steps, which are subject to the EC's ongoing review, to comply with that decision pending appeal. We had discussions with the EC to better understand the decision and to explain changes to our business practices.
We appealed the EC decision to the Court of First Instance (which has been renamed the General Court) in July 2009. The hearing of our appeal took place in July 2012. In June 2014, the General Court rejected our appeal in its entirety. In August 2014, we filed an appeal with the European Court of Justice. In November 2014, Intervener Association for Competitive Technologies filed comments in support of Intel’s grounds of appeal. The EC and interveners filed briefs in November 2014, we filed a reply in February 2015, and the EC filed a rejoinder in April 2015. The Court of Justice held oral argument in June 2016. In October 2016, Advocate General Wahl, an advisor to the Court of Justice, issued a non-binding advisory opinion that favored Intel on a number of grounds. The Court of Justice issued its decision in September 2017, setting aside the judgment of the General Court and sending the case back to the General Court to examine whether the rebates at issue were capable of restricting competition. The General Court has appointed a panel of five judges to consider our appeal of the EC’s 2009 decision in light of the Court of Justice’s clarifications of the law. In November 2017, the parties filed initial “Observations” about the Court of Justice’s decision and the appeal, and were invited by the General Court to offer supplemental comments to each other’s “Observations,” which the parties submitted in March 2018. Responses to other questions posed by the General Court were filed in May and June 2018. We anticipate that the General Court will schedule oral argument for early 2020. Pending the final decision in this matter, the fine paid by Intel has been placed by the EC in commercial bank accounts where it accrues interest.
McAfee, Inc. Shareholder Litigation
On August 19, 2010, we announced that we had agreed to acquire all of the common stock of McAfee, Inc. (McAfee) for $48.00 per share. Four McAfee shareholders filed putative class-action lawsuits in Santa Clara County, California Superior Court challenging the proposed transaction. The cases were ordered consolidated in September 2010. Plaintiffs filed an amended complaint that named former McAfee board members, McAfee, and Intel as defendants, and alleged that the McAfee board members breached their fiduciary duties and that McAfee and Intel aided and abetted those breaches of duty. The complaint requested rescission of the merger agreement, such other equitable relief as the court may deem proper, and an award of damages in an unspecified amount. In June 2012, the plaintiffs’ damages expert asserted that the value of a McAfee share for the purposes of assessing damages should be $62.08.
In January 2012, the court certified the action as a class action, appointed the Central Pension Laborers’ Fund to act as the class representative, and scheduled trial to begin in January 2013. In March 2012, defendants filed a petition with the California Court of Appeal for a writ of mandate to reverse the class certification order; the petition was denied in June 2012. In March 2012, at defendants’ request, the court held that plaintiffs were not entitled to a jury trial and ordered a bench trial. In April 2012, plaintiffs filed a petition with the California Court of Appeal for a writ of mandate to reverse that order, which the court of appeal denied in July 2012. In August 2012, defendants filed a motion for summary judgment. The trial court granted that motion in November 2012 and entered final judgment in the case in February 2013. In April 2013, plaintiffs appealed the final judgment. The California Court of Appeal heard oral argument in October 2017, and in November 2017, affirmed the judgment as to McAfee's nine outside directors, reversed the judgment as to former McAfee director and chief executive officer David DeWalt, Intel, and McAfee, and affirmed the trial court's ruling that the plaintiffs are not entitled to a jury trial. At a June 2018 case management conference following remand, the Superior Court set an October hearing date for any additional summary judgment motions that may be filed, and set trial to begin in December 2018. In July 2018, plaintiffs filed a motion for leave to amend the complaint, which the court denied in September 2018. Also, in July 2018, McAfee and Intel filed a motion for summary judgment on the aiding and abetting claims asserted against them; in October 2018, the court granted the motion as to McAfee and denied the motion as to Intel.
The parties agreed in principle to settle the case in late October 2018, and finalized the settlement agreement in March 2019. The court granted plaintiffs' motion for preliminary approval of the settlement in May 2019, and granted plaintiffs' motion for final approval of the settlement in October 2019. The settlement requires an aggregate payment by defendants of $12 million. Intel’s contribution to the settlement is immaterial to its financial statements.
|
| | |
FINANCIAL STATEMENTS | Notes to Financial Statements | 20 |
Litigation Related to Security Vulnerabilities
In June 2017, a Google research team notified us and other companies that it had identified security vulnerabilities (now commonly referred to as “Spectre” and “Meltdown”) that affect many types of microprocessors, including our products. As is standard when findings like these are presented, we worked together with other companies in the industry to verify the research and develop and validate software and firmware updates for impacted technologies. On January 3, 2018, information on the security vulnerabilities was publicly reported, before software and firmware updates to address the vulnerabilities were made widely available. Numerous lawsuits have been filed against Intel and, in certain cases, our current and former executives and directors, in U.S. federal and state courts and in certain courts in other countries relating to the Spectre and Meltdown security vulnerabilities, as well as another variant of these vulnerabilities (“Foreshadow”) that has since been identified.
As of October 23, 2019, consumer class action lawsuits relating to certain security vulnerabilities publicly disclosed in 2018 were pending in the United States, Canada, and Israel. The plaintiffs, who purport to represent various classes of purchasers of our products, generally claim to have been harmed by Intel's actions and/or omissions in connection with the security vulnerabilities and assert a variety of common law and statutory claims seeking monetary damages and equitable relief. In the U.S., numerous individual class action suits filed in various jurisdictions were consolidated in April 2018 for all pretrial proceedings in the U.S. District Court for the District of Oregon. Intel filed a motion to dismiss that consolidated action in October 2018, and a hearing on that motion was held in February 2019. In Canada, in one case pending in the Superior Court of Justice of Ontario, an initial status conference has not yet been scheduled. In a second case pending in the Superior Court of Justice of Quebec, the court entered an order in October 2018, staying that case for one year. In Israel, both consumer class action lawsuits were filed in the District Court of Haifa. In the first case, the District Court denied the parties' joint motion to stay filed in January 2019, but to date has deferred Intel’s deadline to respond to the complaint in view of Intel’s pending motion to dismiss in the consolidated proceeding in the U.S. Intel filed a motion to stay the second case pending resolution of the consolidated proceeding in the U.S., and a hearing on that motion has been scheduled for November 2019. Additional lawsuits and claims may be asserted seeking monetary damages or other related relief. We dispute the pending claims described above and intend to defend those lawsuits vigorously. Given the procedural posture and the nature of those cases, including that the pending proceedings are in the early stages, that alleged damages have not been specified, that uncertainty exists as to the likelihood of a class or classes being certified or the ultimate size of any class or classes if certified, and that there are significant factual and legal issues to be resolved, we are unable to make a reasonable estimate of the potential loss or range of losses, if any, that might arise from those matters.
In addition to these lawsuits, Intel stockholders have filed multiple shareholder derivative lawsuits since January 2018 against certain current and former members of our Board of Directors and certain current and former officers, alleging that the defendants breached their duties to Intel in connection with the disclosure of the security vulnerabilities and the failure to take action in relation to alleged insider trading. The complaints seek to recover damages from the defendants on behalf of Intel. Some of the derivative actions were filed in the U.S. District Court for the Northern District of California and were consolidated, and the others were filed in the Superior Court of the State of California in San Mateo County and were consolidated. The federal court granted defendants' motion to dismiss the consolidated complaint in the federal action in August 2018 on the ground that plaintiffs failed to plead facts sufficient to show they were excused from making a pre-lawsuit demand on the Board. The federal court granted plaintiffs leave to amend their complaint, but subsequently dismissed the cases without prejudice in January 2019 at plaintiffs' request. In August 2018, the California Superior Court granted defendants' motion to dismiss the consolidated complaint in the state court action on the ground that plaintiffs failed to plead facts sufficient to show they were excused from making a pre-lawsuit demand on the Board, but granted plaintiffs leave to amend. In July 2019, the California Superior Court dismissed plaintiffs' amended complaint on the same grounds as the previous complaint, but again granted plaintiffs leave to amend. Defendants' motion to dismiss plaintiffs' second amended complaint is scheduled for hearing in November 2019.
|
| | |
FINANCIAL STATEMENTS | Notes to Financial Statements | 21 |
|
|
MANAGEMENT'S DISCUSSION AND ANALYSIS (MD&A) |
Third quarter revenue was $19.2 billion as our data-centric businesses grew 6% year over year, offset by the PC-centric business decline of 5%. Data-centric revenue was up compared to a year ago, driven by a strong mix of high-performance Intel® Xeon® processors in our DCG business and growth across all businesses. Our PC-centric business was down on lower year over year platform volume, partially offset by a strong mix of higher performance products as the commercial segment of the PC market remained strong. Lower platform unit sales and margin compression on memory products resulted in lower gross margins and operating income, which was partially offset by platform ASP strength and lower investments in modem. In the first nine months we generated $23.3 billion of cash flow from operations and returned $14.3 billion to stockholders, including $4.2 billion in dividends and $10.1 billion in buybacks. For key highlights of the results of our operations, see "A Quarter in Review."
|
| | | | | | | | | | | | | | | | | | | | | | | | | | | | |
| | Three Months Ended | | Nine Months Ended |
| | Q3 2019 | | Q3 2018 | | YTD 2019 | | YTD 2018 |
(Dollars in Millions, Except Per Share Amounts) | | Amount | | % of Net
Revenue | | Amount | | % of Net
Revenue | | Amount | | % of Net
Revenue | | Amount | | % of Net
Revenue |
Net revenue | | $ | 19,190 |
| | 100.0 | % | | $ | 19,163 |
| | 100.0 | % | | $ | 51,756 |
| | 100.0 | % | | $ | 52,191 |
| | 100.0 | % |
Cost of sales | | 7,895 |
| | 41.1 | % | | 6,803 |
| | 35.5 | % | | 21,494 |
| | 41.5 | % | | 19,681 |
| | 37.7 | % |
Gross margin | | 11,295 |
| | 58.9 | % | | 12,360 |
| | 64.5 | % | | 30,262 |
| | 58.5 | % | | 32,510 |
| | 62.3 | % |
Research and development | | 3,208 |
| | 16.7 | % | | 3,428 |
| | 17.9 | % | | 9,978 |
| | 19.3 | % | | 10,110 |
| | 19.4 | % |
Marketing, general and administrative | | 1,486 |
| | 7.7 | % | | 1,605 |
| | 8.4 | % | | 4,608 |
| | 8.9 | % | | 5,230 |
| | 10.0 | % |
Restructuring and other charges | | 104 |
| | 0.5 | % | | (72 | ) | | (0.4 | )% | | 288 |
| | 0.6 | % | | (72 | ) | | (0.1 | )% |
Amortization of acquisition-related intangibles | | 50 |
| | 0.3 | % | | 50 |
| | 0.3 | % | | 150 |
| | 0.3 | % | | 150 |
| | 0.3 | % |
Operating income | | 6,447 |
| | 33.6 | % | | 7,349 |
| | 38.3 | % | | 15,238 |
| | 29.4 | % | | 17,092 |
| | 32.7 | % |
Gains (losses) on equity investments, net | | 318 |
| | 1.7 | % | | (75 | ) | | (0.4 | )% | | 922 |
| | 1.8 | % | | 365 |
| | 0.7 | % |
Interest and other, net | | (46 | ) | | (0.2 | )% | | (132 | ) | | (0.7 | )% | | (170 | ) | | (0.3 | )% | | 225 |
| | 0.4 | % |
Income before taxes | | 6,719 |
| | 35.0 | % | | 7,142 |
| | 37.3 | % | | 15,990 |
| | 30.9 | % | | 17,682 |
| | 33.9 | % |
Provision for taxes | | 729 |
| | 3.8 | % | | 744 |
| | 3.9 | % | | 1,847 |
| | 3.6 | % | | 1,824 |
| | 3.5 | % |
Net income | | $ | 5,990 |
| | 31.2 | % | | $ | 6,398 |
| | 33.4 | % | | $ | 14,143 |
| | 27.3 | % | | $ | 15,858 |
| | 30.4 | % |
| | | | | | | | | | | | | | | | |
Earnings per share – diluted | | $ | 1.35 |
| | | | $ | 1.38 |
| | | | $ | 3.14 |
| | | | $ | 3.35 |
| | |
|
| | |
MD&A | Consolidated Results & Analysis | 22 |
REVENUE
|
| | | | |
| SEGMENT REVENUE WALKS $B | |
| Q3 2019 vs. Q3 2018 | | YTD 2019 vs. YTD 2018 | |
Q3 2019 vs. Q3 2018
Our Q3 2019 revenue was $19.2 billion, flat from Q3 2018. Compared to a year ago, our data-centric businesses were collectively up 6% as platform ASPs increased due to richer core mix and NAND bit growth, partially offset by NSG ASP decline due to lower NAND market pricing. Revenue for our PC-centric business decreased by 5% year over year, primarily driven by platform volume decline compared to Q3 2018, when internal inventory was drawn on to meet demand, offset by ASP strength in our commercial market segment.
YTD 2019 vs. YTD 2018
Our YTD 2019 revenue was $51.8 billion, down $435 million, or 1% from YTD 2018. Our data-centric businesses were collectively down 2% as demand from enterprise and government data center customers weakened in the first half of 2019 and NSG ASPs declined due to lower NAND market pricing. Revenue for our PC-centric business was flat YTD 2019 compared to YTD 2018.
|
| | |
MD&A | Consolidated Results & Analysis | 23 |
GROSS MARGIN
We derived most of our overall gross margin dollars from the sale of platform products in the CCG and DCG operating segments. Our overall gross margin dollars in Q3 2019 decreased by $1.1 billion, or 8.6% compared to Q3 2018.
(Percentages in chart indicate gross margin as a percentage of total revenue)
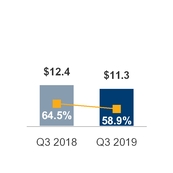
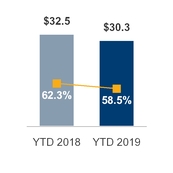
|
| | | | |
(In Millions) | | |
$ | 11,295 |
| | Q3 2019 Gross Margin |
(855 | ) | | Lower gross margin from adjacent businesses primarily due to NAND, modem, and the absence of government grants recognized in Q3 2018 |
(500 | ) | | Higher platform unit cost primarily from increased mix of performance products |
(140 | ) | | Lower gross margin from platform revenue |
455 |
| | Lower period charges primarily due to lower factory start-up costs and sell-through of previously reserved non-qualified platform product, offset by higher initial production costs associated with our 10nm process technology |
(25 | ) | | Other |
$ | 12,360 |
| | Q3 2018 Gross Margin |
| | |
$ | 30,262 |
| | YTD 2019 Gross Margin |
(1,300 | ) | | Lower gross margin from adjacent businesses primarily due to NAND, the absence of government grants recognized in Q3 2018, modem, and IOTG |
(695 | ) | | Higher platform unit cost primarily from increased mix of performance products |
(370 | ) | | Lower gross margin from platform revenue |
105 |
| | Lower period charges primarily due to lower factory start-up costs and sell-through of previously reserved non-qualified platform product, offset by higher initial production costs associated with our 10nm process technology |
12 |
| | Other |
$ | 32,510 |
| | YTD 2018 Gross Margin |
|
| | |
MD&A | Consolidated Results & Analysis | 24 |
OPERATING EXPENSES
Total research and development (R&D) and marketing, general and administrative (MG&A) expenses for Q3 2019 were $4.7 billion, down 7% from Q3 2018, and were $14.6 billion for YTD 2019, down 5% from YTD 2018. These expenses represent 24.5% of revenue for Q3 2019 and 26.3% of revenue for Q3 2018, and 28.2% of revenue in the first nine months of 2019 and 29.4% of revenue in the first nine months of 2018.
|
| | | |
| RESEARCH AND DEVELOPMENT $B | | MARKETING, GENERAL AND ADMINISTRATIVE $B |
(Percentages indicate expenses as a percentage of total revenue)
Q3 2019 – Q3 2018
|
| |
R&D decreased by $220 million, or 6.4%, driven by the following: |
| |
- | Ramp down of 5G smartphone modem business |
- | Profit dependent compensation due to a decrease in net income |
+ | Investments in data-centric businesses |
YTD 2019 – YTD 2018
|
| |
R&D decreased by $132 million, or 1.3%, driven by the following: |
| |
- | Ramp down of 5G smartphone modem business and other projects |
- | Corporate spending efficiencies |
- | Profit dependent compensation due to a decrease in net income |
+ | Investments in data-centric businesses |
+ | Investments in process technology |
|
|
MARKETING, GENERAL AND ADMINISTRATIVE |
Q3 2019 – Q3 2018
|
| |
MG&A decreased by $119 million, or 7.4%, driven by the following: |
| |
- | Corporate spending efficiencies |
- | Profit dependent compensation due to a decrease in net income |
YTD 2019 – YTD 2018
|
| |
MG&A decreased by $622 million, or 11.9%, driven by the following: |
| |
- | Corporate spending efficiencies |
- | Profit dependent compensation due to a decrease in net income |
- | Lack of expenses due to the Wind River Divestiture |
|
| | |
MD&A | Consolidated Results & Analysis | 25 |
CLIENT COMPUTING GROUP (CCG)
CCG is our largest business unit. The PC market remains a critical facet of our business, providing an important source of intellectual property, scale, and cash flow. CCG is dedicated to delivering client computing end-user solutions, focusing on higher growth segments of 2-in-1, thin-and-light, commercial, and gaming, as well as growing adjacencies such as WiFi and Thunderbolt™ technology. CCG is the human edge in a data-centric world. We deploy platforms that connect people to data and analytics, allowing each person to focus, create, and connect in ways that unlock their individual potential. We continued to be supply constrained in Q3, particularly at the value-end of the market, as higher than expected PC demand strength continues to outpace our supply despite capacity additions we have made this year.
We will be exiting the 5G smartphone modem business, while continuing to meet current customer commitments for our existing 4G modem product lines. We continue to pursue opportunities for 4G and 5G modems in PCs, as well as Internet of Things and other data-centric devices. |
| | | |
| CCG REVENUE $B | | CCG OPERATING INCOME $B |
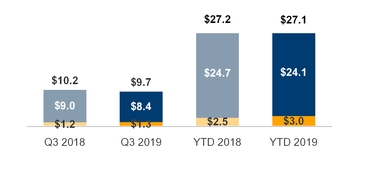
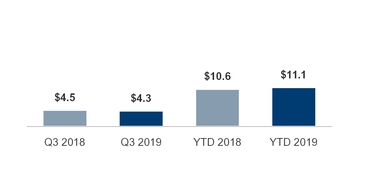
Our revenue in Q3 2019 was down 5% compared to Q3 2018, and flat YTD 2019 compared to YTD 2018. Q3 revenue decreased year over year driven by platform volume decline compared to Q3 2018, when internal inventory was drawn on to meet demand, offset by ASP strength from richer commercial segment mix and modem growth. Revenue was flat year to date compared to 2018, as the decline in platform volume was mostly offset by ASP strength from richer commercial segment mix and modem growth. |
| | | | | | | | | | | | | | |
| | Q3 2019 vs. Q3 2018 | | YTD 2019 vs. YTD 2018 |
(Dollars in Millions) | | % | | $ Impact | | % | | $ Impact |
| | | | | | | | | | |
Desktop platform volume | | down | (11)% | | $ | (362 | ) | | down | (10)% | | $ | (890 | ) |
Desktop platform ASP | | up | 3% | | 105 |
| | up | 5% | | 425 |
|
Notebook platform volume | | down | (10)% | | (568 | ) | | down | (6)% | | (998 | ) |
Notebook platform ASP | | up | 4% | | 187 |
| | up | 6% | | 905 |
|
Adjacent products and other | | | | | 113 |
| | | | | 512 |
|
| | | | | | | | | | |
Total change in revenue | | | | | $ | (525 | ) | | | | | $ | (46 | ) |
|
| | |
MD&A | Segment Results & Analysis | 26 |
Operating income in Q3 2019 decreased 5% from Q3 2018, with an operating margin of 44%. Operating income YTD 2019 increased 5% from YTD 2018, with an operating margin of 41%. |
| | | | |
(In Millions) | | |
$ | 4,305 |
| | Q3 2019 CCG Operating Income |
(515 | ) | | Higher platform unit cost |
(435 | ) | | Lower gross margin from platform revenue |
(225 | ) | | Lower gross margin from adjacent businesses |
690 |
| | Lower period charges primarily due to lower factory start-up costs and sell-through of previously reserved non-qualified platform product, offset by higher initial production costs associated with our 10nm process technology |
265 |
| | Lower operating expenses primarily driven by lower investments in modem |
(7 | ) | | Other |
$ | 4,532 |
| | Q3 2018 CCG Operating Income |
| | |
$ | 11,114 |
| | YTD 2019 CCG Operating Income |
820 |
| | Lower period charges primarily due to lower factory start-up costs and sell-through of previously reserved non-qualified platform product, offset by higher initial production costs associated with our 10nm process technology |
550 |
| | Lower operating expenses primarily driven by lower investments in modem |
(595 | ) | | Higher platform unit cost |
(130 | ) | | Lower gross margin from platform revenue |
(110 | ) | | Lower gross margin from adjacent businesses |
22 |
| | Other |
$ | 10,557 |
| | YTD 2018 CCG Operating Income |
|
| | |
MD&A | Segment Results & Analysis | 27 |
DATA CENTER GROUP (DCG)
DCG develops workload-optimized platforms for compute, storage, and network functions. Customers include cloud service providers, enterprise and government, and communications service providers. DCG is fueled by demand in key workloads like artificial intelligence and network function virtualization across key market segments.
|
| | | |
| DCG REVENUE $B | | DCG OPERATING INCOME $B |
DCG delivered record revenue in Q3 2019, up 4% compared to Q3 2018 primarily driven by platform ASP strength partially offset by a decline in platform volume. In Q3 2019, revenue in the enterprise and government market segment was up 1%, cloud service providers market segment was up 3%, and the communication service providers market segment was up 11% year over year. Revenue was down 4% YTD 2019 compared to YTD 2018 as customers worked through inventory and the total addressable market (TAM) contracted in the enterprise and government market segment in the first half of 2019, partially offset by platform ASP strength and adjacencies growth.
|
| | | | | | | | | | | | | |
| Q3 2019 vs. Q3 2018 | | YTD 2019 vs. YTD 2018 |
(Dollars in Millions) | % | | $ Impact | | % | | $ Impact |
| | | | | | | | | |
Platform volume | down | (6)% | | $ | (315 | ) | | down | (8)% | | $ | (1,306 | ) |
Platform ASP | up | 9% | | 497 |
| | up | 4% | | 599 |
|
Adjacent products | up | 12% | | 62 |
| | up | 4% | | 53 |
|
| | | | | | | | | |
Total change in revenue | | | | $ | 244 |
| | | | | $ | (654 | ) |
Operating income in Q3 2019 increased 1% from Q3 2018, with an operating margin of 49%. Operating income YTD 2019 decreased 20% from YTD 2018, with an operating margin of 42%.
|
| | | | |
(In Millions) | | |
$ | 3,115 |
| | Q3 2019 DCG Operating Income |
225 |
| | Higher gross margin from platform revenue |
(165 | ) | | Higher period charges, primarily associated with the initial ramp of 10nm |
(27 | ) | | Other |
$ | 3,082 |
| | Q3 2018 DCG Operating Income |
| | |
$ | 6,756 |
| | YTD 2019 DCG Operating Income |
(610 | ) | | Higher period charges, primarily associated with the initial ramp of 10nm |
(540 | ) | | Lower gross margin from platform revenue |
(425 | ) | | Higher DCG operating expenses |
(90 | ) | | Lower gross margin from adjacent businesses and other |
$ | 8,421 |
| | YTD 2018 DCG Operating Income |
|
| | |
MD&A | Segment Results & Analysis | 28 |
INTERNET OF THINGS
As more intelligence is moving to the edge, more industries want to harness the power of data to create business value, innovate, and grow. We are using our architecture, accelerators, and software assets, combined with scale and partners, to develop a growing Internet of Things portfolio. Our Internet of Things portfolio is comprised of our Internet of Things Group (IOTG) and Mobileye businesses.
IOTG develops high-performance compute for targeted verticals and embedded markets. Our customers include retailers, manufacturers, health care providers, energy companies, automakers, and governments. We facilitate our customers creating, storing, and processing data generated by connected devices to accelerate business transformations.
Mobileye is the global leader in the development of computer vision and machine learning-based sensing, data analysis, localization, mapping, and driving policy technology for advanced driver assistance systems (ADAS) and autonomous driving. Mobileye’s ADAS products form the building blocks for higher levels of autonomy that are being pursued by the automotive industry. Our customers and strategic partners include major U.S. and global Tier 1 automotive system integrators.
|
| | | |
| INTERNET OF THINGS REVENUE $B | | INTERNET OF THINGS OPERATING INCOME $B |
|
| | | | | | | |
| ■ IOTG | ■ Mobileye | | | ■ IOTG | ■ Mobileye | |
|
|
REVENUE AND OPERATING INCOME SUMMARY |
IOTG delivered record net revenue of $1.0 billion, up $86 million, due to higher platform unit sales and higher ASPs from richer core mix. Operating income was $309 million, down $12 million driven by higher period charges offset by higher platform revenue.
Mobileye recognized record net revenue of $229 million, up $38 million due to increasing adoption of ADAS. Operating income was $67 million, up $15 million.
IOTG net revenue was $2.9 billion, up $262 million, due to $230 million higher ASPs from richer core mix and $90 million higher platform unit sales, partially offset by lower revenue from our divestiture of Wind River in Q2 2018, which negatively impacted the revenue comparison by approximately $153 million in the first half of 2019. After adjusting for the Wind River divestiture, IOTG revenue grew 17%. Operating income was $854 million, up $63 million, primarily driven by higher platform revenue from richer core mix.
Mobileye net revenue was $639 million, up $124 million due to increasing adoption of ADAS. Operating income was $188 million, up $82 million.
|
| | |
MD&A | Segment Results & Analysis | 29 |
NON-VOLATILE MEMORY SOLUTIONS GROUP (NSG)
NSG's core offerings include Intel® Optane™ and Intel® 3D NAND Technology, driving innovation in SSDs and next-generation memory and storage products. Our customers include enterprise and cloud-based data centers, and users of business and consumer desktops and laptops. We are ramping 64-layer (64L) triple-level cell (TLC) and quad-level cell (QLC) NAND technologies, and Intel® Optane™ technology in innovative new form factors and densities to address the challenges our customers face in a rapidly evolving technological landscape.
|
| | | |
| NSG REVENUE $B | | NSG OPERATING INCOME $B |
|
|
REVENUE AND OPERATING INCOME SUMMARY |
NSG recognized record net revenue of $1.3 billion, up $209 million from Q3 2018, driven by $1.7 billion higher volume due to an increase in demand for NAND products offset by a $1.5 billion impact from lower ASP due to lower NAND market pricing. NSG had an operating loss of $499 million in Q3 2019, down $659 million from a Q3 2018 operating profit of $160 million. While we continued to see the ramp at Fab 68 drive cost improvements, the decline in ASP and the absence of $160 million in government grants recognized in Q3 2018 more than offset the improved unit cost, resulting in lower gross margins.
Net revenue was $3.1 billion, down $55 million, driven by a $3.2 billion impact from lower ASP due to lower NAND market pricing, offset by $3.1 billion higher volume due to an increase in demand for NAND products. NSG had an operating loss of $1.1 billion, down $1.1 billion from a Q3 YTD 2018 operating profit of $14 million. While we continued to see the ramp at Fab 68 drive cost improvements, the decline in ASP and the absence of $160 million in government grants recognized in Q3 2018 more than offset the improved unit cost, resulting in lower gross margins.
|
| | |
MD&A | Segment Results & Analysis | 30 |
PROGRAMMABLE SOLUTIONS GROUP (PSG)
PSG offers programmable semiconductors, primarily field-programmable gate array (FPGAs) and related products, for a broad range of market segments, including communications, data center, industrial, and military. PSG collaborates with the other Intel businesses to deliver FPGA acceleration in tandem with Intel microprocessors. This "better together" integration broadens the use of FPGAs and combines the benefits of both technologies to allow more flexibility for systems to operate with increased efficiency and higher performance.
|
| | | |
| PSG REVENUE $B | | PSG OPERATING INCOME $B |
|
|
REVENUE AND OPERATING INCOME SUMMARY |
Revenue was $507 million, up $11 million as 5G/wireless grew 64% and advanced products (28nm, 20nm, and 14nm process technologies) grew 26% offset by softness in cloud and enterprise, which was down 12% year over year. Operating income was $92 million, down $14 million.
Revenue was $1.5 billion, down $29 million, driven by a decline in our cloud and enterprise market segment, offset by strength in wireless and advanced products (28nm, 20nm, and 14nm process technologies). Operating income was $233 million, down $71 million.
|
| | |
MD&A | Segment Results & Analysis | 31 |
GAINS (LOSSES) ON EQUITY INVESTMENTS AND INTEREST AND OTHER, NET
|
| | | | | | | | | | | | | | | | |
(In Millions) | | Q3 2019 | | Q3 2018 | | YTD 2019 | | YTD 2018 |
Gains (losses) on equity investments, net | | $ | 318 |
| | $ | (75 | ) | | $ | 922 |
| | $ | 365 |
|
Interest and other, net | | $ | (46 | ) | | $ | (132 | ) | | $ | (170 | ) | | $ | 225 |
|
Gains (losses) on equity investments, net
We recognized a net gain during Q3 2019 of $318 million due to ongoing mark-to-market gains of $114 million, primarily related to Cloudera, Inc. (Cloudera), and observable price adjustments of $84 million. We recognized a net gain during the first nine months of 2019 primarily due to dividends of $515 million from McAfee and ongoing mark-to-market gains from ASML Holdings N.V. (ASML), partially offset by ongoing mark-to-market losses from Cloudera. We have fully sold our equity investment in ASML.
We recognized a net loss during Q3 2018 primarily due to an impairment charge of $290 million from our equity method investment in IM Flash Technologies, LLC (IMFT). We recognized a net gain during the first nine months of 2018 primarily due to ongoing mark-to-market gains of $379 million on our marketable equity securities, primarily related to our interests in ASML and Cloudera, partially offset by the IMFT impairment charge.
Interest and other, net
For the nine months ended September 28, 2019, we paid $1.5 billion to satisfy conversion obligations for $590 million of our $2.0 billion 3.25% junior subordinated convertible debentures due 2039 (2009 debentures) and recognized a loss of $148 million in interest and other, net and $990 million as a reduction in stockholders' equity related to the conversion feature. For the nine months ended September 29, 2018, we paid $1.9 billion to satisfy conversion obligations for $793 million of our 2009 debentures and recognized a loss of $211 million in interest and other, net and $1.3 billion as a reduction in stockholders' equity related to the conversion feature.
We recognized a net gain for the first nine months of 2018 primarily due to a $494 million gain on the divestiture of Wind River in Q2 2018.
PROVISION FOR TAXES
|
| | | | | | | | | | | | | | | | |
(Dollars in Millions) | | Q3 2019 | | Q3 2018 | | YTD 2019 | | YTD 2018 |
Income before taxes | | $ | 6,719 |
| | $ | 7,142 |
| | $ | 15,990 |
| | $ | 17,682 |
|
Provision for taxes | | $ | 729 |
| | $ | 744 |
| | $ | 1,847 |
| | $ | 1,824 |
|
Effective tax rate | | 10.8 | % | | 10.4 | % | | 11.6 | % | | 10.3 | % |
The increase in effective tax rate was primarily driven by one-time benefits that occurred in the first nine months of 2018.
|
| | |
MD&A | Consolidated Results & Analysis | 32 |
LIQUIDITY AND CAPITAL RESOURCES
We consider the following when assessing our liquidity and capital resources:
|
| | | | | | | | |
(Dollars in Millions) | | Sep 28,
2019 | | Dec 29,
2018 |
Cash and cash equivalents, short-term investments, and trading assets | | $ | 12,025 |
| | $ | 11,650 |
|
Other long-term investments | | $ | 3,428 |
| | $ | 3,388 |
|
Loans receivable and other | | $ | 1,693 |
| | $ | 1,550 |
|
Reverse repurchase agreements with original maturities greater than three months | | $ | 350 |
| | $ | 250 |
|
Total debt | | $ | 28,907 |
| | $ | 26,359 |
|
Temporary equity | | $ | 166 |
| | $ | 419 |
|
Debt as percentage of permanent stockholders’ equity | | 38.9 | % | | 35.4 | % |
Cash generated by operations is our primary source of liquidity. We maintain a diverse investment portfolio that we continually analyze based on issuer, industry, and country. When assessing our sources of liquidity, we include investments as shown in the preceding table. Substantially all of our investments in debt instruments and financing receivables are in investment-grade securities.
Other potential sources of liquidity include our commercial paper program and our automatic shelf registration statement on file with the SEC, pursuant to which we may offer an unspecified amount of debt, equity, and other securities. Under our commercial paper program, we have an ongoing authorization from our Board of Directors to borrow up to $10.0 billion. As of September 28, 2019, $1.3 billion of commercial paper remained outstanding.
We believe we have sufficient financial resources to meet our business requirements in the next 12 months, including capital expenditures for worldwide manufacturing and assembly and test; working capital requirements; and potential acquisitions, strategic investments, dividends, and common stock repurchases.
|
| | | | | |
| CASH FROM OPERATIONS $B | | CAPITAL EXPENDITURES $B | | CASH TO STOCKHOLDERS $B |
|
| | | | | | | | |
| | Nine Months Ended |
(In Millions) | | Sep 28,
2019 | | Sep 29,
2018 |
Net cash provided by operating activities | | $ | 23,257 |
| | $ | 22,532 |
|
Net cash used for investing activities | | (9,920 | ) | | (9,419 | ) |
Net cash provided by (used for) financing activities | | (12,421 | ) | | (13,139 | ) |
Net increase (decrease) in cash and cash equivalents | | $ | 916 |
| | $ | (26 | ) |
Operating Activities
Cash provided by operating activities is net income adjusted for certain non-cash items and changes in assets and liabilities.
For the first nine months of 2019 compared to the first nine months of 2018, the $725 million increase in cash provided by operations was primarily attributable to changes in working capital. Cash flow related to working capital was up due to changes in income tax and other asset and liability balances offset by customer utilization of prepaid supply agreement payments and continued inventory build.
|
| | |
MD&A | Consolidated Results & Analysis | 33 |
Investing Activities
Investing cash flows consist primarily of capital expenditures; investment purchases, sales, maturities, and disposals; and proceeds from divestitures and cash used for acquisitions.
Cash used for investing activities was higher in the first nine months of 2019 compared to the first nine months of 2018 primarily due to a lower use of cash from our net trading assets, lower proceeds from divestitures, and increased capital expenditures. The increase was partially offset by a higher source of cash from available-for-sale debt investments, net.
Financing Activities
Financing cash flows consist primarily of repurchases of common stock, payment of dividends to stockholders, issuance and repayment of short-term and long-term debt, and proceeds from the sale of shares of common stock through employee equity incentive plans.
Cash used for financing activities was lower in the first nine months of 2019 compared to the first nine months of 2018 due to collateral received for our fair value hedges associated with our senior notes and lower debt conversions and repayments. The decrease was partially offset by increased repurchases of common stock as well as lower issuance of commercial paper.
QUANTITATIVE AND QUALITATIVE DISCLOSURES ABOUT MARKET RISK
We are affected by changes in currency exchange and interest rates, as well as equity and commodity prices. For discussion about market risk and sensitivity analysis related to changes in currency exchange rates, interest rates, equity prices, and commodity prices refer to "Quantitative and Qualitative Disclosures About Market Risk" within "MD&A," in our Annual Report on Form 10-K for the fiscal year ended December 29, 2018 (2018 Form 10-K).
|
| | |
MD&A | Consolidated Results & Analysis | 34 |
RISK FACTORS
The risks described in "Risk Factors" within "Other Key Information" in our 2018 Form 10-K and our Quarterly Report on Form 10-Q for the quarter ended June 29, 2019 (Q2 2019 Form 10-Q) could materially and adversely affect our business, financial condition, and results of operations, and the trading price of our common stock could decline. These risk factors do not identify all risks that we face—our operations could also be affected by factors that are not presently known to us or that we currently consider to be immaterial to our operations. Due to risks and uncertainties, known and unknown, our past financial results may not be a reliable indicator of future performance and historical trends should not be used to anticipate results or trends in future periods. The Risk Factors section in our 2018 Form 10-K, as updated by our Q2 2019 Form 10-Q, remains current in all material respects.
CONTROLS AND PROCEDURES
Evaluation of Disclosure Controls and Procedures
Based on management’s evaluation (with the participation of our principal executive officer and principal financial officer), as of the end of the period covered by this report, our principal executive officer and principal financial officer have concluded that our disclosure controls and procedures (as defined in Rules 13a-15(e) and 15d-15(e) under the Securities Exchange Act of 1934, as amended (the Exchange Act)), are effective to provide reasonable assurance that information required to be disclosed by us in reports that we file or submit under the Exchange Act is recorded, processed, summarized, and reported within the time periods specified in SEC rules and forms, and is accumulated and communicated to management, including our principal executive officer and principal financial officer, as appropriate, to allow timely decisions regarding required disclosure.
Changes in Internal Control Over Financial Reporting
There were no changes to our internal control over financial reporting (as defined in Rules 13a-15(f) and 15d-15(f) under the Exchange Act) that occurred during the quarter ended September 28, 2019 that have materially affected, or are reasonably likely to materially affect, our internal control over financial reporting.
Inherent Limitations on Effectiveness of Controls
Our management, including the principal executive officer and principal financial officer, does not expect that our disclosure controls and procedures or our internal control over financial reporting will prevent or detect all errors and all fraud. A control system, no matter how well-designed and operated, can provide only reasonable, not absolute, assurance that the control system’s objectives will be met. The design of a control system must reflect the fact that there are resource constraints, and the benefits of controls must be considered relative to their costs. Further, because of the inherent limitations in all control systems, no evaluation of controls can provide absolute assurance that misstatements due to error or fraud will not occur or that all control issues and instances of fraud, if any, have been detected.
NON-GAAP FINANCIAL MEASURES
In addition to disclosing financial results in accordance with GAAP, this document contains references to the non-GAAP financial measures below. We believe these non-GAAP financial measures provide investors with useful supplemental information about the financial performance of our business, enable comparison of financial results between periods where certain items may vary independent of business performance, and allow for greater transparency with respect to key metrics used by management in operating our business and measuring our performance.
Our non-GAAP financial measures reflect adjustments based on one or more of the following items, as well as the related income tax effects where applicable. Income tax effects have been calculated using an appropriate tax rate for each adjustment. These non-GAAP financial measures should not be considered a substitute for, or superior to, financial measures calculated in accordance with GAAP, and the financial results calculated in accordance with GAAP and reconciliations from these results should be carefully evaluated.
Amortization of acquisition-related intangible assets
Amortization of acquisition-related intangible assets consists of amortization of intangible assets such as developed technology, brands, and customer relationships acquired in connection with business combinations. We record charges related to the amortization of these intangibles within both cost of sales and operating expenses in our GAAP financial statements. Amortization charges for our acquisition-related intangible assets are inconsistent in size and are significantly impacted by the timing and valuation of our acquisitions, rather than our core operations. Consequently, our non-GAAP adjustments exclude these charges to facilitate an evaluation of our current operating performance and comparisons to our past operating performance.
|
| | |
OTHER KEY INFORMATION | | 35 |
Restructuring and other charges
Restructuring charges are costs associated with a formal restructuring plan and are primarily related to employee severance and benefit arrangements. Other charges include asset impairments, pension charges, and costs associated with the exit of the 5G smartphone modem business. We exclude restructuring and other charges, including any adjustments to charges recorded in prior periods, for purposes of calculating certain non-GAAP measures. We believe that these costs do not reflect our current operating performance. Consequently, our non-GAAP adjustments exclude these charges to facilitate an evaluation of our current operating performance and comparisons to our past operating performance.
Ongoing mark-to-market on marketable equity securities
We exclude gains and losses resulting from ongoing mark-to-market adjustments of our marketable equity securities, after the initial mark-to-market adjustment is recorded upon a security becoming marketable, when calculating certain non-GAAP measures, as we do not believe this volatility correlates to our core operational performance. Consequently, our non-GAAP earnings per share figures exclude these impacts to facilitate an evaluation of our current operating performance and comparisons to our past operating performance.
Tax Reform adjustment
During 2018, we made adjustments to our U.S. Tax Cuts and Jobs Act (Tax Reform) provisional tax estimates that we recorded in Q4 2017. We exclude these provisional tax adjustments when calculating certain non-GAAP measures. We believe excluding these adjustments facilitates a better evaluation of our current operating performance and comparisons to past operating performance.
Following are the reconciliations of our most comparable GAAP measures to our non-GAAP measures presented: |
| | | | | | | | |
| | Three Months Ended |
(In Millions, Except Per Share Amounts) | | Sep 28,
2019 | | Sep 29,
2018 |
Operating income | | $ | 6,447 |
| | $ | 7,349 |
|
Amortization of acquisition-related intangible assets | | 338 |
| | 326 |
|
Restructuring and other charges | | 104 |
| | (72 | ) |
Non-GAAP operating income | | $ | 6,889 |
| | $ | 7,603 |
|
|
| | | | | | | | |
Earnings per share - diluted | | $ | 1.35 |
| | $ | 1.38 |
|
Amortization of acquisition-related intangible assets | | 0.08 |
| | 0.07 |
|
Restructuring and other charges | | 0.02 |
| | (0.02 | ) |
Ongoing mark-to-market on marketable equity securities | | (0.02 | ) | | — |
|
Tax Reform | | — |
| | (0.02 | ) |
Income tax effect | | (0.01 | ) | | (0.01 | ) |
Non-GAAP earnings per share - diluted | | $ | 1.42 |
| | $ | 1.40 |
|
|
| | |
OTHER KEY INFORMATION | | 36 |
ISSUER PURCHASES OF EQUITY SECURITIES
We have an ongoing authorization, originally approved by our Board of Directors in 2005 and subsequently amended, to repurchase shares of our common stock in open market or negotiated transactions. As of September 28, 2019, we were authorized to repurchase up to $90.0 billion, of which $7.2 billion remained available. Our Board of Directors subsequently approved a $20.0 billion increase in the authorization limit in October 2019.
Common stock repurchase activity under our publicly announced stock repurchase program during the third quarter of 2019 was as follows: |
| | | | | | | | | | | |
Period | | Total Number
of Shares
Purchased
(In Millions) | | Average Price
Paid Per Share | | Dollar Value of
Shares That May
Yet Be Purchased
Under the Program
(In Millions) |
June 30, 2019 - July 27, 2019 | | 22.5 |
| | $ | 49.63 |
| | $ | 10,621 |
|
July 28, 2019 - August 24, 2019 | | 36.8 |
| | $ | 47.36 |
| | $ | 8,877 |
|
August 25, 2019 - September 28, 2019 | | 32.7 |
| | $ | 49.81 |
| | $ | 7,249 |
|
Total | | 92.0 |
| | | | |
We issue Restricted Stock Units (RSUs) as part of our equity incentive plans. In our consolidated condensed financial statements, we treat shares of common stock withheld for tax purposes on behalf of our employees in connection with the vesting of RSUs as common stock repurchases because they reduce the number of shares that would have been issued upon vesting. These withheld shares of common stock are not considered common stock repurchases under our authorized common stock repurchase program and accordingly are not included in the common stock repurchase totals in the preceding table.
|
| | |
OTHER KEY INFORMATION | | 37 |
EXHIBITS
|
| | | | | | | | | | | | |
| | | | Incorporated by Reference | | |
Exhibit Number | | Exhibit Description | | Form | | File Number | | Exhibit | | Filing Date | | Filed or Furnished Herewith |
3.1 | | | | 8-K | | 000-06217 | | 3.1 | | 5/22/2006 | | |
3.2 | | | | 8-K | | 000-06217 | | 3.2 | | 1/17/2019 | | |
4.1 | | | | | | | | | | | | X |
31.1 | | | | | | | | | | | | X |
31.2 | | | | | | | | | | | | X |
32.1 | | | | | | | | | | | | X |
101.INS | | XBRL Instance Document - the instance document does not appear in the Interactive Data File because its XBRL tags are embedded within the Inline XBRL document | | | | | | | | | | X |
101.SCH | | XBRL Taxonomy Extension Schema Document | | | | | | | | | | X |
101.CAL | | XBRL Taxonomy Extension Calculation Linkbase Document | | | | | | | | | | X |
101.DEF | | XBRL Taxonomy Extension Definition Linkbase Document | | | | | | | | | | X |
101.LAB | | XBRL Taxonomy Extension Label Linkbase Document | | | | | | | | | | X |
101.PRE | | XBRL Taxonomy Extension Presentation Linkbase Document | | | | | | | | | | X |
104 | | Cover Page Interactive Data File - formatted in Inline XBRL and included as Exhibit 101 | | | | | | | | | | X |
|
| | |
OTHER KEY INFORMATION | | 38 |
FORM 10-Q CROSS-REFERENCE INDEX
|
| | |
Item Number | Item | |
Part I - Financial Information | |
Item 1. | Financial Statements | |
Item 2. | Management's Discussion and Analysis of Financial Condition and Results of Operations: | |
| Results of operations | |
| Liquidity and capital resources | |
| Off-balance sheet arrangements | (a) |
| Contractual obligations | (b) |
Item 3. | Quantitative and Qualitative Disclosures About Market Risk | |
Item 4. | Controls and Procedures | |
| | |
Part II - Other Information | |
Item 1. | Legal Proceedings | |
Item 1A. | Risk Factors | |
Item 2. | Unregistered Sales of Equity Securities and Use of Proceeds | |
Item 3. | Defaults Upon Senior Securities | Not applicable |
Item 4. | Mine Safety Disclosures | Not applicable |
Item 5. | Other Information | Not applicable |
Item 6. | Exhibits | |
| | |
Signatures | | |
| |
(a) | As of September 28, 2019, we did not have any significant off-balance sheet arrangements, as defined in Item 303(a)(4)(ii) of SEC Regulation S-K. |
| |
(b) | There were no material changes to our significant contractual obligations from those disclosed in our 2018 Form 10-K. |
|
| | |
OTHER KEY INFORMATION | | 39 |
SIGNATURES
Pursuant to the requirements of the Securities Exchange Act of 1934, the registrant has duly caused this report to be signed on its behalf by the undersigned thereunto duly authorized.
|
| | | | | |
| | | INTEL CORPORATION
(Registrant) |
| | | | | |
Date: | October 24, 2019 | | By: | | /s/ GEORGE S. DAVIS |
| | | | | George S. Davis |
| | | | | Executive Vice President, Chief Financial Officer and Principal Financial Officer |
| | | | | |
Date: | October 24, 2019 | | By: | | /s/ KEVIN T. MCBRIDE |
| | | | | Kevin T. McBride |
| | | | | Vice President of Finance, Corporate Controller and Principal Accounting Officer |