INVESTOR MEETING 2010
Exhibit 99.2


Investor Meeting
Stacy J. Smith
Senior Vice President
Chief Financial Officer
May 11, 2010


INVESTOR MEETING 2010
2009/2010 Actions
Drive efficiency and reduce spending as a percent of revenue
Extend our product leadership
Reduce costs by segment
Deliver on capital efficiency and reuse with 32nm


INVESTOR MEETING 2010
Revenue Growth
Margin Growth
Spending Efficiency
New Business Growth
Cash and ROIC


INVESTOR MEETING 2010
Revenue Growth
Margin Growth
Spending Efficiency
New Business Growth
Cash and ROIC


INVESTOR MEETING 2010
Platform Ingredients
Revenue by Product
Source: Intel


INVESTOR MEETING 2010
Revenue Growth Drivers
 Strength of consumer market
 Shift to notebooks / Netbooks
 Emerging markets
 Data center
 Strength of our product portfolio
 across the compute continuum
Source: Intel


INVESTOR MEETING 2010
Revenue Growth Drivers
Forward looking statements specified are preliminary based on current expectations, and are subject to change without notice
Source: Intel
Low Double Digit Revenue Growth for the Next Few Years
 Strength of consumer market
 Shift to notebooks / Netbooks
 Emerging markets
 Data center
 Strength of our product portfolio
 across the compute continuum


INVESTOR MEETING 2010
Revenue Growth
Margin Growth
Spending Efficiency
New Business Growth
Cash and ROIC


INVESTOR MEETING 2010
Fab Capacity Percent Loaded
100%
80%
60%
40%
20%
0%
Forecast
Source: Intel


INVESTOR MEETING 2010
Manufacturing Startup Costs
$
Forecast
Fab 68
0
Source: Intel


INVESTOR MEETING 2010
Inventory Controls
Inventories
Reserves as % of
Gross Inventories
Quarterly 2006 - Q1 2010
Source: Intel


INVESTOR MEETING 2010
Capital Intensity Increases Generation to Generation
Forecast
Source: Intel


INVESTOR MEETING 2010
Capital Savings
Spending Avoided Through Reuse
$B
2009 Investor Meeting data
Current 32nm forecast
Spending avoided ($B) (%)
Source: Intel


INVESTOR MEETING 2010
Manufacturing Efficiency
32nm
100
1000
Gate Pitch (nm)
0.0
0.5
1.0
1.5
2.0
1.0 V, 100 nA I
OFF
45nm
32nm
65nm
90nm
NMOS
PMOS
130nm
Source: Intel
Responsiveness
Efficiency
Velocity
65%
FAB CYCLE TIME
REDUCTION
Days
Q3’06
Q1 ‘10
Week of Ramp
3X
2007
50%
REDUCTION IN
ORDER TO
DELIVERY TIME
Q4’06
Q4’09
32%
NET INVENTORY
REDUCTION
$M
% YES
In 1 Day
Average
Days
2H’08
2H’09
2005
2009
21%
CAGR
16%
CAGR
CPU UNITS PER
TMG CAPEX $
>50%
REDUCTION IN
TIME TO RAMP
Millions
of Die
52
1
90nm
32nm
2002
2010
32nm
90nm
DRIVE
CURRENT
(mA/um)


INVESTOR MEETING 2010
Increasing Capital Efficiency at Wafer Start Peaks
Capital Spending per Wafer Start
$
0
ku
0
Source: Intel
Forecast


INVESTOR MEETING 2010
Capital Intensity
Capital Spending as Percentage of Cost of Sales
Note: stock based compensation expense began in 2006
Source: Intel


INVESTOR MEETING 2010
Capital Intensity
Capital Spending as Percentage of Cost of Sales
Theoretical Without Improvements
Note: stock based compensation expense began in 2006
Source: Intel


INVESTOR MEETING 2010
Capital Intensity
Capital Spending as Percentage of Cost of Sales
Forecast
Theoretical Without Improvements
Note: stock based compensation expense began in 2006
Source: Intel


INVESTOR MEETING 2010
Weighted Average Die Size:
CPU + Chipset
mm2
Forecast
Source: Intel


INVESTOR MEETING 2010
Average Platform Unit Costs
Combined CPU and Chipset
$
1.0x
0.5x
0.75x
Source: Intel


INVESTOR MEETING 2010
Average Platform Unit Costs
Combined CPU and Chipset
 Quarterly
Forecast
$
Source: Intel


INVESTOR MEETING 2010
Average Platform Unit Costs
Combined CPU and Chipset
 Quarterly
Forecast
$
2009 Investor Meeting forecast
Source: Intel


INVESTOR MEETING 2010
Percent of Client Stack
Client = Desktop and Mobile
Forecast
Source: Intel


INVESTOR MEETING 2010
Price and Unit Cost
CPU + Chipset ASPs and Unit Costs
Quarterly 2006-Q1 2010
$
0
ASP
Cost
Source: Intel


INVESTOR MEETING 2010
Price, Unit Cost, and Product Margin
CPU + Chipset ASPs, Unit Costs, and Product Margin%
Quarterly 2006-Q1 2010
$
0
Product Margin %
ASP
Cost
Note: Product margin excludes startup and shutdown costs, excess capacity charges,
inventory write-offs and certain period costs such as non-R&D engineering, portions of mask,
freight, duty, and warehouse costs, royalties, and legal settlements.
Source: Intel


INVESTOR MEETING 2010
Memory Impact to Intel Gross Margin
Figures specified are preliminary based on current expectations and are subject to change without notice
 NOR Business Divested
+ NAND Business Improvements
 2-3pts. GM% improvement ‘08 to ‘10


INVESTOR MEETING 2010
Intel Gross Margin Model
Forecast
Source: Intel


INVESTOR MEETING 2010
Intel Gross Margin Model
Forecast
64% in 2010 represents the midpoint of the 2010 full year outlook range
Forecast range is based on current expectations and is subject to change without notice
Source: Intel
55%-65%
Gross Margin Range
For The Next Few Years


INVESTOR MEETING 2010
Revenue Growth
Margin Growth
Spending Efficiency
New Business Growth
Cash and ROIC


INVESTOR MEETING 2010
Spending* % of Revenue
* MG&A + R&D spending. 2000 through 2005 adjusted to include stock based compensation expense
** Not an Intel forecast. Consensus Revenue of $43.033B from 5/7/2010 and $12.4B for R&D + MG&A (the midpoint of Intel Outlook)
Source: Intel


INVESTOR MEETING 2010
Intel’s Approach to Spending Reduction
Significant Improvements in Underlying Efficiency.
MANUFACTURING:
Maintain world class yields while reducing cash wafer cost
and improving factory responsiveness
R&D
Improve design productivity through modularity and reuse,
resulting in smaller teams and decreased time to market
Increase direct sales resources and
sharpen focus of marketing programs
G&A
Reduce costs and improve productivity


INVESTOR MEETING 2010
Spending* % of Revenue
* MG&A + R&D spending. 2000 through 2005 adjusted to include stock based compensation expense
** Not an Intel forecast. Consensus Revenue of $43.033B from 5/7/2010 and $12.4B for R&D + MG&A (the midpoint of Intel Outlook)
Source: Intel


INVESTOR MEETING 2010
Revenue Growth
Margin Growth
Spending Efficiency
New Business Growth
Cash and ROIC


INVESTOR MEETING 2010
Other Operating Segments Profit Improvement
$M
Forecast
Includes “other Intel architecture operating segments” and “other operating segments”
- Other Intel architecture operating segments includes microprocessors and related chipsets for embedded applications
 and products designed for handheld and consumer electronics market segments
- “Other operating segments” includes the NAND Solutions Group, Wind River Software Group, Software and Services Group,
 and Digital Health Group operating segments that do not meet the quantitative thresholds to qualify as reportable segments
Source: Intel


INVESTOR MEETING 2010
NAND Improvements
 Process technology and cost leadership
  Leadership continues with 25nm
 Aligned supply with demand
 SSDs launched to critical acclaim; ramping
 Result: NAND profitability
Cost/GB
50nm
34nm
$
0
Source: Intel


INVESTOR MEETING 2010
Intel® Atom™ Processor Based Businesses
 
Revenue
> $1B
in 2010
Profit Trend
vs. 2008
Profitable
in 2010
Operating
Margin
Leverage
Netbooks
Yes
Significant
growth
Very
Very High
Embedded*
Yes
Growth
Very
High
Handhelds
No
Flat/Investing
No
High
Consumer
Electronics
No
Flat/Investing
No
High
Total
Yes
Significant
growth
Very
High
 Expecting gross margin
 50%-60%
  Above range today
 High operating margin leverage
* Includes Embedded Intel® Atom™ processor and non-Intel® Atom™ processor based businesses
Forward looking statements are preliminary based on current expectations, and are subject to change without notice
Source: Intel


INVESTOR MEETING 2010
Revenue Growth
Margin Growth
Spending Efficiency
New Business Growth
Cash and ROIC


INVESTOR MEETING 2010
Cash Generation
Cash from Operations
$B
Forecast
* 2010 Annualized figure of cash from operations is Q1 2010 cash from operations multiplied by four
Source: Intel


INVESTOR MEETING 2010
Uses of Cash
Capital Spending, Dividend, and Acquisitions
$B
Forecast
* Based on midpoint of 2010 capital expenditure Outlook
 2010 Annualized figure for dividend is not an Intel forecast but represents the March 2010 dividend multiplied by four
 2010 Annualized figure of cash from operations is Q1 2010 cash from operations multiplied by four
Source: Intel


INVESTOR MEETING 2010
Steadily Increasing Dividend
Dividends per Share
 $3.1 B of dividends paid in 2009
 34% dividend CAGR from 2003
 Dividend Yield = 3.0%*^
$
*2010 Annualized figure for dividend is not an Intel forecast but represents the March 2010 dividend multiplied by four.
^ represents $21.31 Intel stock price close on 5/7/2010
Source: Intel


INVESTOR MEETING 2010
Stock Repurchases and Dilution
Repurchases, Exercises, and
Vesting
Repurchases
 Modulate cash balance by
 returning cash to stockholders
*Shares repurchased under the common stock repurchase program
Source: Intel


INVESTOR MEETING 2010
ROIC Progress Report
Intel
Top 20%
S&P 500
See Appendix B for Intel ROIC reconciliation to GAAP.
* 2010 Annualized figure of ROIC is Q1 2010 ROIC multiplied by four
Source: Intel
Long Term Goal to Rank Among Top ROIC Performers


INVESTOR MEETING 2010
    
Double Earnings CAGR for Next Few Years
* 2003 adjusted to include stock based compensation expense,
** Figures specified are preliminary based on current expectations, and are subject to change without notice
Source: Intel
EPS CAGR
 Increase in revenue CAGR
+ Improvement in capital intensity/cost
+ Spending efficiency
+ New businesses
Targeting low double digit EPS CAGR


INVESTOR MEETING 2010
INTEL CORPORATION
RECONCILIATIONS OF GAAP TO NON-GAAP RESULTS
Appendix A: Share-Based Compensation and Earnings per Share
 In addition to disclosing financial results calculated in accordance with United States (U.S.) generally
 accepted accounting principles (GAAP), this presentation contains non-GAAP financial measures that
 include share-based compensation charges as if we had applied the fair value recognition provisions under
 current GAAP to periods prior to fiscal year 2006, for options granted under the company's equity
 incentive plans and rights to acquire stock granted under the company's stock purchase plan.
 The non-GAAP financial measures disclosed by the company should not be considered a substitute for, or
 superior to, financial measures calculated in accordance with GAAP, and the financial results calculated in
 accordance with GAAP and reconciliations from these results should be carefully evaluated. Management
 believes the non-GAAP financial measures are appropriate for both its own assessment of, and to show
 the reader, how our performance compares to other periods. Set forth below are reconciliations of the
 non-GAAP financial measures to the most directly comparable GAAP financial measures.
Source: Intel


INVESTOR MEETING 2010
INTEL CORPORATION
RECONCILIATIONS OF GAAP TO NON-GAAP RESULTS
Appendix A: Share-Based Compensation and Earnings per Share (Continued)
Source: Intel
(In millions, except per-share amounts)


2000
 
2001
 
2002
 
2003
 
2004
 
2005


GAAP SPENDING (R&D PLUS MG&A)
$

8,986
 
$

8,260
 
$

8,368
 
$

8,638
 
$

9,437
 
$

10,833
 
Adjustment for share-based compensation:
 

937


1,199


1,363


1,182


1,410


1,351
SPENDING INCLUDING SHARE-BASED COMPENSATION
$

9,923
 
$

9,459
 
$

9,731
 
$

9,820
 
$

10,847
 
$

12,184


2003


GAAP DILUTED EARNINGS PER COMMON SHARE
$
0.85


Adjustment for share-based compensation:
 

(0.15)


DILUTED EARNINGS PER COMMON SHARE INCLUDING SHARE-BASED
COMPENSATION CHARGES
$
0.70


INVESTOR MEETING 2010
INTEL CORPORATION
RECONCILIATIONS OF GAAP TO NON-GAAP RESULTS
Appendix B: Historic ROIC
 We define Return on Invested Capital (ROIC) as adjusted net operating profit after taxes
 divided by beginning invested capital.  Management believes that ROIC provides greater
 visibility into how effectively Intel deploys capital.  Management uses ROIC as a high
 level target to help ensure that overall performance is understood and acceptable. ROIC
 is not a measure of financial performance under accounting principles generally accepted
 in the United States (GAAP), and may not be defined and calculated by other companies
 in the same manner as Intel does.  ROIC should not be considered in isolation or as an
 alternative to net income as an indicator of company performance. 
Source: Intel


INVESTOR MEETING 2010
INTEL CORPORATION
RECONCILIATIONS OF GAAP TO NON-GAAP RESULTS
Appendix B: Historic ROIC (Continued)
Source: Intel


INVESTOR MEETING 2010
INTEL CORPORATION
RECONCILIATIONS OF GAAP TO NON-GAAP RESULTS
Appendix B: Historic ROIC (Continued)
Source: Intel


INVESTOR MEETING 2010
The above statements and any others in this document that refer to plans and expectations for the second quarter, the year and the future are forward-looking statements that involve a number of risks
and uncertainties. Many factors could affect Intel’s actual results, and variances from Intel’s current expectations regarding such factors could cause actual results to differ materially from those
expressed in these forward-looking statements. Intel presently considers the following to be the important factors that could cause actual results to differ materially from the corporation’s expectations.
Demand could be different from Intel's expectations due to factors including changes in business and economic conditions; customer acceptance of Intel’s and competitors’ products; changes in customer
order patterns including order cancellations; and changes in the level of inventory at customers. Intel operates in intensely competitive industries that are characterized by a high percentage of costs that
are fixed or difficult to reduce in the short term and product demand that is highly variable and difficult to forecast. Additionally, Intel is in the process of transitioning to its next generation of products on
32nm process technology, and there could be execution issues associated with these changes, including product defects and errata along with lower than anticipated manufacturing yields
. Revenue and
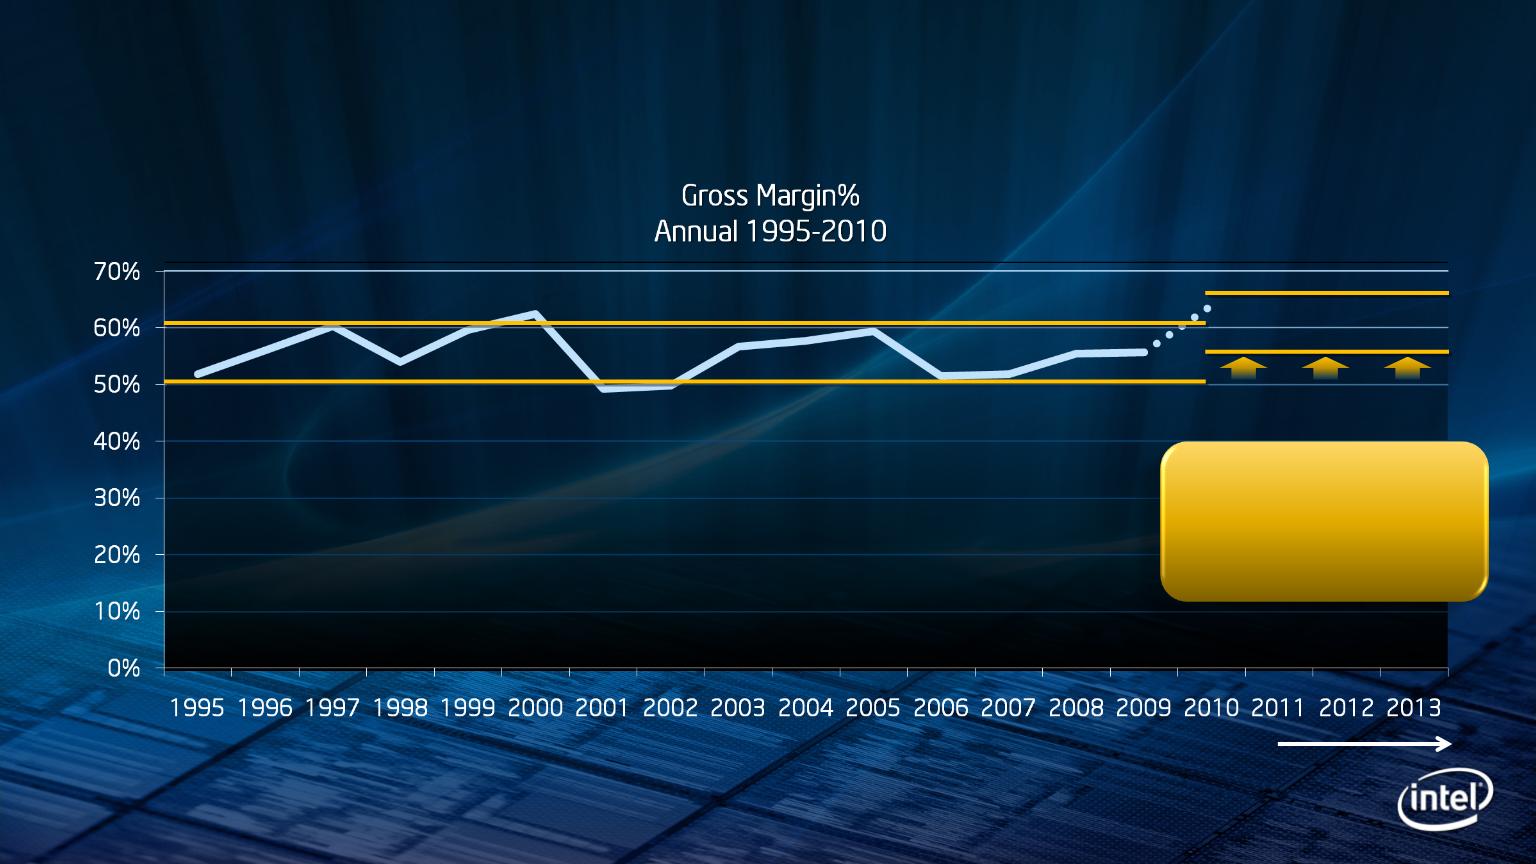
the gross margin percentage are affected by the timing of new Intel product introductions and the demand for and market acceptance of Intel's products; actions taken by Intel's competitors, including
product offerings and introductions, marketing programs and pricing pressures and Intel’s response to such actions; defects or disruptions in the supply of materials or resources; and Intel’s ability to
respond quickly to technological developments and to incorporate new features into its products. The gross margin percentage could vary significantly from expectations based on changes in revenue
levels; product mix and pricing; start-up costs, including costs associated with the new 32nm process technology; variations in inventory valuation, including variations related to the timing of qualifying
products for sale; excess or obsolete inventory; manufacturing yields; changes in unit costs; impairments of long-lived assets, including manufacturing, assembly/test and intangible assets; the timing and
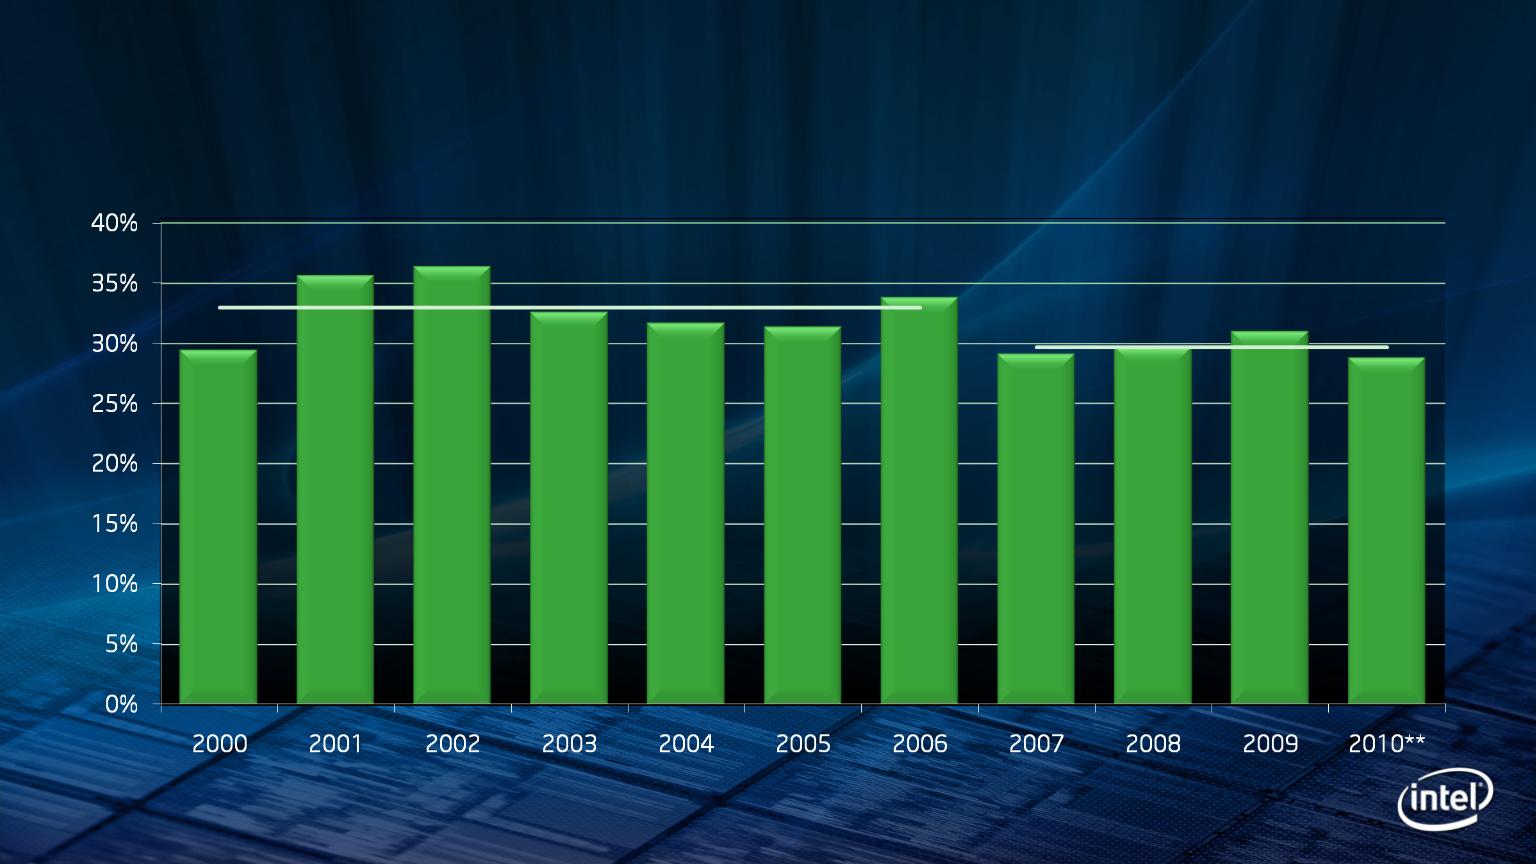
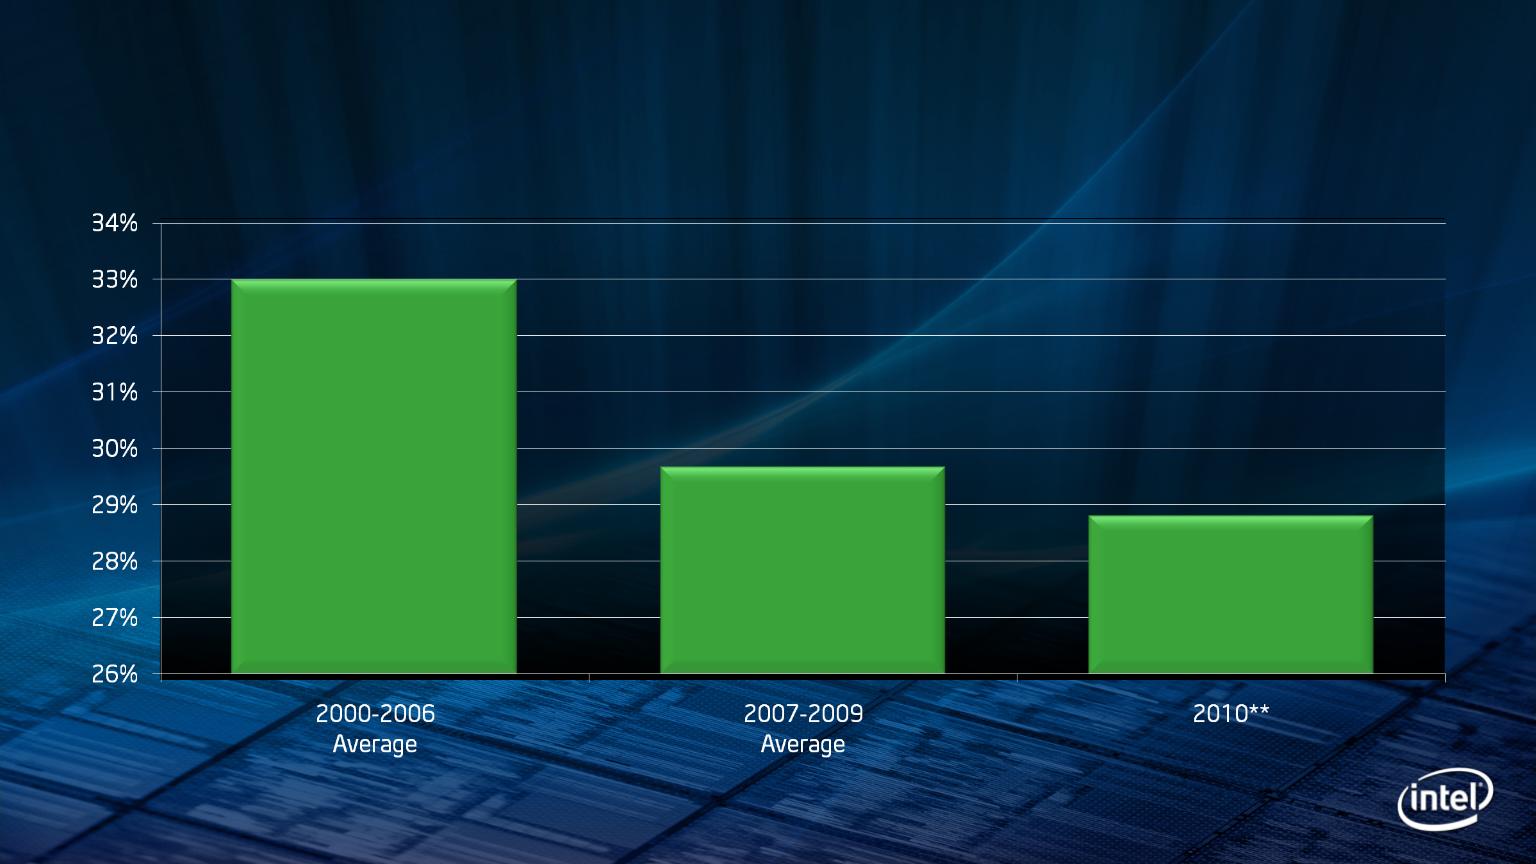
execution of the manufacturing ramp and associated costs; and capacity utilization. Expenses, particularly certain marketing and compensation expenses, as well as restructuring and asset impairment
charges, vary depending on the level of demand for Intel's products and the level of revenue and profits. The tax rate expectation is based on current tax law and current expected income. The tax rate
may be affected by the jurisdictions in which profits are determined to be earned and taxed; changes in the estimates of credits, benefits and deductions; the resolution of issues arising from tax audits
with various tax authorities , including payment of interest and penalties; and the ability to realize deferred tax assets. Gains or losses from equity securities and interest and other could vary from
expectations depending on gains or losses realized on the sale or exchange of securities; gains or losses from equity method investments; impairment charges related to debt securities as well as equity
and other investments; interest rates; cash balances; and changes in fair value of derivative instruments. The majority of our non-marketable equity investment portfolio balance is concentrated in the
flash memory market segment, and declines in this market segment or changes in management’s plans with respect to our investment in this market segment could result in significant impairment
charges, impacting restructuring charges as well as gains /losses on equity investments and interest and other. Intel's results could be impacted by adverse economic, social, political and
physical/infrastructure conditions in countries where Intel, its customers or its suppliers operate, including military conflict and other security risks, natural disasters, infrastructure disruptions, health
concerns and fluctuations in currency exchange rates. Intel’s results could be affected by the timing of closing of acquisitions and divestitures. Intel's results could be affected by adverse effects
associated with product defects and errata (deviations from published specifications), and by litigation or regulatory matters involving intellectual property, stockholder, consumer, antitrust and other
issues, such as the litigation and regulatory matters described in Intel's SEC reports. An unfavorable ruling could include monetary damages or an injunction prohibiting us from manufacturing or selling
one or more products, precluding particular business practices, impacting our ability to design our products, or requiring other remedies such as compulsory licensing of intellectual property. A detailed
discussion of these and other factors that could affect Intel’s results is included in Intel’s SEC filings, including the report on Form 10-Q for the quarter ended March 27, 2010.
Risk Factors