
INVESTOR MEETING 2012
Exhibit 99.1


|
($m)
|
2002
|
2003
|
2004
|
2005
|
2006
|
|
Net income (GAAP)
|
$ 3,117
|
$ 5,641
|
$ 7,516
|
$ 8,664
|
$ 5,044
|
|
Interest expense
|
84
|
62
|
50
|
19
|
24
|
|
Income tax adjustment (1)
|
(22)
|
(15)
|
(14)
|
(6)
|
(7)
|
|
Adjusted net operating profit after taxes
|
$ 3,179
|
$ 5,688
|
$ 7,552
|
$ 8,677
|
$ 5,061
|
|
|
|
|
|
|
|
|
|
2001
|
2002
|
2003
|
2004
|
2005
|
|
Total assets (GAAP) (2)
|
$ 44,395
|
$ 44,224
|
$ 47,143
|
$ 48,143
|
$ 48,309
|
|
Current liabilities
|
(6,570)
|
(6,595)
|
(6,879)
|
(8,006)
|
(9,234)
|
|
Invested capital
|
$ 37,825
|
$ 37,629
|
$ 40,264
|
$ 40,137
|
$ 39,075
|
|
|
|
|
|
|
|
|
|
2002
|
2003
|
2004
|
2005
|
2006
|
|
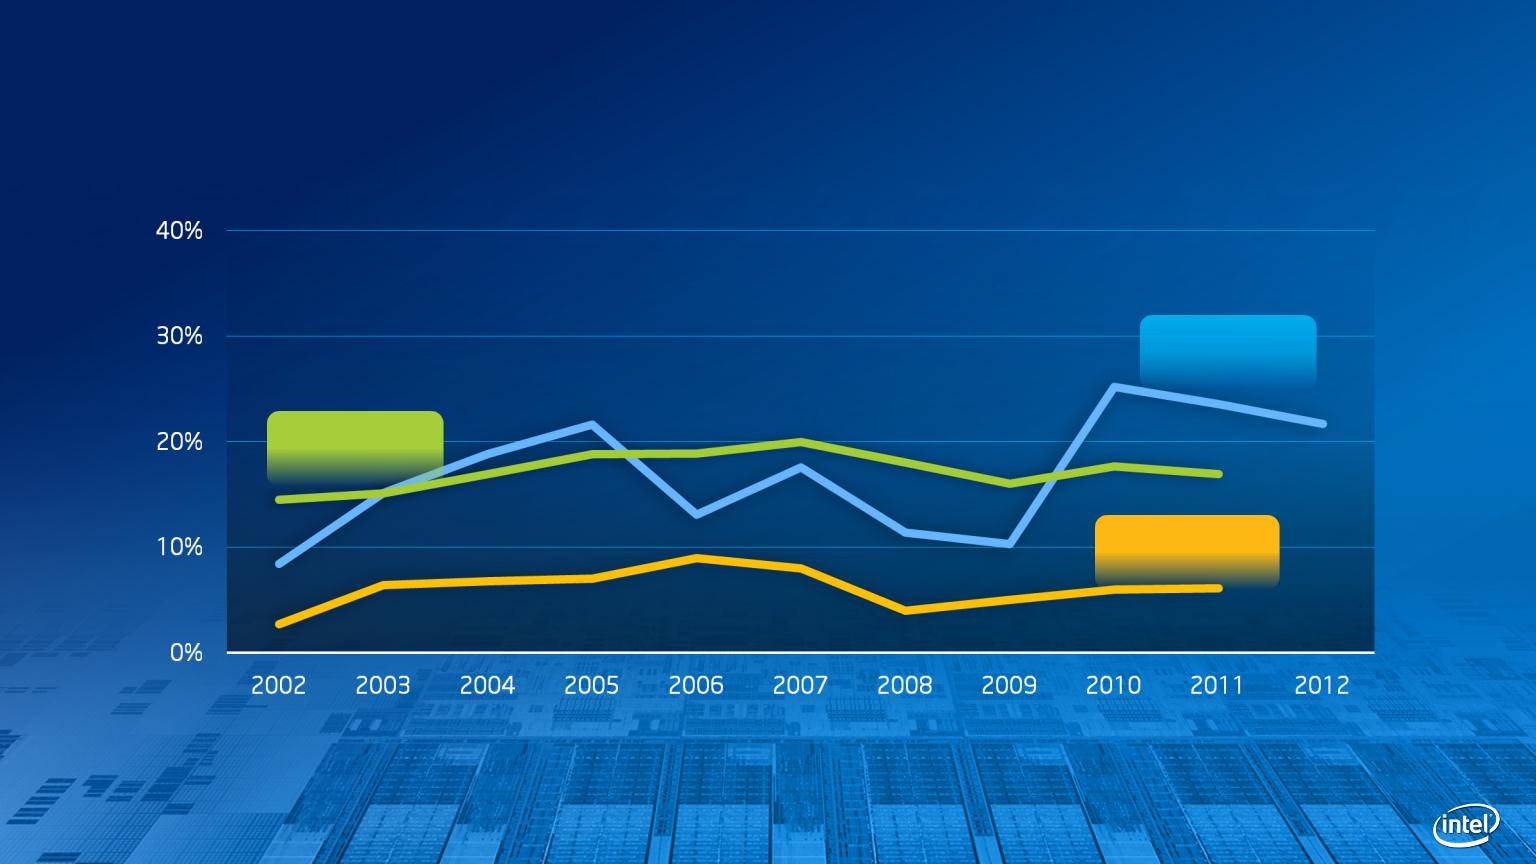
Return on invested capital (Adjusted net operating
profit after taxes / prior year end invested capital) |
8.4%
|
15.1%
|
18.8%
|
21.6%
|
13.0%
|
|
|
|
|
|
|
|
|
Net income/ prior year end total assets
|
7.0%
|
12.8%
|
15.9%
|
18.0%
|
10.4%
|
|
|
|
|
|
|
|
|
(1) Assumed tax effect of interest expense based on the
effective tax rate |
|
|
|
|
|
|
|
|
|
|
|
|
|
(2) 2005-2008 Total assets has been adjusted due to
changes to the accounting for convertible debt instruments |
|
|
|
|
|

|
($m)
|
2007
|
2008
|
2009
|
2010
|
2011
|
|
|
Net income (GAAP)
|
$ 6,976
|
$ 5,292
|
$ 4,369
|
$ 11,464
|
$ 12,942
|
|
|
Interest expense
|
15
|
8
|
1
|
0
|
41
|
|
|
Income tax adjustment (1)
|
(4)
|
(2)
|
(0)
|
0
|
(11)
|
|
|
Adjusted net operating profit after taxes
|
$ 6,987
|
$ 5,298
|
$ 4,370
|
$ 11,464
|
$ 12,972
|
|
|
|
|
|
|
|
|
|
|
|
2006
|
2007
|
2008
|
2009
|
2010
|
|
|
Total assets (GAAP) (2)
|
$ 48,372
|
$ 55,664
|
$ 50,472
|
$ 53,095
|
$ 63,186
|
|
|
Current liabilities
|
(8,514)
|
(8,571)
|
(7,818)
|
(7,591)
|
(9,327)
|
|
|
Invested capital
|
$ 39,858
|
$ 47,093
|
$ 42,654
|
$ 45,504
|
$ 53,859
|
|
|
|
|
|
|
|
|
|
|
|
2007
|
2008
|
2009
|
2010
|
2011
|
10 YR AVG
|
|
Return on invested capital (Adjusted net
operating profit after taxes / prior year end invested capital) |
17.5%
|
11.3%
|
10.2%
|
25.2%
|
24.1%
|
16.5%
|
|
|
|
|
|
|
|
|
|
Net income/ prior year end total assets
|
14.4%
|
9.5%
|
8.7%
|
21.6%
|
20.5%
|
13.9%
|
|
|
|
|
|
|
|
|
|
(1) Assumed tax effect of interest expense based
on the effective tax rate |
|
|
|
|
|
|
|
|
|
|
|
|
|
|
|
(2) 2005-2008 Total assets has been adjusted due
to changes to the accounting for convertible debt instruments |
|
|
|
|
|
|

|
($m)
|
|
2012 Forecast
|
|
|
Consensus net income (1)
|
|
$ 12,696
|
|
|
Annualized interest expense (2)
|
|
124
|
|
|
Income tax adjustment (3)
|
|
(35)
|
|
|
Adjusted net operating profit after taxes
|
|
$ 12,785
|
|
|
|
|
|
|
|
|
|
2011
|
|
|
Total assets (GAAP)
|
|
$ 71,119
|
|
|
Current liabilities
|
|
(12,028)
|
|
|
Invested capital
|
|
$ 59,091
|
|
|
|
|
|
|
|
|
|
2012 Forecast
|
|
|
Return on invested capital (Adjusted net operating profit after taxes / prior year end invested capital)
|
|
21.6%
|
|
