000005086312-2610-KDecember 26, 20202020FYfalsefalse4,063244.50.0010.0015050——0.0010.00110,00010,0004,0624,2904,0624,2901.32001.261.20five0.080.351.852.451.703.302.353.104.002.704.102.882.703.702.603.152.454.004.804.254.904.104.104.103.733.252.702.405.005.003.25no———P3Y00000508632019-12-292020-12-26iso4217:USD00000508632020-06-26xbrli:shares00000508632021-01-150000050863intc:MoovitMember2020-05-042020-05-0400000508632018-12-302019-12-2800000508632017-12-312018-12-29iso4217:USDxbrli:shares00000508632020-12-2600000508632019-12-2800000508632018-12-2900000508632017-12-300000050863us-gaap:CommonStockIncludingAdditionalPaidInCapitalMember2017-12-300000050863us-gaap:AccumulatedOtherComprehensiveIncomeMember2017-12-300000050863us-gaap:RetainedEarningsMember2017-12-300000050863us-gaap:RetainedEarningsMember2017-12-312018-12-290000050863us-gaap:AccumulatedOtherComprehensiveIncomeMember2017-12-312018-12-290000050863us-gaap:CommonStockIncludingAdditionalPaidInCapitalMember2017-12-312018-12-290000050863us-gaap:CommonStockIncludingAdditionalPaidInCapitalMember2018-12-290000050863us-gaap:AccumulatedOtherComprehensiveIncomeMember2018-12-290000050863us-gaap:RetainedEarningsMember2018-12-290000050863us-gaap:RetainedEarningsMember2018-12-302019-12-280000050863us-gaap:AccumulatedOtherComprehensiveIncomeMember2018-12-302019-12-280000050863us-gaap:CommonStockIncludingAdditionalPaidInCapitalMember2018-12-302019-12-280000050863us-gaap:CommonStockIncludingAdditionalPaidInCapitalMember2019-12-280000050863us-gaap:AccumulatedOtherComprehensiveIncomeMember2019-12-280000050863us-gaap:RetainedEarningsMember2019-12-280000050863us-gaap:RetainedEarningsMember2019-12-292020-12-260000050863us-gaap:AccumulatedOtherComprehensiveIncomeMember2019-12-292020-12-260000050863us-gaap:CommonStockIncludingAdditionalPaidInCapitalMember2019-12-292020-12-260000050863us-gaap:CommonStockIncludingAdditionalPaidInCapitalMember2020-12-260000050863us-gaap:AccumulatedOtherComprehensiveIncomeMember2020-12-260000050863us-gaap:RetainedEarningsMember2020-12-260000050863intc:MobileyeN.V.Member2020-12-260000050863srt:MaximumMember2019-12-292020-12-260000050863us-gaap:CreditConcentrationRiskMember2019-12-292020-12-26xbrli:pure0000050863us-gaap:CreditConcentrationRiskMemberus-gaap:AccountsReceivableMember2019-12-292020-12-260000050863intc:DCGPlatformMember2019-12-292020-12-260000050863intc:DCGPlatformMember2018-12-302019-12-280000050863intc:DCGPlatformMember2017-12-312018-12-290000050863intc:DataCenterGroupMemberintc:OtherProductOrServiceMember2019-12-292020-12-260000050863intc:DataCenterGroupMemberintc:OtherProductOrServiceMember2018-12-302019-12-280000050863intc:DataCenterGroupMemberintc:OtherProductOrServiceMember2017-12-312018-12-290000050863intc:DataCenterGroupMember2019-12-292020-12-260000050863intc:DataCenterGroupMember2018-12-302019-12-280000050863intc:DataCenterGroupMember2017-12-312018-12-290000050863intc:InternetOfThingsGroupMember2019-12-292020-12-260000050863intc:PlatformMemberintc:InternetOfThingsGroupMember2018-12-302019-12-280000050863intc:PlatformMemberintc:InternetOfThingsGroupMember2017-12-312018-12-290000050863intc:MobileyeMember2019-12-292020-12-260000050863intc:InternetOfThingsGroupMemberintc:OtherProductOrServiceMember2018-12-302019-12-280000050863intc:InternetOfThingsGroupMemberintc:OtherProductOrServiceMember2017-12-312018-12-290000050863intc:InternetofThingsMember2019-12-292020-12-260000050863intc:InternetofThingsMemberintc:InternetOfThingsGroupMember2018-12-302019-12-280000050863intc:InternetofThingsMemberintc:InternetOfThingsGroupMember2017-12-312018-12-290000050863intc:NonVolatileMemorySolutionsGroupMember2019-12-292020-12-260000050863intc:NonVolatileMemorySolutionsGroupMember2018-12-302019-12-280000050863intc:NonVolatileMemorySolutionsGroupMember2017-12-312018-12-290000050863intc:ProgrammableSolutionsGroupMember2019-12-292020-12-260000050863intc:ProgrammableSolutionsGroupMember2018-12-302019-12-280000050863intc:ProgrammableSolutionsGroupMember2017-12-312018-12-290000050863intc:PlatformMemberintc:ClientComputingGroupMember2019-12-292020-12-260000050863intc:PlatformMemberintc:ClientComputingGroupMember2018-12-302019-12-280000050863intc:PlatformMemberintc:ClientComputingGroupMember2017-12-312018-12-290000050863intc:OtherProductOrServiceMemberintc:ClientComputingGroupMember2019-12-292020-12-260000050863intc:OtherProductOrServiceMemberintc:ClientComputingGroupMember2018-12-302019-12-280000050863intc:OtherProductOrServiceMemberintc:ClientComputingGroupMember2017-12-312018-12-290000050863intc:ClientComputingGroupMember2019-12-292020-12-260000050863intc:ClientComputingGroupMember2018-12-302019-12-280000050863intc:ClientComputingGroupMember2017-12-312018-12-290000050863us-gaap:AllOtherSegmentsMember2019-12-292020-12-260000050863us-gaap:AllOtherSegmentsMember2018-12-302019-12-280000050863us-gaap:AllOtherSegmentsMember2017-12-312018-12-290000050863intc:InternetOfThingsGroupMember2018-12-302019-12-280000050863intc:InternetOfThingsGroupMember2017-12-312018-12-290000050863intc:MobileyeMember2018-12-302019-12-280000050863intc:MobileyeMember2017-12-312018-12-290000050863intc:InternetofThingsMember2018-12-302019-12-280000050863intc:InternetofThingsMember2017-12-312018-12-290000050863intc:IOTGPlatformMember2019-12-292020-12-260000050863intc:IOTGPlatformMember2018-12-302019-12-280000050863intc:IOTGPlatformMember2017-12-312018-12-290000050863intc:CCGDesktopPlatformMember2019-12-292020-12-260000050863intc:CCGDesktopPlatformMember2018-12-302019-12-280000050863intc:CCGDesktopPlatformMember2017-12-312018-12-290000050863intc:CCGNotebookPlatformMember2019-12-292020-12-260000050863intc:CCGNotebookPlatformMember2018-12-302019-12-280000050863intc:CCGNotebookPlatformMember2017-12-312018-12-290000050863intc:OtherPlatformMember2019-12-292020-12-260000050863intc:OtherPlatformMember2018-12-302019-12-280000050863intc:OtherPlatformMember2017-12-312018-12-290000050863intc:PlatformMember2019-12-292020-12-260000050863intc:PlatformMember2018-12-302019-12-280000050863intc:PlatformMember2017-12-312018-12-290000050863intc:OtherProductOrServiceMember2019-12-292020-12-260000050863intc:OtherProductOrServiceMember2018-12-302019-12-280000050863intc:OtherProductOrServiceMember2017-12-312018-12-290000050863us-gaap:CustomerConcentrationRiskMemberus-gaap:SalesRevenueNetMember2019-12-292020-12-260000050863us-gaap:CustomerConcentrationRiskMemberus-gaap:SalesRevenueNetMember2018-12-302019-12-280000050863us-gaap:CustomerConcentrationRiskMemberus-gaap:SalesRevenueNetMember2017-12-312018-12-290000050863intc:DellIncMemberus-gaap:CustomerConcentrationRiskMemberus-gaap:SalesRevenueNetMember2019-12-292020-12-260000050863intc:DellIncMemberus-gaap:CustomerConcentrationRiskMemberus-gaap:SalesRevenueNetMember2018-12-302019-12-280000050863intc:DellIncMemberus-gaap:CustomerConcentrationRiskMemberus-gaap:SalesRevenueNetMember2017-12-312018-12-290000050863us-gaap:CustomerConcentrationRiskMemberus-gaap:SalesRevenueNetMemberintc:LenovoGroupLimitedMember2019-12-292020-12-260000050863us-gaap:CustomerConcentrationRiskMemberus-gaap:SalesRevenueNetMemberintc:LenovoGroupLimitedMember2018-12-302019-12-280000050863us-gaap:CustomerConcentrationRiskMemberus-gaap:SalesRevenueNetMemberintc:LenovoGroupLimitedMember2017-12-312018-12-290000050863intc:HPInc.Memberus-gaap:CustomerConcentrationRiskMemberus-gaap:SalesRevenueNetMember2019-12-292020-12-260000050863intc:HPInc.Memberus-gaap:CustomerConcentrationRiskMemberus-gaap:SalesRevenueNetMember2018-12-302019-12-280000050863intc:HPInc.Memberus-gaap:CustomerConcentrationRiskMemberus-gaap:SalesRevenueNetMember2017-12-312018-12-290000050863us-gaap:CreditConcentrationRiskMemberus-gaap:AccountsReceivableMember2018-12-302019-12-280000050863intc:ChinaIncludingHongKongMember2019-12-292020-12-260000050863intc:ChinaIncludingHongKongMember2018-12-302019-12-280000050863intc:ChinaIncludingHongKongMember2017-12-312018-12-290000050863country:SG2019-12-292020-12-260000050863country:SG2018-12-302019-12-280000050863country:SG2017-12-312018-12-290000050863country:US2019-12-292020-12-260000050863country:US2018-12-302019-12-280000050863country:US2017-12-312018-12-290000050863country:TW2019-12-292020-12-260000050863country:TW2018-12-302019-12-280000050863country:TW2017-12-312018-12-290000050863intc:OtherCountriesMember2019-12-292020-12-260000050863intc:OtherCountriesMember2018-12-302019-12-280000050863intc:OtherCountriesMember2017-12-312018-12-290000050863intc:PrepaidSupplyAgreementsMember2020-12-260000050863intc:PrepaidSupplyAgreementsMember2019-12-280000050863intc:SoftwareServicesandOtherMember2020-12-260000050863intc:SoftwareServicesandOtherMember2019-12-280000050863intc:PrepaidSupplyAgreementsMember2019-12-292020-12-2600000508632020-06-270000050863us-gaap:LandAndBuildingMember2020-12-260000050863us-gaap:LandAndBuildingMember2019-12-280000050863us-gaap:MachineryAndEquipmentMember2020-12-260000050863us-gaap:MachineryAndEquipmentMember2019-12-280000050863us-gaap:ConstructionInProgressMember2020-12-260000050863us-gaap:ConstructionInProgressMember2019-12-280000050863srt:MinimumMemberus-gaap:MachineryAndEquipmentMember2019-12-292020-12-260000050863srt:MaximumMemberus-gaap:MachineryAndEquipmentMember2019-12-292020-12-260000050863us-gaap:BuildingMembersrt:MinimumMember2019-12-292020-12-260000050863us-gaap:BuildingMembersrt:MaximumMember2019-12-292020-12-260000050863country:US2020-12-260000050863country:US2019-12-280000050863country:IL2020-12-260000050863country:IL2019-12-280000050863country:CN2020-12-260000050863country:CN2019-12-280000050863country:IE2020-12-260000050863country:IE2019-12-280000050863intc:OtherCountriesMember2020-12-260000050863intc:OtherCountriesMember2019-12-2800000508632020-08-012020-08-3100000508632020-12-012020-12-2600000508632020-08-012020-12-260000050863intc:A2020RestructuringProgramMember2019-12-292020-12-260000050863intc:A2020RestructuringProgramMember2018-12-302019-12-280000050863intc:A2020RestructuringProgramMember2017-12-312018-12-290000050863intc:A2019RestructuringProgramMember2019-12-292020-12-260000050863intc:A2019RestructuringProgramMember2018-12-302019-12-280000050863intc:A2019RestructuringProgramMember2017-12-312018-12-290000050863intc:RestructuringProgramThreeMember2019-12-292020-12-260000050863intc:RestructuringProgramThreeMember2018-12-302019-12-280000050863intc:RestructuringProgramThreeMember2017-12-312018-12-290000050863srt:MinimumMember2019-12-292020-12-260000050863us-gaap:ValuationAllowanceOfDeferredTaxAssetsMember2019-12-280000050863us-gaap:ValuationAllowanceOfDeferredTaxAssetsMember2019-12-292020-12-260000050863us-gaap:ValuationAllowanceOfDeferredTaxAssetsMember2020-12-260000050863us-gaap:ValuationAllowanceOfDeferredTaxAssetsMember2018-12-290000050863us-gaap:ValuationAllowanceOfDeferredTaxAssetsMember2018-12-302019-12-280000050863us-gaap:ValuationAllowanceOfDeferredTaxAssetsMember2017-12-300000050863us-gaap:ValuationAllowanceOfDeferredTaxAssetsMember2017-12-312018-12-290000050863us-gaap:DomesticCountryMember2020-12-260000050863us-gaap:ForeignCountryMember2020-12-260000050863us-gaap:DebtSecuritiesMember2019-12-292020-12-260000050863us-gaap:DebtSecuritiesMember2018-12-302019-12-280000050863us-gaap:DebtSecuritiesMember2017-12-312018-12-290000050863us-gaap:AvailableforsaleSecuritiesMember2019-12-292020-12-260000050863us-gaap:CostmethodInvestmentsMember2019-12-292020-12-260000050863us-gaap:CostmethodInvestmentsMember2018-12-302019-12-280000050863us-gaap:CostmethodInvestmentsMember2017-12-312018-12-290000050863intc:ClouderaIncMember2019-12-280000050863intc:ASMLHoldingN.V.Member2020-12-260000050863intc:ImFlashTechnologiesLlcMember2020-12-260000050863intc:ImFlashTechnologiesLlcMember2019-03-312019-06-290000050863intc:ImFlashTechnologiesLlcMember2019-12-292020-12-260000050863intc:ImFlashTechnologiesLlcMember2020-09-272020-12-260000050863intc:McAfeeMember2020-12-260000050863intc:McAfeeMember2019-12-292020-12-260000050863intc:McAfeeMember2018-12-302019-12-28intc:Acquisition0000050863us-gaap:SeriesOfIndividuallyImmaterialBusinessAcquisitionsMember2019-12-292020-12-260000050863us-gaap:SeriesOfIndividuallyImmaterialBusinessAcquisitionsMember2018-12-302019-12-280000050863intc:MoovitMember2020-05-040000050863intc:HabanaLabsMember2019-12-122019-12-120000050863intc:HabanaLabsMember2019-12-190000050863intc:NANDMemoryBusinessMember2020-10-192020-10-190000050863intc:NANDMemoryBusinessMember2021-11-012021-11-010000050863intc:NANDMemoryBusinessMembersrt:ScenarioForecastMember2025-03-012025-03-310000050863us-gaap:DiscontinuedOperationsHeldforsaleMemberintc:NANDMemoryBusinessMember2020-12-260000050863srt:ScenarioForecastMember2020-12-272021-11-0100000508632020-07-312020-07-310000050863intc:SmartphoneModemBusinessMember2019-12-292020-12-260000050863intc:WindRiverSystemsInc.Member2018-12-302019-12-280000050863intc:DataCenterGroupMember2019-12-280000050863intc:DataCenterGroupMember2020-12-260000050863intc:InternetOfThingsGroupMember2019-12-280000050863intc:InternetOfThingsGroupMember2020-12-260000050863intc:MobileyeMember2019-12-280000050863intc:MobileyeMember2020-12-260000050863intc:ProgrammableSolutionsGroupMember2019-12-280000050863intc:ProgrammableSolutionsGroupMember2020-12-260000050863intc:ClientComputingGroupMember2019-12-280000050863intc:ClientComputingGroupMember2020-12-260000050863us-gaap:AllOtherSegmentsMember2019-12-280000050863us-gaap:AllOtherSegmentsMember2020-12-260000050863intc:DataCenterGroupMember2018-12-290000050863intc:InternetOfThingsGroupMember2018-12-290000050863intc:MobileyeMember2018-12-290000050863intc:ProgrammableSolutionsGroupMember2018-12-290000050863intc:ClientComputingGroupMember2018-12-290000050863us-gaap:AllOtherSegmentsMember2018-12-290000050863us-gaap:DevelopedTechnologyRightsMember2020-12-260000050863us-gaap:DevelopedTechnologyRightsMember2019-12-280000050863us-gaap:CustomerRelationshipsMember2020-12-260000050863us-gaap:CustomerRelationshipsMember2019-12-280000050863intc:LicensedTechnologyAndPatentsMember2020-12-260000050863intc:LicensedTechnologyAndPatentsMember2019-12-280000050863us-gaap:InProcessResearchAndDevelopmentMember2020-12-260000050863us-gaap:InProcessResearchAndDevelopmentMember2019-12-280000050863us-gaap:OtherIntangibleAssetsMember2020-12-260000050863us-gaap:OtherIntangibleAssetsMember2019-12-280000050863us-gaap:DevelopedTechnologyRightsMember2019-12-292020-12-260000050863us-gaap:DevelopedTechnologyRightsMember2018-12-302019-12-280000050863us-gaap:DevelopedTechnologyRightsMember2017-12-312018-12-290000050863us-gaap:CustomerRelationshipsMember2019-12-292020-12-260000050863us-gaap:CustomerRelationshipsMember2018-12-302019-12-280000050863us-gaap:CustomerRelationshipsMember2017-12-312018-12-290000050863intc:LicensedTechnologyAndPatentsMember2019-12-292020-12-260000050863intc:LicensedTechnologyAndPatentsMember2018-12-302019-12-280000050863intc:LicensedTechnologyAndPatentsMember2017-12-312018-12-290000050863us-gaap:CommercialPaperMember2020-12-260000050863intc:DebtInstrumentThirtyEightMember2020-12-260000050863intc:DebtInstrumentThirtyEightMember2019-12-280000050863intc:DebtInstrumentFortyMember2020-12-260000050863intc:DebtInstrumentFortyMember2019-12-280000050863intc:DebtinstrumentThirtySevenMember2020-12-260000050863intc:DebtinstrumentThirtySevenMember2019-12-280000050863intc:DebtInstrumentFourteenMember2020-12-260000050863intc:DebtInstrumentFourteenMember2019-12-280000050863intc:DebtInstrumentThirtyOneMember2020-12-260000050863intc:DebtInstrumentThirtyOneMember2019-12-280000050863intc:DebtInstrumentSevenMember2020-12-260000050863intc:DebtInstrumentSevenMember2019-12-280000050863intc:DebtInstrumentThirtyNineMember2020-12-260000050863intc:DebtInstrumentThirtyNineMember2019-12-280000050863intc:DebtInstrumentFifteenMember2020-12-260000050863intc:DebtInstrumentFifteenMember2019-12-280000050863intc:DebtInstrumentTwentyThreeMember2020-12-260000050863intc:DebtInstrumentTwentyThreeMember2019-12-280000050863intc:DebtInstrumentTenMember2020-12-260000050863intc:DebtInstrumentTenMember2019-12-280000050863intc:DebtInstrumentTwentyNineMember2020-12-260000050863intc:DebtInstrumentTwentyNineMember2019-12-280000050863intc:DebtInstrumentFortyOneMember2020-12-260000050863intc:DebtInstrumentFortyOneMember2019-12-280000050863intc:DebtInstrumentFortyFourMember2020-12-260000050863intc:DebtInstrumentFortyFourMember2019-12-280000050863intc:FixedRateSeniorNotes340DueMarch2025Member2020-12-260000050863intc:FixedRateSeniorNotes340DueMarch2025Member2019-12-280000050863intc:DebtInstrumentSixteenMember2020-12-260000050863intc:DebtInstrumentSixteenMember2019-12-280000050863intc:DebtInstrumentThirtyTwoMember2020-12-260000050863intc:DebtInstrumentThirtyTwoMember2019-12-280000050863intc:FixedRateSeniorNotes375DueMarch2027Member2020-12-260000050863intc:FixedRateSeniorNotes375DueMarch2027Member2019-12-280000050863intc:DebtInstrumentFortyTwoMember2020-12-260000050863intc:DebtInstrumentFortyTwoMember2019-12-280000050863intc:A2019SeniorNotesdueDecember2029at2.45Member2020-12-260000050863intc:A2019SeniorNotesdueDecember2029at2.45Member2019-12-280000050863intc:FixedRateSeniorNotes390DueMarch2030Member2020-12-260000050863intc:FixedRateSeniorNotes390DueMarch2030Member2019-12-280000050863intc:DebtInstrumentElevenMember2020-12-260000050863intc:DebtInstrumentElevenMember2019-12-280000050863intc:FixedRateSeniorNotes460DueMarch2040Member2020-12-260000050863intc:FixedRateSeniorNotes460DueMarch2040Member2019-12-280000050863intc:DebtInstrumentEightMember2020-12-260000050863intc:DebtInstrumentEightMember2019-12-280000050863intc:DebtInstrumentTwelveMember2020-12-260000050863intc:DebtInstrumentTwelveMember2019-12-280000050863intc:DebtInstrumentSeventeenMember2020-12-260000050863intc:DebtInstrumentSeventeenMember2019-12-280000050863intc:DebtInstrumentThirtyThreeMember2020-12-260000050863intc:DebtInstrumentThirtyThreeMember2019-12-280000050863intc:DebtInstrumentFortyThreeMember2020-12-260000050863intc:DebtInstrumentFortyThreeMember2019-12-280000050863intc:A6404.10SeniorNotesdueAugust2047Member2020-12-260000050863intc:A6404.10SeniorNotesdueAugust2047Member2019-12-280000050863intc:A2017SeniornotesdueDecember2047at3.73Member2020-12-260000050863intc:A2017SeniornotesdueDecember2047at3.73Member2019-12-280000050863intc:A2019SeniorNotesdueDecember2049at3.25Member2020-12-260000050863intc:A2019SeniorNotesdueDecember2049at3.25Member2019-12-280000050863intc:FixedRateSeniorNotes475DueMarch2050Member2020-12-260000050863intc:FixedRateSeniorNotes475DueMarch2050Member2019-12-280000050863intc:FixedRateSeniorNotes310DueFebruary2060Member2020-12-260000050863intc:FixedRateSeniorNotes310DueFebruary2060Member2019-12-280000050863intc:FixedRateSeniorNotes495DueMarch2060Member2020-12-260000050863intc:FixedRateSeniorNotes495DueMarch2060Member2019-12-280000050863intc:OregonandArizonaBondsMember2020-12-260000050863intc:OregonandArizonaBondsMember2019-12-280000050863intc:StateofOregonBusinessDevelopmentCommissionMember2020-12-260000050863intc:StateofOregonBusinessDevelopmentCommissionMember2019-12-280000050863intc:IndustrialAuthorityoftheCityofChandlerArizonaMember2020-12-260000050863intc:IndustrialAuthorityoftheCityofChandlerArizonaMember2019-12-280000050863intc:DebtInstrumentFourMember2020-12-260000050863intc:DebtInstrumentFourMember2019-12-280000050863us-gaap:InterestRateSwapMemberus-gaap:LongTermDebtMemberus-gaap:FairValueHedgingMember2019-12-292020-12-260000050863us-gaap:InterestRateSwapMemberus-gaap:LongTermDebtMemberus-gaap:FairValueHedgingMember2018-12-302019-12-280000050863us-gaap:CrossCurrencyInterestRateContractMemberintc:A2015AUDdenominatedSeniorNotesMember2020-12-260000050863us-gaap:SeniorNotesMember2020-12-260000050863intc:SeniorNotes185DueMay2020Member2019-12-292020-12-260000050863intc:SeniorNotes185DueMay2020Member2020-12-260000050863intc:SeniorNotes245DueJuly2020Member2019-12-292020-12-260000050863intc:SeniorNotes245DueJuly2020Member2020-12-260000050863intc:FloatingRateSeniorNotesDue2020Member2019-12-292020-12-260000050863intc:DebtInstrumentTwentyFourMember2020-12-260000050863intc:IndustrialAuthorityoftheCityofChandlerArizonaMemberus-gaap:UnsecuredDebtMember2020-12-260000050863intc:DebtInstrumentFourMember2018-12-302019-12-280000050863intc:DebtInstrumentFourMember2019-12-292020-12-260000050863intc:DebtInstrumentThirtyEightMember2019-12-292020-12-260000050863intc:DebtInstrumentFortyMember2019-12-292020-12-260000050863intc:IndustrialAuthorityoftheCityofChandlerArizona2.70dueDecember2035Member2020-12-260000050863intc:StateofOregonBusinessDevelopmentCommission2.40dueDecember2035Member2020-12-260000050863intc:StateofOregonBusinessDevelopmentCommission5.00dueMarch2049Member2020-12-260000050863intc:IndustrialAuthorityoftheCityofChandlerArizona5.00dueJune2049Member2020-12-260000050863us-gaap:FairValueInputsLevel1Memberus-gaap:CashEquivalentsMemberus-gaap:CorporateDebtSecuritiesMemberus-gaap:FairValueMeasurementsRecurringMember2020-12-260000050863us-gaap:CashEquivalentsMemberus-gaap:FairValueInputsLevel2Memberus-gaap:CorporateDebtSecuritiesMemberus-gaap:FairValueMeasurementsRecurringMember2020-12-260000050863us-gaap:CashEquivalentsMemberus-gaap:FairValueInputsLevel3Memberus-gaap:CorporateDebtSecuritiesMemberus-gaap:FairValueMeasurementsRecurringMember2020-12-260000050863us-gaap:CashEquivalentsMemberus-gaap:CorporateDebtSecuritiesMemberus-gaap:FairValueMeasurementsRecurringMember2020-12-260000050863us-gaap:FairValueInputsLevel1Memberus-gaap:CashEquivalentsMemberus-gaap:CorporateDebtSecuritiesMemberus-gaap:FairValueMeasurementsRecurringMember2019-12-280000050863us-gaap:CashEquivalentsMemberus-gaap:FairValueInputsLevel2Memberus-gaap:CorporateDebtSecuritiesMemberus-gaap:FairValueMeasurementsRecurringMember2019-12-280000050863us-gaap:CashEquivalentsMemberus-gaap:FairValueInputsLevel3Memberus-gaap:CorporateDebtSecuritiesMemberus-gaap:FairValueMeasurementsRecurringMember2019-12-280000050863us-gaap:CashEquivalentsMemberus-gaap:CorporateDebtSecuritiesMemberus-gaap:FairValueMeasurementsRecurringMember2019-12-280000050863us-gaap:FairValueInputsLevel1Memberus-gaap:CashEquivalentsMemberus-gaap:FixedIncomeSecuritiesMemberus-gaap:FairValueMeasurementsRecurringMember2020-12-260000050863us-gaap:CashEquivalentsMemberus-gaap:FairValueInputsLevel2Memberus-gaap:FixedIncomeSecuritiesMemberus-gaap:FairValueMeasurementsRecurringMember2020-12-260000050863us-gaap:CashEquivalentsMemberus-gaap:FixedIncomeSecuritiesMemberus-gaap:FairValueInputsLevel3Memberus-gaap:FairValueMeasurementsRecurringMember2020-12-260000050863us-gaap:CashEquivalentsMemberus-gaap:FixedIncomeSecuritiesMemberus-gaap:FairValueMeasurementsRecurringMember2020-12-260000050863us-gaap:FairValueInputsLevel1Memberus-gaap:CashEquivalentsMemberus-gaap:FixedIncomeSecuritiesMemberus-gaap:FairValueMeasurementsRecurringMember2019-12-280000050863us-gaap:CashEquivalentsMemberus-gaap:FairValueInputsLevel2Memberus-gaap:FixedIncomeSecuritiesMemberus-gaap:FairValueMeasurementsRecurringMember2019-12-280000050863us-gaap:CashEquivalentsMemberus-gaap:FixedIncomeSecuritiesMemberus-gaap:FairValueInputsLevel3Memberus-gaap:FairValueMeasurementsRecurringMember2019-12-280000050863us-gaap:CashEquivalentsMemberus-gaap:FixedIncomeSecuritiesMemberus-gaap:FairValueMeasurementsRecurringMember2019-12-280000050863us-gaap:FairValueInputsLevel1Memberus-gaap:CashEquivalentsMemberus-gaap:RepurchaseAgreementsMemberus-gaap:FairValueMeasurementsRecurringMember2020-12-260000050863us-gaap:CashEquivalentsMemberus-gaap:FairValueInputsLevel2Memberus-gaap:RepurchaseAgreementsMemberus-gaap:FairValueMeasurementsRecurringMember2020-12-260000050863us-gaap:CashEquivalentsMemberus-gaap:RepurchaseAgreementsMemberus-gaap:FairValueInputsLevel3Memberus-gaap:FairValueMeasurementsRecurringMember2020-12-260000050863us-gaap:CashEquivalentsMemberus-gaap:RepurchaseAgreementsMemberus-gaap:FairValueMeasurementsRecurringMember2020-12-260000050863us-gaap:FairValueInputsLevel1Memberus-gaap:CashEquivalentsMemberus-gaap:RepurchaseAgreementsMemberus-gaap:FairValueMeasurementsRecurringMember2019-12-280000050863us-gaap:CashEquivalentsMemberus-gaap:FairValueInputsLevel2Memberus-gaap:RepurchaseAgreementsMemberus-gaap:FairValueMeasurementsRecurringMember2019-12-280000050863us-gaap:CashEquivalentsMemberus-gaap:RepurchaseAgreementsMemberus-gaap:FairValueInputsLevel3Memberus-gaap:FairValueMeasurementsRecurringMember2019-12-280000050863us-gaap:CashEquivalentsMemberus-gaap:RepurchaseAgreementsMemberus-gaap:FairValueMeasurementsRecurringMember2019-12-280000050863us-gaap:ShortTermInvestmentsMemberus-gaap:FairValueInputsLevel1Memberus-gaap:CorporateDebtSecuritiesMemberus-gaap:FairValueMeasurementsRecurringMember2020-12-260000050863us-gaap:ShortTermInvestmentsMemberus-gaap:FairValueInputsLevel2Memberus-gaap:CorporateDebtSecuritiesMemberus-gaap:FairValueMeasurementsRecurringMember2020-12-260000050863us-gaap:ShortTermInvestmentsMemberus-gaap:FairValueInputsLevel3Memberus-gaap:CorporateDebtSecuritiesMemberus-gaap:FairValueMeasurementsRecurringMember2020-12-260000050863us-gaap:ShortTermInvestmentsMemberus-gaap:CorporateDebtSecuritiesMemberus-gaap:FairValueMeasurementsRecurringMember2020-12-260000050863us-gaap:ShortTermInvestmentsMemberus-gaap:FairValueInputsLevel1Memberus-gaap:CorporateDebtSecuritiesMemberus-gaap:FairValueMeasurementsRecurringMember2019-12-280000050863us-gaap:ShortTermInvestmentsMemberus-gaap:FairValueInputsLevel2Memberus-gaap:CorporateDebtSecuritiesMemberus-gaap:FairValueMeasurementsRecurringMember2019-12-280000050863us-gaap:ShortTermInvestmentsMemberus-gaap:FairValueInputsLevel3Memberus-gaap:CorporateDebtSecuritiesMemberus-gaap:FairValueMeasurementsRecurringMember2019-12-280000050863us-gaap:ShortTermInvestmentsMemberus-gaap:CorporateDebtSecuritiesMemberus-gaap:FairValueMeasurementsRecurringMember2019-12-280000050863us-gaap:ShortTermInvestmentsMemberus-gaap:FairValueInputsLevel1Memberus-gaap:FixedIncomeSecuritiesMemberus-gaap:FairValueMeasurementsRecurringMember2020-12-260000050863us-gaap:ShortTermInvestmentsMemberus-gaap:FairValueInputsLevel2Memberus-gaap:FixedIncomeSecuritiesMemberus-gaap:FairValueMeasurementsRecurringMember2020-12-260000050863us-gaap:ShortTermInvestmentsMemberus-gaap:FixedIncomeSecuritiesMemberus-gaap:FairValueInputsLevel3Memberus-gaap:FairValueMeasurementsRecurringMember2020-12-260000050863us-gaap:ShortTermInvestmentsMemberus-gaap:FixedIncomeSecuritiesMemberus-gaap:FairValueMeasurementsRecurringMember2020-12-260000050863us-gaap:ShortTermInvestmentsMemberus-gaap:FairValueInputsLevel1Memberus-gaap:FixedIncomeSecuritiesMemberus-gaap:FairValueMeasurementsRecurringMember2019-12-280000050863us-gaap:ShortTermInvestmentsMemberus-gaap:FairValueInputsLevel2Memberus-gaap:FixedIncomeSecuritiesMemberus-gaap:FairValueMeasurementsRecurringMember2019-12-280000050863us-gaap:ShortTermInvestmentsMemberus-gaap:FixedIncomeSecuritiesMemberus-gaap:FairValueInputsLevel3Memberus-gaap:FairValueMeasurementsRecurringMember2019-12-280000050863us-gaap:ShortTermInvestmentsMemberus-gaap:FixedIncomeSecuritiesMemberus-gaap:FairValueMeasurementsRecurringMember2019-12-280000050863us-gaap:ShortTermInvestmentsMemberintc:GovernmentDebtSecuritiesMemberus-gaap:FairValueInputsLevel1Memberus-gaap:FairValueMeasurementsRecurringMember2020-12-260000050863us-gaap:ShortTermInvestmentsMemberintc:GovernmentDebtSecuritiesMemberus-gaap:FairValueInputsLevel2Memberus-gaap:FairValueMeasurementsRecurringMember2020-12-260000050863us-gaap:ShortTermInvestmentsMemberintc:GovernmentDebtSecuritiesMemberus-gaap:FairValueInputsLevel3Memberus-gaap:FairValueMeasurementsRecurringMember2020-12-260000050863us-gaap:ShortTermInvestmentsMemberintc:GovernmentDebtSecuritiesMemberus-gaap:FairValueMeasurementsRecurringMember2020-12-260000050863us-gaap:ShortTermInvestmentsMemberintc:GovernmentDebtSecuritiesMemberus-gaap:FairValueInputsLevel1Memberus-gaap:FairValueMeasurementsRecurringMember2019-12-280000050863us-gaap:ShortTermInvestmentsMemberintc:GovernmentDebtSecuritiesMemberus-gaap:FairValueInputsLevel2Memberus-gaap:FairValueMeasurementsRecurringMember2019-12-280000050863us-gaap:ShortTermInvestmentsMemberintc:GovernmentDebtSecuritiesMemberus-gaap:FairValueInputsLevel3Memberus-gaap:FairValueMeasurementsRecurringMember2019-12-280000050863us-gaap:ShortTermInvestmentsMemberintc:GovernmentDebtSecuritiesMemberus-gaap:FairValueMeasurementsRecurringMember2019-12-280000050863us-gaap:FairValueInputsLevel1Memberus-gaap:CorporateDebtSecuritiesMemberus-gaap:FairValueMeasurementsRecurringMember2020-12-260000050863us-gaap:FairValueInputsLevel2Memberus-gaap:CorporateDebtSecuritiesMemberus-gaap:FairValueMeasurementsRecurringMember2020-12-260000050863us-gaap:FairValueInputsLevel3Memberus-gaap:CorporateDebtSecuritiesMemberus-gaap:FairValueMeasurementsRecurringMember2020-12-260000050863us-gaap:CorporateDebtSecuritiesMemberus-gaap:FairValueMeasurementsRecurringMember2020-12-260000050863us-gaap:FairValueInputsLevel1Memberus-gaap:CorporateDebtSecuritiesMemberus-gaap:FairValueMeasurementsRecurringMember2019-12-280000050863us-gaap:FairValueInputsLevel2Memberus-gaap:CorporateDebtSecuritiesMemberus-gaap:FairValueMeasurementsRecurringMember2019-12-280000050863us-gaap:FairValueInputsLevel3Memberus-gaap:CorporateDebtSecuritiesMemberus-gaap:FairValueMeasurementsRecurringMember2019-12-280000050863us-gaap:CorporateDebtSecuritiesMemberus-gaap:FairValueMeasurementsRecurringMember2019-12-280000050863us-gaap:FairValueInputsLevel1Memberus-gaap:FixedIncomeSecuritiesMemberus-gaap:FairValueMeasurementsRecurringMember2020-12-260000050863us-gaap:FairValueInputsLevel2Memberus-gaap:FixedIncomeSecuritiesMemberus-gaap:FairValueMeasurementsRecurringMember2020-12-260000050863us-gaap:FixedIncomeSecuritiesMemberus-gaap:FairValueInputsLevel3Memberus-gaap:FairValueMeasurementsRecurringMember2020-12-260000050863us-gaap:FixedIncomeSecuritiesMemberus-gaap:FairValueMeasurementsRecurringMember2020-12-260000050863us-gaap:FairValueInputsLevel1Memberus-gaap:FixedIncomeSecuritiesMemberus-gaap:FairValueMeasurementsRecurringMember2019-12-280000050863us-gaap:FairValueInputsLevel2Memberus-gaap:FixedIncomeSecuritiesMemberus-gaap:FairValueMeasurementsRecurringMember2019-12-280000050863us-gaap:FixedIncomeSecuritiesMemberus-gaap:FairValueInputsLevel3Memberus-gaap:FairValueMeasurementsRecurringMember2019-12-280000050863us-gaap:FixedIncomeSecuritiesMemberus-gaap:FairValueMeasurementsRecurringMember2019-12-280000050863intc:GovernmentDebtSecuritiesMemberus-gaap:FairValueInputsLevel1Memberus-gaap:FairValueMeasurementsRecurringMember2020-12-260000050863intc:GovernmentDebtSecuritiesMemberus-gaap:FairValueInputsLevel2Memberus-gaap:FairValueMeasurementsRecurringMember2020-12-260000050863intc:GovernmentDebtSecuritiesMemberus-gaap:FairValueInputsLevel3Memberus-gaap:FairValueMeasurementsRecurringMember2020-12-260000050863intc:GovernmentDebtSecuritiesMemberus-gaap:FairValueMeasurementsRecurringMember2020-12-260000050863intc:GovernmentDebtSecuritiesMemberus-gaap:FairValueInputsLevel1Memberus-gaap:FairValueMeasurementsRecurringMember2019-12-280000050863intc:GovernmentDebtSecuritiesMemberus-gaap:FairValueInputsLevel2Memberus-gaap:FairValueMeasurementsRecurringMember2019-12-280000050863intc:GovernmentDebtSecuritiesMemberus-gaap:FairValueInputsLevel3Memberus-gaap:FairValueMeasurementsRecurringMember2019-12-280000050863intc:GovernmentDebtSecuritiesMemberus-gaap:FairValueMeasurementsRecurringMember2019-12-280000050863us-gaap:FairValueInputsLevel1Memberus-gaap:FairValueMeasurementsRecurringMemberus-gaap:OtherCurrentAssetsMember2020-12-260000050863us-gaap:FairValueInputsLevel2Memberus-gaap:FairValueMeasurementsRecurringMemberus-gaap:OtherCurrentAssetsMember2020-12-260000050863us-gaap:FairValueInputsLevel3Memberus-gaap:FairValueMeasurementsRecurringMemberus-gaap:OtherCurrentAssetsMember2020-12-260000050863us-gaap:FairValueMeasurementsRecurringMemberus-gaap:OtherCurrentAssetsMember2020-12-260000050863us-gaap:FairValueInputsLevel1Memberus-gaap:FairValueMeasurementsRecurringMemberus-gaap:OtherCurrentAssetsMember2019-12-280000050863us-gaap:FairValueInputsLevel2Memberus-gaap:FairValueMeasurementsRecurringMemberus-gaap:OtherCurrentAssetsMember2019-12-280000050863us-gaap:FairValueInputsLevel3Memberus-gaap:FairValueMeasurementsRecurringMemberus-gaap:OtherCurrentAssetsMember2019-12-280000050863us-gaap:FairValueMeasurementsRecurringMemberus-gaap:OtherCurrentAssetsMember2019-12-280000050863us-gaap:EquitySecuritiesMemberus-gaap:FairValueInputsLevel1Memberus-gaap:FairValueMeasurementsRecurringMember2020-12-260000050863us-gaap:EquitySecuritiesMemberus-gaap:FairValueInputsLevel2Memberus-gaap:FairValueMeasurementsRecurringMember2020-12-260000050863us-gaap:EquitySecuritiesMemberus-gaap:FairValueInputsLevel3Memberus-gaap:FairValueMeasurementsRecurringMember2020-12-260000050863us-gaap:EquitySecuritiesMemberus-gaap:FairValueMeasurementsRecurringMember2020-12-260000050863us-gaap:EquitySecuritiesMemberus-gaap:FairValueInputsLevel1Memberus-gaap:FairValueMeasurementsRecurringMember2019-12-280000050863us-gaap:EquitySecuritiesMemberus-gaap:FairValueInputsLevel2Memberus-gaap:FairValueMeasurementsRecurringMember2019-12-280000050863us-gaap:EquitySecuritiesMemberus-gaap:FairValueInputsLevel3Memberus-gaap:FairValueMeasurementsRecurringMember2019-12-280000050863us-gaap:EquitySecuritiesMemberus-gaap:FairValueMeasurementsRecurringMember2019-12-280000050863us-gaap:FairValueInputsLevel1Memberus-gaap:OtherLongTermInvestmentsMemberus-gaap:CorporateDebtSecuritiesMemberus-gaap:FairValueMeasurementsRecurringMember2020-12-260000050863us-gaap:FairValueInputsLevel2Memberus-gaap:OtherLongTermInvestmentsMemberus-gaap:CorporateDebtSecuritiesMemberus-gaap:FairValueMeasurementsRecurringMember2020-12-260000050863us-gaap:FairValueInputsLevel3Memberus-gaap:OtherLongTermInvestmentsMemberus-gaap:CorporateDebtSecuritiesMemberus-gaap:FairValueMeasurementsRecurringMember2020-12-260000050863us-gaap:OtherLongTermInvestmentsMemberus-gaap:CorporateDebtSecuritiesMemberus-gaap:FairValueMeasurementsRecurringMember2020-12-260000050863us-gaap:FairValueInputsLevel1Memberus-gaap:OtherLongTermInvestmentsMemberus-gaap:CorporateDebtSecuritiesMemberus-gaap:FairValueMeasurementsRecurringMember2019-12-280000050863us-gaap:FairValueInputsLevel2Memberus-gaap:OtherLongTermInvestmentsMemberus-gaap:CorporateDebtSecuritiesMemberus-gaap:FairValueMeasurementsRecurringMember2019-12-280000050863us-gaap:FairValueInputsLevel3Memberus-gaap:OtherLongTermInvestmentsMemberus-gaap:CorporateDebtSecuritiesMemberus-gaap:FairValueMeasurementsRecurringMember2019-12-280000050863us-gaap:OtherLongTermInvestmentsMemberus-gaap:CorporateDebtSecuritiesMemberus-gaap:FairValueMeasurementsRecurringMember2019-12-280000050863us-gaap:FairValueInputsLevel1Memberus-gaap:FixedIncomeSecuritiesMemberus-gaap:OtherLongTermInvestmentsMemberus-gaap:FairValueMeasurementsRecurringMember2020-12-260000050863us-gaap:FairValueInputsLevel2Memberus-gaap:FixedIncomeSecuritiesMemberus-gaap:OtherLongTermInvestmentsMemberus-gaap:FairValueMeasurementsRecurringMember2020-12-260000050863us-gaap:FixedIncomeSecuritiesMemberus-gaap:FairValueInputsLevel3Memberus-gaap:OtherLongTermInvestmentsMemberus-gaap:FairValueMeasurementsRecurringMember2020-12-260000050863us-gaap:FixedIncomeSecuritiesMemberus-gaap:OtherLongTermInvestmentsMemberus-gaap:FairValueMeasurementsRecurringMember2020-12-260000050863us-gaap:FairValueInputsLevel1Memberus-gaap:FixedIncomeSecuritiesMemberus-gaap:OtherLongTermInvestmentsMemberus-gaap:FairValueMeasurementsRecurringMember2019-12-280000050863us-gaap:FairValueInputsLevel2Memberus-gaap:FixedIncomeSecuritiesMemberus-gaap:OtherLongTermInvestmentsMemberus-gaap:FairValueMeasurementsRecurringMember2019-12-280000050863us-gaap:FixedIncomeSecuritiesMemberus-gaap:FairValueInputsLevel3Memberus-gaap:OtherLongTermInvestmentsMemberus-gaap:FairValueMeasurementsRecurringMember2019-12-280000050863us-gaap:FixedIncomeSecuritiesMemberus-gaap:OtherLongTermInvestmentsMemberus-gaap:FairValueMeasurementsRecurringMember2019-12-280000050863intc:GovernmentDebtSecuritiesMemberus-gaap:FairValueInputsLevel1Memberus-gaap:OtherLongTermInvestmentsMemberus-gaap:FairValueMeasurementsRecurringMember2020-12-260000050863intc:GovernmentDebtSecuritiesMemberus-gaap:FairValueInputsLevel2Memberus-gaap:OtherLongTermInvestmentsMemberus-gaap:FairValueMeasurementsRecurringMember2020-12-260000050863intc:GovernmentDebtSecuritiesMemberus-gaap:FairValueInputsLevel3Memberus-gaap:OtherLongTermInvestmentsMemberus-gaap:FairValueMeasurementsRecurringMember2020-12-260000050863intc:GovernmentDebtSecuritiesMemberus-gaap:OtherLongTermInvestmentsMemberus-gaap:FairValueMeasurementsRecurringMember2020-12-260000050863intc:GovernmentDebtSecuritiesMemberus-gaap:FairValueInputsLevel1Memberus-gaap:OtherLongTermInvestmentsMemberus-gaap:FairValueMeasurementsRecurringMember2019-12-280000050863intc:GovernmentDebtSecuritiesMemberus-gaap:FairValueInputsLevel2Memberus-gaap:OtherLongTermInvestmentsMemberus-gaap:FairValueMeasurementsRecurringMember2019-12-280000050863intc:GovernmentDebtSecuritiesMemberus-gaap:FairValueInputsLevel3Memberus-gaap:OtherLongTermInvestmentsMemberus-gaap:FairValueMeasurementsRecurringMember2019-12-280000050863intc:GovernmentDebtSecuritiesMemberus-gaap:OtherLongTermInvestmentsMemberus-gaap:FairValueMeasurementsRecurringMember2019-12-280000050863us-gaap:FairValueInputsLevel1Memberus-gaap:OtherNoncurrentAssetsMemberus-gaap:FairValueMeasurementsRecurringMember2020-12-260000050863us-gaap:FairValueInputsLevel2Memberus-gaap:OtherNoncurrentAssetsMemberus-gaap:FairValueMeasurementsRecurringMember2020-12-260000050863us-gaap:OtherNoncurrentAssetsMemberus-gaap:FairValueInputsLevel3Memberus-gaap:FairValueMeasurementsRecurringMember2020-12-260000050863us-gaap:OtherNoncurrentAssetsMemberus-gaap:FairValueMeasurementsRecurringMember2020-12-260000050863us-gaap:FairValueInputsLevel1Memberus-gaap:OtherNoncurrentAssetsMemberus-gaap:FairValueMeasurementsRecurringMember2019-12-280000050863us-gaap:FairValueInputsLevel2Memberus-gaap:OtherNoncurrentAssetsMemberus-gaap:FairValueMeasurementsRecurringMember2019-12-280000050863us-gaap:OtherNoncurrentAssetsMemberus-gaap:FairValueInputsLevel3Memberus-gaap:FairValueMeasurementsRecurringMember2019-12-280000050863us-gaap:OtherNoncurrentAssetsMemberus-gaap:FairValueMeasurementsRecurringMember2019-12-280000050863us-gaap:FairValueInputsLevel1Memberus-gaap:FairValueMeasurementsRecurringMember2020-12-260000050863us-gaap:FairValueInputsLevel2Memberus-gaap:FairValueMeasurementsRecurringMember2020-12-260000050863us-gaap:FairValueInputsLevel3Memberus-gaap:FairValueMeasurementsRecurringMember2020-12-260000050863us-gaap:FairValueMeasurementsRecurringMember2020-12-260000050863us-gaap:FairValueInputsLevel1Memberus-gaap:FairValueMeasurementsRecurringMember2019-12-280000050863us-gaap:FairValueInputsLevel2Memberus-gaap:FairValueMeasurementsRecurringMember2019-12-280000050863us-gaap:FairValueInputsLevel3Memberus-gaap:FairValueMeasurementsRecurringMember2019-12-280000050863us-gaap:FairValueMeasurementsRecurringMember2019-12-280000050863us-gaap:OtherCurrentLiabilitiesMemberus-gaap:FairValueInputsLevel1Memberus-gaap:FairValueMeasurementsRecurringMember2020-12-260000050863us-gaap:OtherCurrentLiabilitiesMemberus-gaap:FairValueInputsLevel2Memberus-gaap:FairValueMeasurementsRecurringMember2020-12-260000050863us-gaap:OtherCurrentLiabilitiesMemberus-gaap:FairValueInputsLevel3Memberus-gaap:FairValueMeasurementsRecurringMember2020-12-260000050863us-gaap:OtherCurrentLiabilitiesMemberus-gaap:FairValueMeasurementsRecurringMember2020-12-260000050863us-gaap:OtherCurrentLiabilitiesMemberus-gaap:FairValueInputsLevel1Memberus-gaap:FairValueMeasurementsRecurringMember2019-12-280000050863us-gaap:OtherCurrentLiabilitiesMemberus-gaap:FairValueInputsLevel2Memberus-gaap:FairValueMeasurementsRecurringMember2019-12-280000050863us-gaap:OtherCurrentLiabilitiesMemberus-gaap:FairValueInputsLevel3Memberus-gaap:FairValueMeasurementsRecurringMember2019-12-280000050863us-gaap:OtherCurrentLiabilitiesMemberus-gaap:FairValueMeasurementsRecurringMember2019-12-280000050863us-gaap:OtherNoncurrentLiabilitiesMemberus-gaap:FairValueInputsLevel1Memberus-gaap:FairValueMeasurementsRecurringMember2020-12-260000050863us-gaap:OtherNoncurrentLiabilitiesMemberus-gaap:FairValueInputsLevel2Memberus-gaap:FairValueMeasurementsRecurringMember2020-12-260000050863us-gaap:OtherNoncurrentLiabilitiesMemberus-gaap:FairValueInputsLevel3Memberus-gaap:FairValueMeasurementsRecurringMember2020-12-260000050863us-gaap:OtherNoncurrentLiabilitiesMemberus-gaap:FairValueMeasurementsRecurringMember2020-12-260000050863us-gaap:OtherNoncurrentLiabilitiesMemberus-gaap:FairValueInputsLevel1Memberus-gaap:FairValueMeasurementsRecurringMember2019-12-280000050863us-gaap:OtherNoncurrentLiabilitiesMemberus-gaap:FairValueInputsLevel2Memberus-gaap:FairValueMeasurementsRecurringMember2019-12-280000050863us-gaap:OtherNoncurrentLiabilitiesMemberus-gaap:FairValueInputsLevel3Memberus-gaap:FairValueMeasurementsRecurringMember2019-12-280000050863us-gaap:OtherNoncurrentLiabilitiesMemberus-gaap:FairValueMeasurementsRecurringMember2019-12-280000050863us-gaap:CostmethodInvestmentsMemberus-gaap:FairValueMeasurementsNonrecurringMember2019-12-292020-12-260000050863us-gaap:CostmethodInvestmentsMemberus-gaap:FairValueMeasurementsNonrecurringMember2018-12-302019-12-280000050863us-gaap:CostmethodInvestmentsMemberus-gaap:FairValueMeasurementsNonrecurringMember2017-12-312018-12-290000050863us-gaap:CarryingReportedAmountFairValueDisclosureMemberus-gaap:FairValueMeasurementsNonrecurringMember2020-12-260000050863us-gaap:CarryingReportedAmountFairValueDisclosureMemberus-gaap:FairValueMeasurementsNonrecurringMember2019-12-280000050863us-gaap:AccumulatedNetGainLossFromCashFlowHedgesIncludingPortionAttributableToNoncontrollingInterestMember2017-12-300000050863us-gaap:AccumulatedDefinedBenefitPlansAdjustmentNetGainLossIncludingPortionAttributableToNoncontrollingInterestMember2017-12-300000050863us-gaap:AccumulatedTranslationAdjustmentMember2017-12-300000050863us-gaap:AociIncludingPortionAttributableToNoncontrollingInterestMember2017-12-300000050863us-gaap:AccumulatedNetGainLossFromCashFlowHedgesIncludingPortionAttributableToNoncontrollingInterestMember2017-12-312018-12-290000050863us-gaap:AccumulatedDefinedBenefitPlansAdjustmentNetGainLossIncludingPortionAttributableToNoncontrollingInterestMember2017-12-312018-12-290000050863us-gaap:AccumulatedTranslationAdjustmentMember2017-12-312018-12-290000050863us-gaap:AccumulatedNetGainLossFromCashFlowHedgesIncludingPortionAttributableToNoncontrollingInterestMember2018-12-290000050863us-gaap:AccumulatedDefinedBenefitPlansAdjustmentNetGainLossIncludingPortionAttributableToNoncontrollingInterestMember2018-12-290000050863us-gaap:AccumulatedTranslationAdjustmentMember2018-12-290000050863us-gaap:AociIncludingPortionAttributableToNoncontrollingInterestMember2018-12-290000050863us-gaap:AccumulatedNetGainLossFromCashFlowHedgesIncludingPortionAttributableToNoncontrollingInterestMember2018-12-302019-12-280000050863us-gaap:AccumulatedDefinedBenefitPlansAdjustmentNetGainLossIncludingPortionAttributableToNoncontrollingInterestMember2018-12-302019-12-280000050863us-gaap:AccumulatedTranslationAdjustmentMember2018-12-302019-12-280000050863us-gaap:AccumulatedNetGainLossFromCashFlowHedgesIncludingPortionAttributableToNoncontrollingInterestMember2019-12-280000050863us-gaap:AccumulatedDefinedBenefitPlansAdjustmentNetGainLossIncludingPortionAttributableToNoncontrollingInterestMember2019-12-280000050863us-gaap:AccumulatedTranslationAdjustmentMember2019-12-280000050863us-gaap:AociIncludingPortionAttributableToNoncontrollingInterestMember2019-12-280000050863us-gaap:AccumulatedNetGainLossFromCashFlowHedgesIncludingPortionAttributableToNoncontrollingInterestMember2019-12-292020-12-260000050863us-gaap:AccumulatedDefinedBenefitPlansAdjustmentNetGainLossIncludingPortionAttributableToNoncontrollingInterestMember2019-12-292020-12-260000050863us-gaap:AccumulatedTranslationAdjustmentMember2019-12-292020-12-260000050863us-gaap:AccumulatedNetGainLossFromCashFlowHedgesIncludingPortionAttributableToNoncontrollingInterestMember2020-12-260000050863us-gaap:AccumulatedDefinedBenefitPlansAdjustmentNetGainLossIncludingPortionAttributableToNoncontrollingInterestMember2020-12-260000050863us-gaap:AccumulatedTranslationAdjustmentMember2020-12-260000050863us-gaap:AociIncludingPortionAttributableToNoncontrollingInterestMember2020-12-260000050863us-gaap:ForeignExchangeContractMember2020-12-260000050863us-gaap:ForeignExchangeContractMember2019-12-280000050863us-gaap:ForeignExchangeContractMember2018-12-290000050863us-gaap:InterestRateContractMember2020-12-260000050863us-gaap:InterestRateContractMember2019-12-280000050863us-gaap:InterestRateContractMember2018-12-290000050863us-gaap:OtherContractMember2020-12-260000050863us-gaap:OtherContractMember2019-12-280000050863us-gaap:OtherContractMember2018-12-290000050863us-gaap:InterestRateSwapMember2018-12-290000050863us-gaap:InterestRateSwapMemberus-gaap:LongTermDebtMemberus-gaap:FairValueHedgingMember2020-12-260000050863us-gaap:InterestRateSwapMemberus-gaap:LongTermDebtMemberus-gaap:FairValueHedgingMember2019-12-280000050863us-gaap:InterestRateSwapMemberus-gaap:FairValueHedgingMember2019-12-280000050863us-gaap:OtherAssetsMemberus-gaap:ForeignExchangeContractMemberus-gaap:DesignatedAsHedgingInstrumentMember2020-12-260000050863us-gaap:OtherLiabilitiesMemberus-gaap:ForeignExchangeContractMemberus-gaap:DesignatedAsHedgingInstrumentMember2020-12-260000050863us-gaap:OtherAssetsMemberus-gaap:ForeignExchangeContractMemberus-gaap:DesignatedAsHedgingInstrumentMember2019-12-280000050863us-gaap:OtherLiabilitiesMemberus-gaap:ForeignExchangeContractMemberus-gaap:DesignatedAsHedgingInstrumentMember2019-12-280000050863us-gaap:InterestRateContractMemberus-gaap:OtherAssetsMemberus-gaap:DesignatedAsHedgingInstrumentMember2020-12-260000050863us-gaap:InterestRateContractMemberus-gaap:OtherLiabilitiesMemberus-gaap:DesignatedAsHedgingInstrumentMember2020-12-260000050863us-gaap:InterestRateContractMemberus-gaap:OtherAssetsMemberus-gaap:DesignatedAsHedgingInstrumentMember2019-12-280000050863us-gaap:InterestRateContractMemberus-gaap:OtherLiabilitiesMemberus-gaap:DesignatedAsHedgingInstrumentMember2019-12-280000050863us-gaap:OtherAssetsMemberus-gaap:DesignatedAsHedgingInstrumentMember2020-12-260000050863us-gaap:OtherLiabilitiesMemberus-gaap:DesignatedAsHedgingInstrumentMember2020-12-260000050863us-gaap:OtherAssetsMemberus-gaap:DesignatedAsHedgingInstrumentMember2019-12-280000050863us-gaap:OtherLiabilitiesMemberus-gaap:DesignatedAsHedgingInstrumentMember2019-12-280000050863us-gaap:NondesignatedMemberus-gaap:OtherAssetsMemberus-gaap:ForeignExchangeContractMember2020-12-260000050863us-gaap:OtherLiabilitiesMemberus-gaap:NondesignatedMemberus-gaap:ForeignExchangeContractMember2020-12-260000050863us-gaap:NondesignatedMemberus-gaap:OtherAssetsMemberus-gaap:ForeignExchangeContractMember2019-12-280000050863us-gaap:OtherLiabilitiesMemberus-gaap:NondesignatedMemberus-gaap:ForeignExchangeContractMember2019-12-280000050863us-gaap:InterestRateContractMemberus-gaap:NondesignatedMemberus-gaap:OtherAssetsMember2020-12-260000050863us-gaap:InterestRateContractMemberus-gaap:OtherLiabilitiesMemberus-gaap:NondesignatedMember2020-12-260000050863us-gaap:InterestRateContractMemberus-gaap:NondesignatedMemberus-gaap:OtherAssetsMember2019-12-280000050863us-gaap:InterestRateContractMemberus-gaap:OtherLiabilitiesMemberus-gaap:NondesignatedMember2019-12-280000050863us-gaap:OtherContractMemberus-gaap:NondesignatedMemberus-gaap:OtherAssetsMember2020-12-260000050863us-gaap:OtherContractMemberus-gaap:OtherLiabilitiesMemberus-gaap:NondesignatedMember2020-12-260000050863us-gaap:OtherContractMemberus-gaap:NondesignatedMemberus-gaap:OtherAssetsMember2019-12-280000050863us-gaap:OtherContractMemberus-gaap:OtherLiabilitiesMemberus-gaap:NondesignatedMember2019-12-280000050863us-gaap:NondesignatedMemberus-gaap:OtherAssetsMember2020-12-260000050863us-gaap:NondesignatedMemberus-gaap:OtherLiabilitiesMember2020-12-260000050863us-gaap:NondesignatedMemberus-gaap:OtherAssetsMember2019-12-280000050863us-gaap:NondesignatedMemberus-gaap:OtherLiabilitiesMember2019-12-280000050863us-gaap:OtherAssetsMember2020-12-260000050863us-gaap:OtherLiabilitiesMember2020-12-260000050863us-gaap:OtherAssetsMember2019-12-280000050863us-gaap:OtherLiabilitiesMember2019-12-280000050863us-gaap:ForeignExchangeContractMember2019-12-292020-12-260000050863us-gaap:ForeignExchangeContractMember2018-12-302019-12-280000050863us-gaap:ForeignExchangeContractMember2017-12-312018-09-290000050863us-gaap:InterestRateContractMember2019-12-292020-12-260000050863us-gaap:InterestRateContractMember2018-12-302019-12-280000050863us-gaap:InterestRateContractMember2017-12-312018-12-290000050863us-gaap:DesignatedAsHedgingInstrumentMemberus-gaap:OtherNonoperatingIncomeExpenseMember2019-12-292020-12-260000050863us-gaap:DesignatedAsHedgingInstrumentMemberus-gaap:OtherNonoperatingIncomeExpenseMember2018-12-302019-12-280000050863us-gaap:DesignatedAsHedgingInstrumentMemberus-gaap:OtherNonoperatingIncomeExpenseMember2017-12-312018-12-290000050863us-gaap:InterestRateSwapMemberus-gaap:FairValueHedgingMember2019-12-292020-12-260000050863us-gaap:InterestRateSwapMemberus-gaap:FairValueHedgingMember2018-12-302019-12-280000050863us-gaap:NondesignatedMemberus-gaap:ForeignExchangeContractMemberus-gaap:OtherNonoperatingIncomeExpenseMember2019-12-292020-12-260000050863us-gaap:NondesignatedMemberus-gaap:ForeignExchangeContractMemberus-gaap:OtherNonoperatingIncomeExpenseMember2018-12-302019-12-280000050863us-gaap:NondesignatedMemberus-gaap:ForeignExchangeContractMemberus-gaap:OtherNonoperatingIncomeExpenseMember2017-12-312018-12-290000050863us-gaap:InterestRateContractMemberus-gaap:NondesignatedMemberus-gaap:OtherNonoperatingIncomeExpenseMember2019-12-292020-12-260000050863us-gaap:InterestRateContractMemberus-gaap:NondesignatedMemberus-gaap:OtherNonoperatingIncomeExpenseMember2018-12-302019-12-280000050863us-gaap:InterestRateContractMemberus-gaap:NondesignatedMemberus-gaap:OtherNonoperatingIncomeExpenseMember2017-12-312018-12-290000050863intc:VariousMemberus-gaap:OtherContractMemberus-gaap:NondesignatedMember2019-12-292020-12-260000050863intc:VariousMemberus-gaap:OtherContractMemberus-gaap:NondesignatedMember2018-12-302019-12-280000050863intc:VariousMemberus-gaap:OtherContractMemberus-gaap:NondesignatedMember2017-12-312018-12-290000050863us-gaap:NondesignatedMember2019-12-292020-12-260000050863us-gaap:NondesignatedMember2018-12-302019-12-280000050863us-gaap:NondesignatedMember2017-12-312018-12-290000050863us-gaap:FairValueHedgingMember2019-12-292020-12-260000050863us-gaap:FairValueHedgingMember2018-12-302019-12-280000050863country:US2019-12-292020-12-260000050863country:US2018-12-302019-12-280000050863country:US2017-12-312018-12-290000050863country:USus-gaap:DefinedBenefitPostretirementHealthCoverageMember2020-12-260000050863country:USus-gaap:DefinedBenefitPostretirementHealthCoverageMember2019-12-280000050863us-gaap:DefinedBenefitPostretirementHealthCoverageMember2019-12-292020-12-260000050863intc:OtherlongtermliabilitiesMember2020-12-260000050863intc:OtherlongtermliabilitiesMember2019-12-280000050863country:US2020-12-260000050863us-gaap:ForeignPlanMember2020-12-260000050863country:USus-gaap:PensionPlansDefinedBenefitMember2019-12-292020-12-260000050863country:USus-gaap:PensionPlansDefinedBenefitMember2018-12-302019-12-280000050863country:USus-gaap:PensionPlansDefinedBenefitMember2017-12-312018-12-290000050863us-gaap:FairValueInputsLevel1Memberus-gaap:EquitySecuritiesMember2020-12-260000050863us-gaap:EquitySecuritiesMemberus-gaap:FairValueInputsLevel2Member2020-12-260000050863us-gaap:EquitySecuritiesMemberus-gaap:FairValueInputsLevel3Member2020-12-260000050863us-gaap:EquitySecuritiesMember2020-12-260000050863us-gaap:EquitySecuritiesMember2019-12-280000050863us-gaap:FairValueInputsLevel1Memberus-gaap:FixedIncomeSecuritiesMember2020-12-260000050863us-gaap:FairValueInputsLevel2Memberus-gaap:FixedIncomeSecuritiesMember2020-12-260000050863us-gaap:FairValueInputsLevel3Memberus-gaap:FixedIncomeSecuritiesMember2020-12-260000050863us-gaap:FixedIncomeSecuritiesMember2020-12-260000050863us-gaap:FixedIncomeSecuritiesMember2019-12-280000050863us-gaap:FairValueInputsLevel1Member2020-12-260000050863us-gaap:FairValueInputsLevel2Member2020-12-260000050863us-gaap:FairValueInputsLevel3Member2020-12-260000050863us-gaap:PensionPlansDefinedBenefitMember2020-12-260000050863us-gaap:PensionPlansDefinedBenefitMember2019-12-280000050863intc:AssetsmeasuredatnetassetvalueMember2020-12-260000050863intc:AssetsmeasuredatnetassetvalueMember2019-12-280000050863us-gaap:CashAndCashEquivalentsMember2020-12-260000050863us-gaap:CashAndCashEquivalentsMember2019-12-280000050863country:USus-gaap:FixedIncomeSecuritiesMember2020-12-260000050863country:USus-gaap:EquitySecuritiesMember2020-12-260000050863us-gaap:HedgeFundsMemberus-gaap:ForeignPlanMember2020-12-260000050863us-gaap:PensionPlansDefinedBenefitMember2019-12-292020-12-260000050863intc:EquityIncentivePlanOneMember2020-12-260000050863srt:MinimumMemberintc:MarketBasedRestrictedStockUnitsMember2020-12-260000050863intc:MarketBasedRestrictedStockUnitsMembersrt:MaximumMember2020-12-260000050863intc:MarketBasedRestrictedStockUnitsMember2020-12-260000050863us-gaap:RestrictedStockUnitsRSUMember2019-12-292020-12-260000050863us-gaap:EmployeeStockOptionMember2019-12-292020-12-260000050863us-gaap:RestrictedStockUnitsRSUMember2018-12-302019-12-280000050863us-gaap:RestrictedStockUnitsRSUMember2017-12-312018-12-290000050863intc:MarketBasedRestrictedStockUnitsMember2019-12-292020-12-260000050863intc:MarketBasedRestrictedStockUnitsMember2018-12-302019-12-280000050863intc:MarketBasedRestrictedStockUnitsMember2017-12-312018-12-290000050863us-gaap:RestrictedStockUnitsRSUMember2019-12-280000050863us-gaap:RestrictedStockUnitsRSUMember2020-12-260000050863intc:StockPurchasePlanMember2019-12-292020-12-260000050863intc:StockPurchasePlanMember2020-12-260000050863intc:StockPurchasePlanRIghtsMember2019-12-292020-12-260000050863intc:StockPurchasePlanRIghtsMember2018-12-302019-12-280000050863intc:StockPurchasePlanRIghtsMember2017-12-312018-12-290000050863intc:StockPurchasePlanRIghtsMember2020-12-260000050863us-gaap:OtherNoncurrentAssetsMember2020-12-260000050863us-gaap:AccruedLiabilitiesMember2020-12-260000050863us-gaap:OtherNoncurrentLiabilitiesMember2020-12-260000050863srt:MinimumMember2020-12-260000050863srt:MaximumMember2020-12-260000050863us-gaap:CapitalAdditionsMember2020-12-260000050863us-gaap:CapitalAdditionsMember2019-12-28iso4217:EUR0000050863intc:EcFineMember2009-05-012009-05-31
UNITED STATES SECURITIES AND EXCHANGE COMMISSION
Washington, D.C. 20549
FORM 10-K
(Mark One)
| | | | | |
| ☑ | ANNUAL REPORT PURSUANT TO SECTION 13 OR 15(d) OF THE SECURITIES EXCHANGE ACT OF 1934 |
| For the fiscal year ended December 26, 2020. |
| or |
| ☐ | TRANSITION REPORT PURSUANT TO SECTION 13 OR 15(d) OF THE SECURITIES EXCHANGE ACT OF 1934 |
| For the transition period from to . |
Commission File Number 000-06217
INTEL CORPORATION
(Exact name of registrant as specified in its charter)
| | | | | | | | | | | | | | |
| Delaware | | | | 94-1672743 |
| (State or other jurisdiction of incorporation or organization) | | (I.R.S. Employer Identification No.) |
| | | | |
| 2200 Mission College Boulevard, | Santa Clara, | California | | 95054-1549 |
| (Address of principal executive offices) | | (Zip Code) |
Registrant’s telephone number, including area code (408) 765-8080
Securities registered pursuant to Section 12(b) of the Act:
| | | | | | | | | | | | | | |
| Title of each class | | Trading symbol | | Name of each exchange on which registered |
| Common stock, $0.001 par value | | INTC | | Nasdaq Global Select Market |
Securities registered pursuant to Section 12(g) of the Act:
None
Indicate by check mark if the registrant is a well-known seasoned issuer, as defined in Rule 405 of the Securities Act. Yes ☑ No ☐
Indicate by check mark if the registrant is not required to file reports pursuant to Section 13 or Section 15(d) of the Act. Yes ☐ No ☑
Indicate by check mark whether the registrant (1) has filed all reports required to be filed by Section 13 or 15(d) of the Securities Exchange Act of 1934 during the preceding 12 months (or for such shorter period that the registrant was required to file such reports), and (2) has been subject to such filing requirements for the past 90 days. Yes ☑ No ☐
Indicate by check mark whether the registrant has submitted electronically every interactive data file required to be submitted pursuant to Rule 405 of Regulation S-T (§ 232.405 of this chapter) during the preceding 12 months (or for such shorter period that the registrant was required to submit such files). Yes ☑ No ☐
Indicate by check mark whether the registrant is a large accelerated filer, an accelerated filer, a non-accelerated filer, a smaller reporting company, or an emerging growth company. See the definitions of "large accelerated filer," "accelerated filer," "smaller reporting company," and "emerging growth company" in Rule 12b-2 of the Exchange Act.
| | | | | | | | | | | | | | | | | |
| Large Accelerated Filer | | Accelerated Filer | | Non-Accelerated Filer | | Smaller Reporting Company | Emerging Growth Company |
| ☑ | | ☐ | | ☐ | | ☐ | ☐ |
If an emerging growth company, indicate by check mark if the registrant has elected not to use the extended transition period for complying with any new or revised financial accounting standards provided pursuant to Section 13(a) of the Exchange Act. ☐
Indicate by check mark whether the registrant has filed a report on and attestation to its management's assessment of the effectiveness of its internal control over financial reporting under Section 404(b) of the Sarbanes-Oxley Act (15 U.S.C 7262(b)) by the registered public accounting firm that prepared or issued its audit report. ☑
Indicate by check mark whether the registrant is a shell company (as defined in Rule 12b-2 of the Act). Yes ☐ No ☑
Aggregate market value of voting and non-voting common equity held by non-affiliates of the registrant as of June 26, 2020, based upon the closing price of the common stock as reported by the Nasdaq Global Select Market on such date, was $244.5 billion. 4,063 million shares of common stock were outstanding as of January 15, 2021.
DOCUMENTS INCORPORATED BY REFERENCE
Portions of the registrant’s proxy statement related to its 2021 Annual Stockholders' Meeting to be filed subsequently are incorporated by reference into Part III of this Form 10-K. Except as expressly incorporated by reference, the registrant's proxy statement shall not be deemed to be part of this report.
Table of Contents
Organization of Our Form 10-K
The order and presentation of content in our Form 10-K differs from the traditional SEC Form 10-K format. Our format is designed to improve readability and better present how we organize and manage our business. See "Form 10-K Cross-Reference Index" within the Financial Statements and Supplemental Details for a cross-reference index to the traditional SEC Form 10-K format. To reflect our focus on transforming from a PC-centric1 company to a data-centric company, we have presented our data-centric businesses1 first in the "Segment Trends and Results" within MD&A.
We have defined certain terms and abbreviations used throughout our Form 10-K in "Key Terms" within the Financial Statements and Supplemental Details.
The preparation of our Consolidated Financial Statements is in conformity with U.S. GAAP. Our Form 10-K includes key metrics that we use to measure our business, some of which are non-GAAP measures. See "Non-GAAP Financial Measures" within MD&A for an explanation of these measures and why management uses them and believes they provide investors with useful supplemental information.
| | | | | | | | |
| Fundamentals of Our Business | | Page |
Introduction to Our Business | | |
A Year in Review | | |
Our Strategy | | |
Our Capital | | |
| | |
| Management's Discussion and Analysis | | |
Our Products | | |
How We Organize Our Business | | |
Segment Trends and Results | | |
Consolidated Results of Operations | | |
Liquidity and Capital Resources | | |
Contractual Obligations | | |
Quantitative and Qualitative Disclosures About Market Risk | | |
Non-GAAP Financial Measures | | |
| | |
| Other Key Information | | |
Selected Financial Data | | |
Sales and Marketing | | |
| | |
Intellectual Property Rights and Licensing | | |
Critical Accounting Estimates | | |
Risk Factors | | |
Properties | | |
| Market for Our Common Stock | | |
| Information About Our Executive Officers | | |
| Availability of Company Information | | |
| | |
| Financial Statements and Supplemental Details | | |
Auditor's Reports | | |
Consolidated Financial Statements | | |
Notes to the Consolidated Financial Statements | | |
| Key Terms | | |
| Financial Information by Quarter | | |
| Controls and Procedures | | |
| Exhibits | | |
| Form 10-K Cross-Reference Index | | |
1 Intel's definition is included in "Key Terms" within the Financial Statements and Supplemental Details.
Forward-Looking Statements
This Form 10-K contains forward-looking statements that involve a number of risks and uncertainties. Words such as "anticipates," "expect," "intend," "strive," "goals," "plans," "ambitions," "opportunity," "future," "to be," "achieve," "grow," "committed," "believes," "seeks," "targets," "estimated," "continues," "likely," "possible," "may," "might," "potentially," "will," "would," "should," "could," "on track," and variations of such words and similar expressions are intended to identify such forward-looking statements. In addition, any statements that refer to future responses to and effects of COVID-19; projections of our future financial performance; future business, social, and environmental performance, goals, and measures; our anticipated growth and trends in our businesses and operations; projected growth and trends in markets relevant to our businesses; business and investment plans; future products and technology, and the expected regulation, availability and benefits of such products and technology; projected cost and yield trends; expected timing and impact of acquisitions, divestitures, and other significant transactions, including statements relating to the pending divestiture of our NAND memory business to SK hynix Inc. (SK hynix); expected completion of restructuring activities; availability, uses, sufficiency, and cost of capital of capital resources, including expected returns to stockholders such as dividends and share repurchases, and the expected timing of future repurchases; our valuation; future production capacity and product supply; the future purchase, use, and availability of products, components, and services supplied by third parties, including third-party IP and manufacturing services; tax- and accounting-related expectations; LIBOR-related expectations; uncertain events or assumptions, including statements relating to TAM or market opportunity, and other characterizations of future events or circumstances are forward-looking statements. Such statements are based on management's expectations as of the date of this filing, unless an earlier date is specified, and involve many risks and uncertainties that could cause our actual results to differ materially from those expressed or implied in our forward-looking statements. Such risks and uncertainties include those described throughout this report and particularly in "Risk Factors" within Other Key Information. Given these risks and uncertainties, readers are cautioned not to place undue reliance on such forward-looking statements. Readers are urged to carefully review and consider the various disclosures made in this Form 10-K and in other documents we file from time to time with the SEC that disclose risks and uncertainties that may affect our business. Unless specifically indicated otherwise, the forward-looking statements in this Form 10-K do not reflect the potential impact of any divestitures, mergers, acquisitions, or other business combinations that have not been completed as of the date of this filing. In addition, the forward-looking statements in this Form 10-K are made as of the date of this filing, unless an earlier date is specified, including expectations based on third-party information and projections that management believes to be reputable, and Intel does not undertake, and expressly disclaims any duty, to update such statements, whether as a result of new information, new developments, or otherwise, except to the extent that disclosure may be required by law.
Note Regarding Third-Party Information
This Form 10-K includes market data and certain other statistical information and estimates that are based on reports and other publications from industry analysts, market research firms, and other independent sources, as well as management's own good faith estimates and analyses. Intel believes these third-party reports to be reputable, but has not independently verified the underlying data sources, methodologies, or assumptions. The reports and other publications referenced are generally available to the public and were not commissioned by Intel. Information that is based on estimates, forecasts, projections, market research, or similar methodologies is inherently subject to uncertainties, and actual events or circumstances may differ materially from events and circumstances reflected in this information.
* Other names and brands may be claimed as the property of others.
The Bluetooth® word mark and logos are registered trademarks owned by Bluetooth SIG, Inc. and any use of such marks by Intel Corporation is under license.
Intel, 3D XPoint, Arria, Celeron, Intel Agilex, Intel Atom, Intel Core, eASIC, Intel Evo, Intel Inside, the Intel logo, the Intel Inside logo, Intel Optane, Iris, Itanium, Movidius, Myriad, OpenVINO, OpenVino logo, Pentium, Quark, Stratix, Thunderbolt, Tofino, Intel vPro, and Xeon are trademarks of Intel Corporation or its subsidiaries.
| | | | | | | |
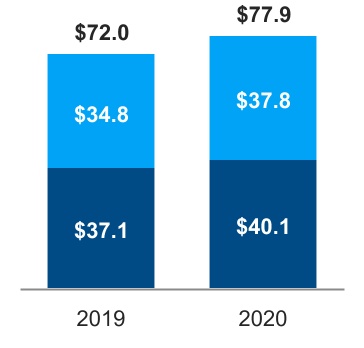
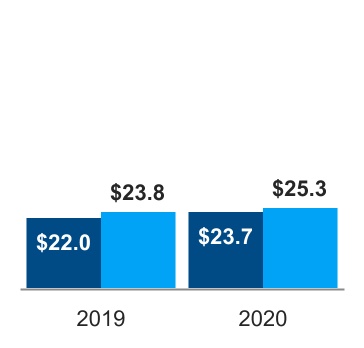
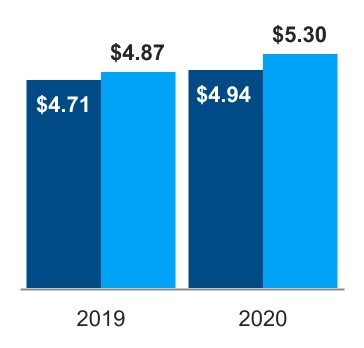
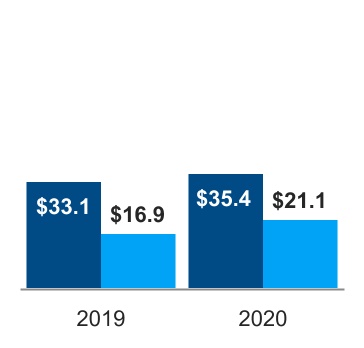
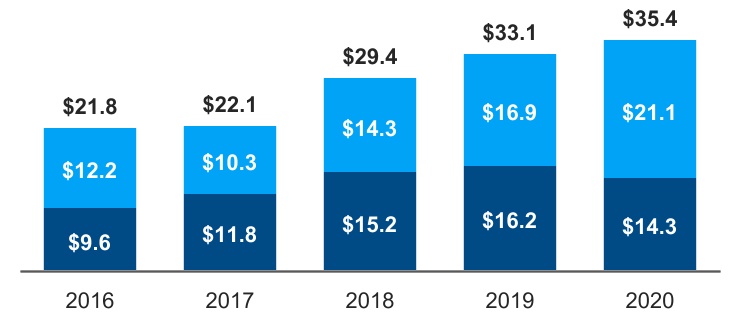
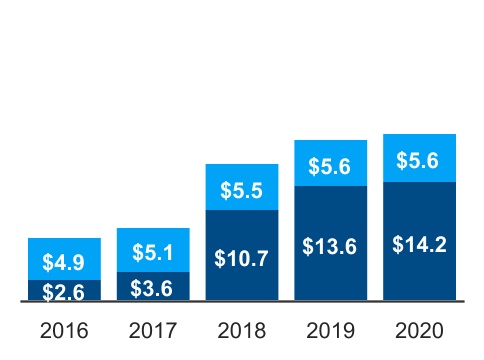
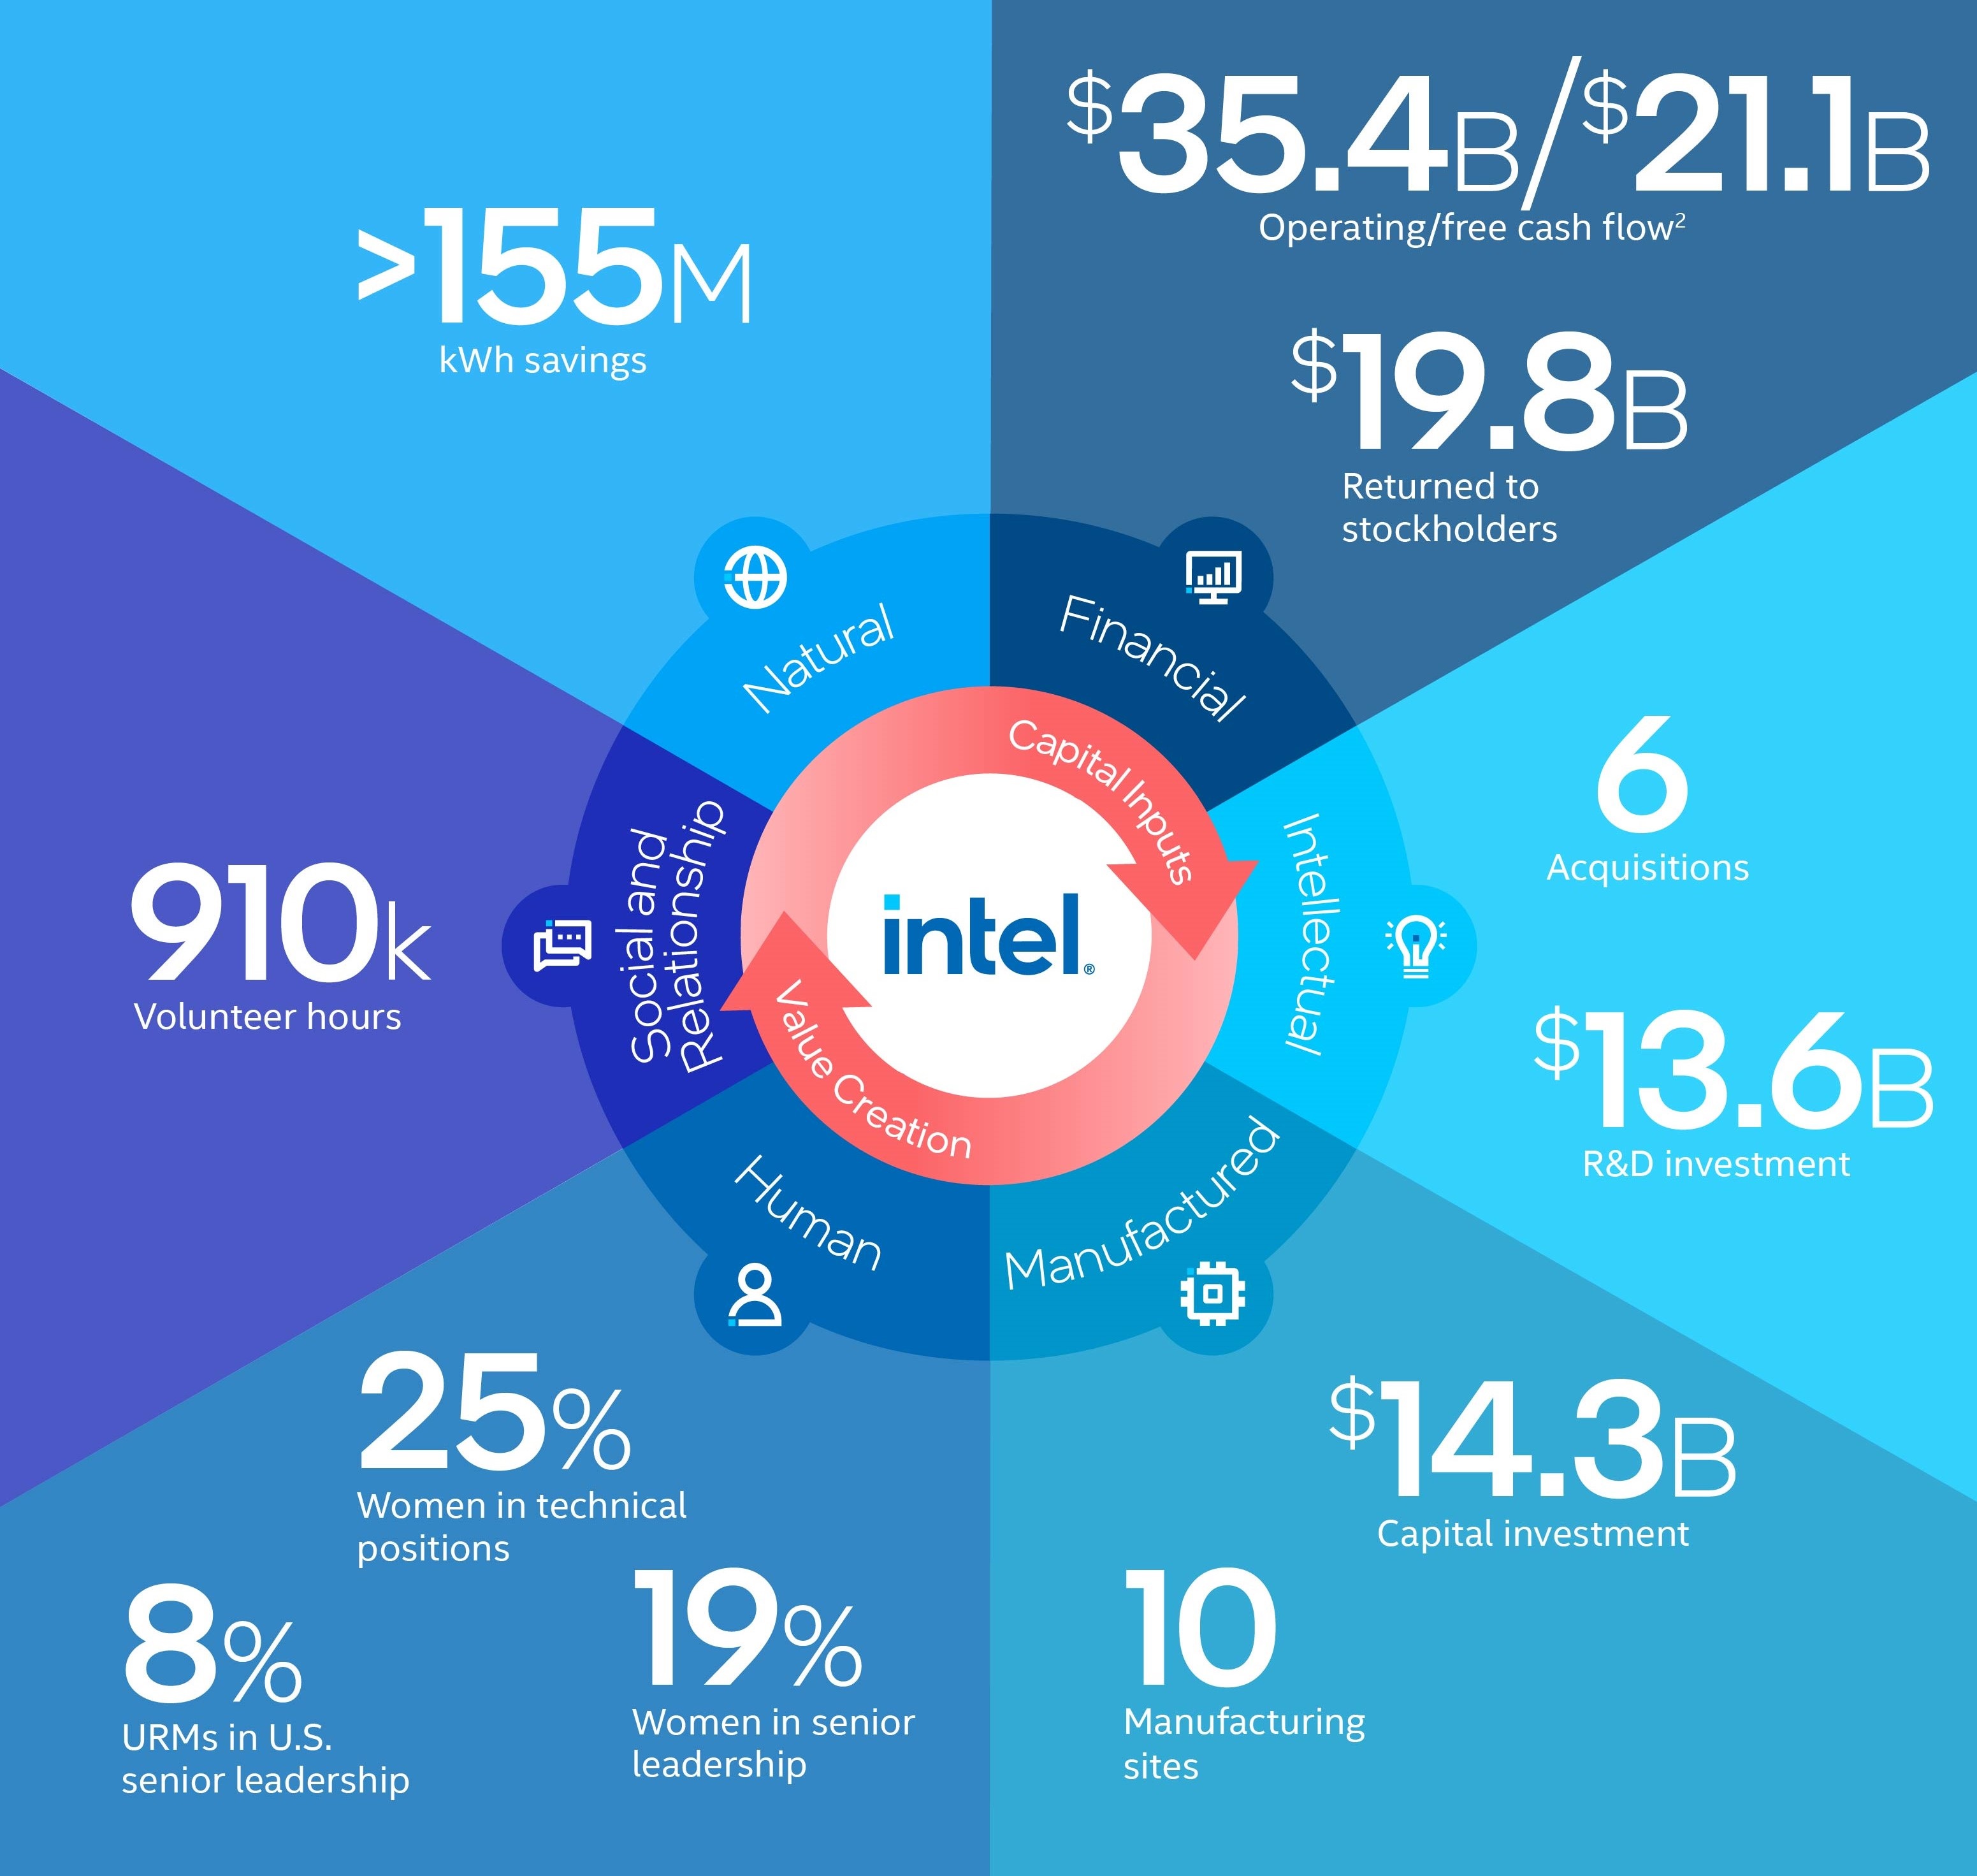
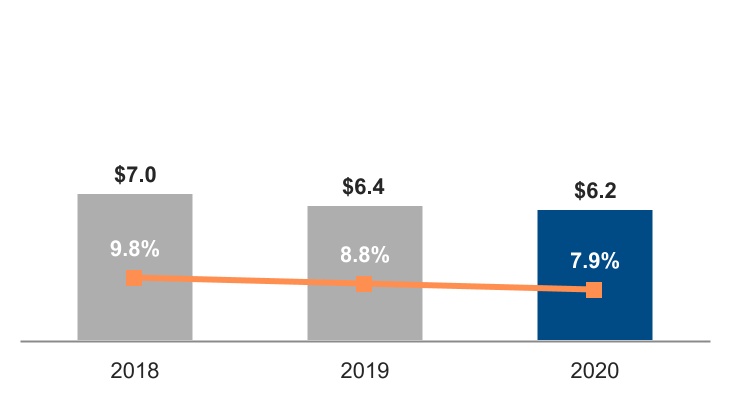
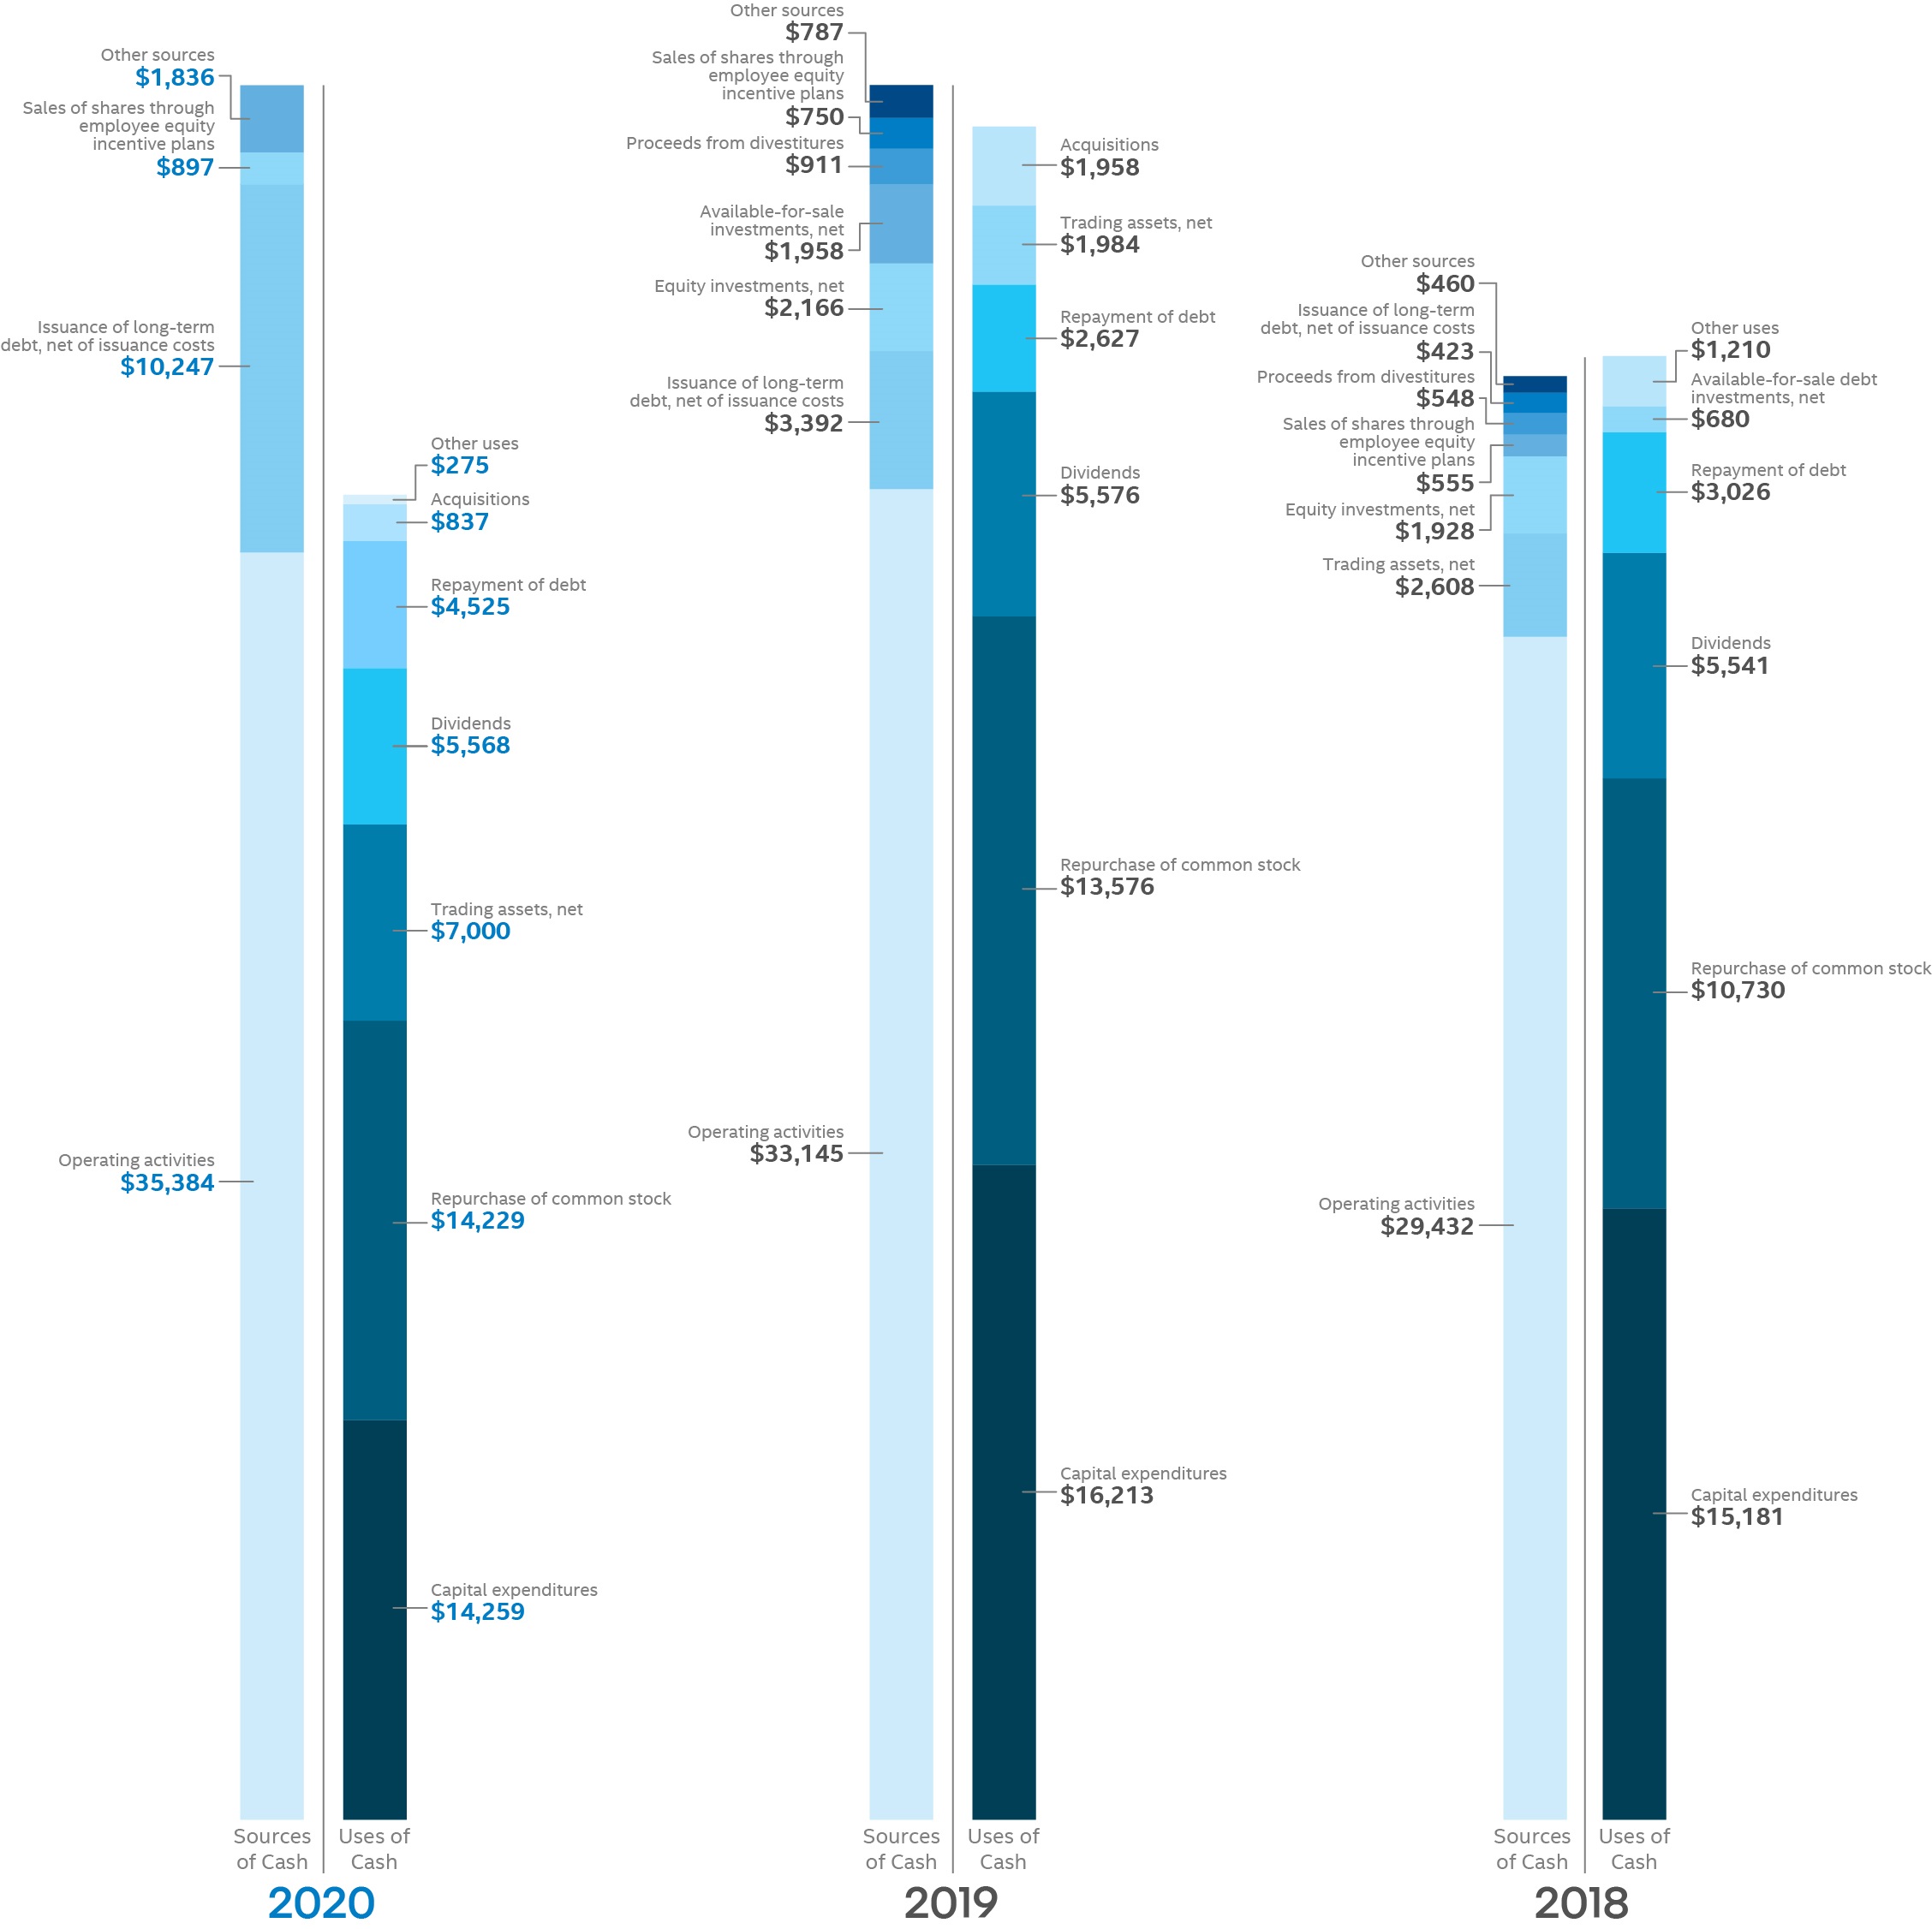
We achieved record revenue of $77.9 billion, with 49% from our data-centric businesses, amid the effects of the COVID-19 pandemic. The dynamic of work and learn from home resulted in strong demand for notebook PCs, while demand for desktop PCs weakened. Demand in the DCG cloud service providers market segment grew, while enterprise and government declined on macroeconomic weakness. We shipped a higher volume of 10nm products than we had anticipated at the beginning of the year. The increased mix of 10nm, combined with a higher portion of revenue from lower margin adjacent businesses, offset higher platform revenue and drove a decline in gross margin of 3 percentage points. We invested $13.6 billion in R&D, reduced our spending to 25.3% of revenue, and signed an agreement to divest our NAND memory business. We made capital investments of $14.3 billion, and generated $35.4 billion cash from operations and $21.1 billion of free cash flow. We also returned $19.8 billion to stockholders, including $5.6 billion in dividends and $14.2 billion in buybacks. | | | |
| |
| | "We achieved record revenue for the fifth consecutive year and maintained a strong balance sheet and liquidity position. Our results amid the challenges of a global pandemic and an uncertain economy reflect the importance of our technology and the resilience of our employees around the world."
—George Davis, Chief Financial Officer |
| | | | | | | | | | | | | | | | | | | | |
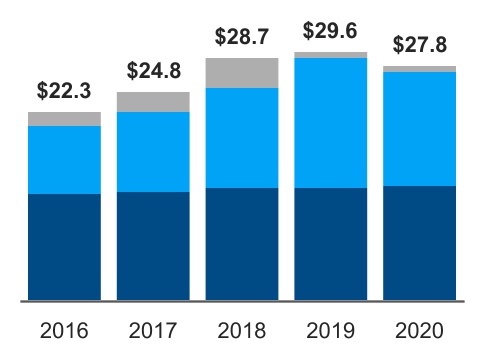
| Revenue | | Operating Income | | Diluted EPS | | Cash Flows |
■ PC-centric $B ■ Data-centric $B | | ■ GAAP $B ■ Non-GAAP $B | | ■ GAAP ■ Non-GAAP | | ■ Operating Cash Flow $B ■ Free Cash Flow1 $B |
,
| | | | | | | | | | | | | | | | | | | | | | | | | | | | | | | | | | | | | | | | | |
| | | | | | |
| $77.9B | | | $23.7B | | $25.3B | | $4.94 | | $5.30 | | $35.4B | | $21.1B |
| | | | |
| GAAP | | | GAAP | | non-GAAP1 | | GAAP | | non-GAAP1 | | GAAP | | non-GAAP1 |
| Revenue up 8% from 2019; Data-centric up 9% and PC-centric up 8% | | Operating income up $1.6B or 7% from 2019; 2020 operating margin at 30% | | Operating income up $1.5B or 6% from 2019; 2020 operating margin at 32% | | Diluted EPS up $0.23 or 5% from 2019 | | Diluted EPS up $0.43 or 9% from 2019 | | Operating cash flow up $2.2B or 7%; operating cash flow to net income at 169% | | Free cash flow up $4.2B or 25%; free cash flow to non-GAAP net income at 94% |
| | | | | | | | | | | | |
Strong demand in notebook PCs and DCG cloud and communications market segments, and NAND pricing recovery, partially offset by weakened demand in desktop PCs and lower platform2 ASPs | | Higher gross margin dollars driven by higher platform unit sales, NAND pricing recovery, and improved NAND unit cost, partially offset by higher platform unit cost with increased 10nm product mix, and lower platform ASPs | | Higher gross margin dollars, lower shares outstanding, and equity investment gains, partially offset by higher effective tax rate | | Working capital changes driven by accounts receivable, inventory and income taxes offset by other assets and liabilities; free cash flow up due to higher operating cash flow and lower capital spending |
| | | | | | | | | | | | | | | | | | | | | | | | | | | | | | | | |
| | | | | | |
Goal (2019 - 2021)3 | | Goal (2019 - 2021)3 | | Goal (2019 - 2021)3 | | Goal (2019 - 2021)3 |
Low single-digit growth over the next three years to $76B-$78B;
data-centric businesses high single- digit growth and PC-centric business approximately flat to slightly down | | Keep non-GAAP operating margin roughly flat at approximately 32% over the next three years | | Grow non-GAAP diluted EPS in line with revenue over the next three years | | Achieve free cash flow of approximately 80% of non-GAAP net income by 2021 |
| | |
| | | | | | | | | | |
| Progress | | Progress | | Progress | | Progress |
Revenue grew 8% from 2019 to 2020, to $77.9B | | Non-GAAP operating margin was 32% in 2020 | | Non-GAAP diluted EPS grew 9% from 2019 to 2020; revenue grew 8% over the same period | | Free cash flow in 2020 was 94% of non-GAAP net income |
1 See "Non-GAAP Financial Measures" within MD&A.
2 See "Our Products" within MD&A.
3 2019-2021 goals were announced during the May 2019 Investor Meeting.
| | | | | | | | |
| Fundamentals of Our Business | 4 |
| | | | | | | | | | | | | | | | | | | | | | |
The COVID-19 pandemic has changed the lives of our employees, our customers, and our community. We are proud of how our team has responded, showing resilience, innovating in real time, and demonstrating the tremendous value of our worldwide manufacturing network to customers and partners around the world. Additionally, we launched our Pandemic Response Technology Initiative, which supports essential workers, hard-hit businesses, and students of all ages with Intel-funded projects led by employees along with our global customers and partners. We have learned vital lessons about the critical role technology can play, and has played, in so many areas during the pandemic—from healthcare and telehealth, to remote learning, to innovative technology solutions to help businesses safely reopen. Most importantly, as a company, we have learned to operate with more empathy, agility, and velocity. We look at our products not for what we know they can do, but for what they might be able to do in a changed world. | | |
Data-Centric Businesses Expand with New Opportunities | | PC-Centric Business Innovates | | |
| Data-centric portfolio for 5G network infrastructure | | 11th Gen Intel® Core™ processors |
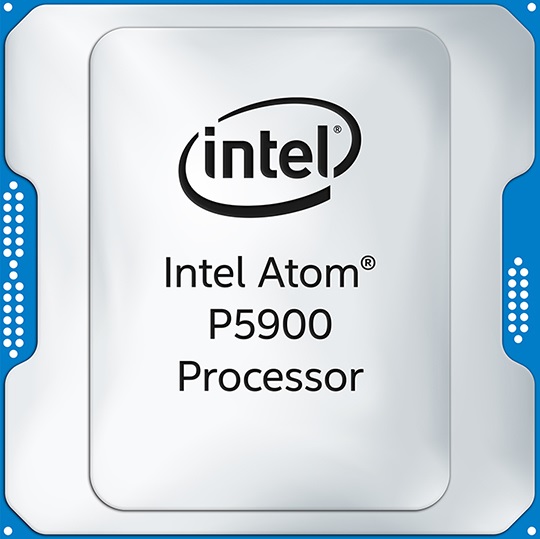
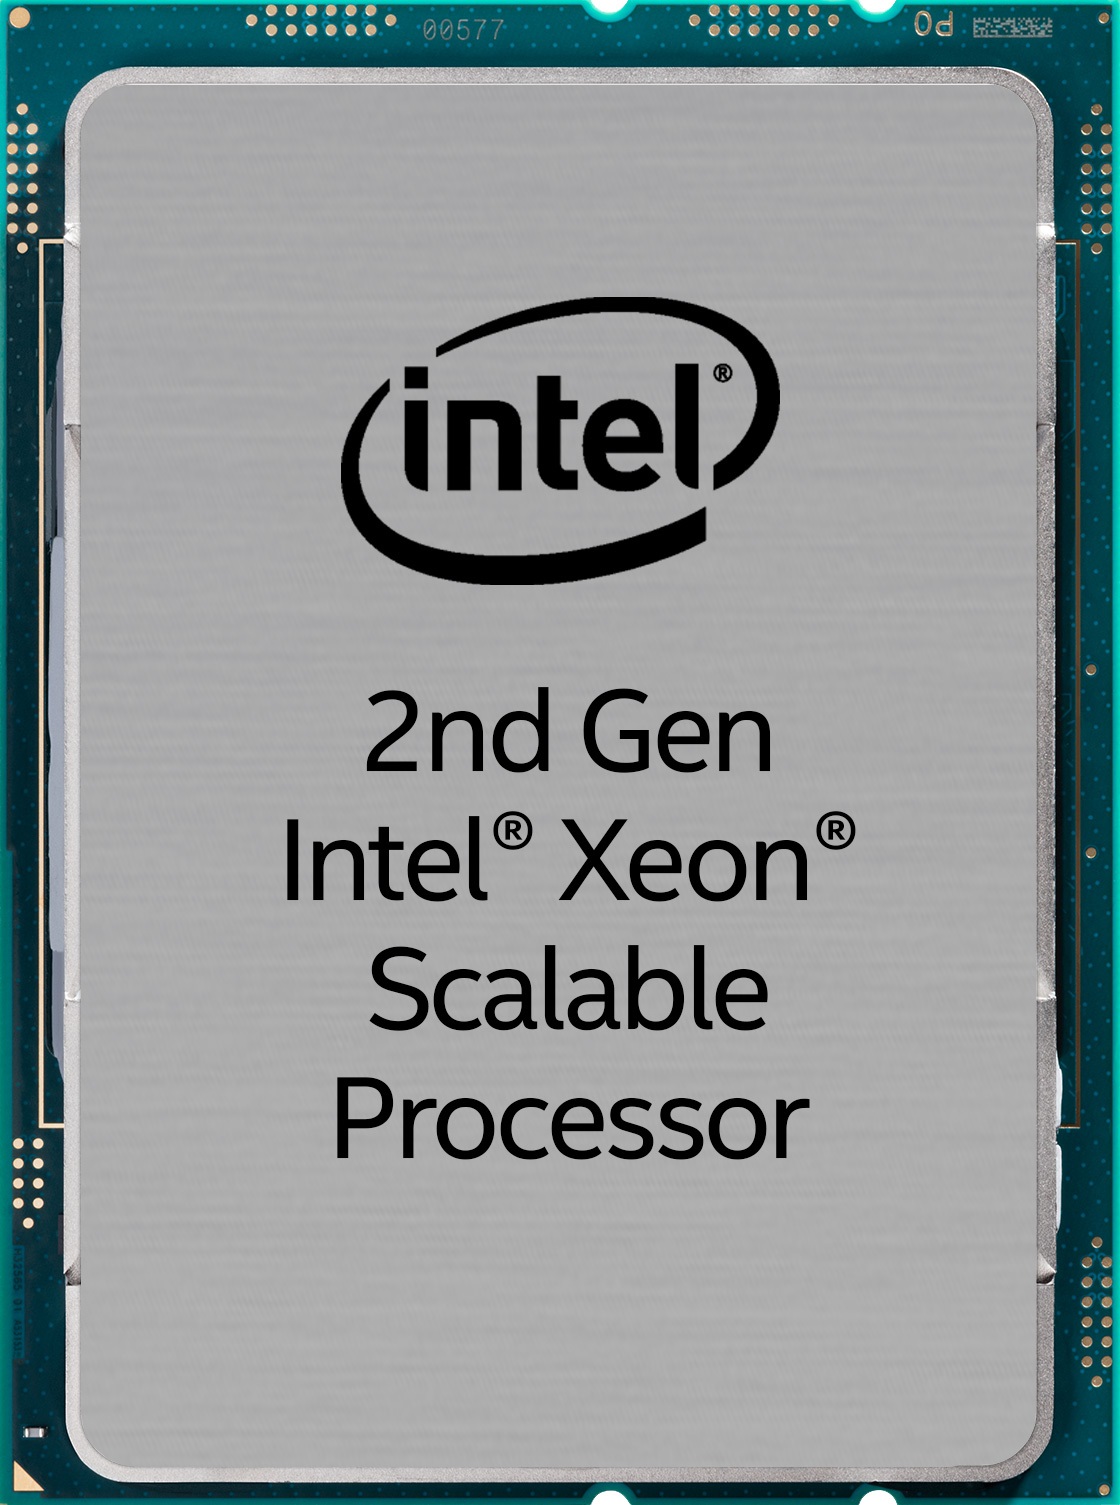
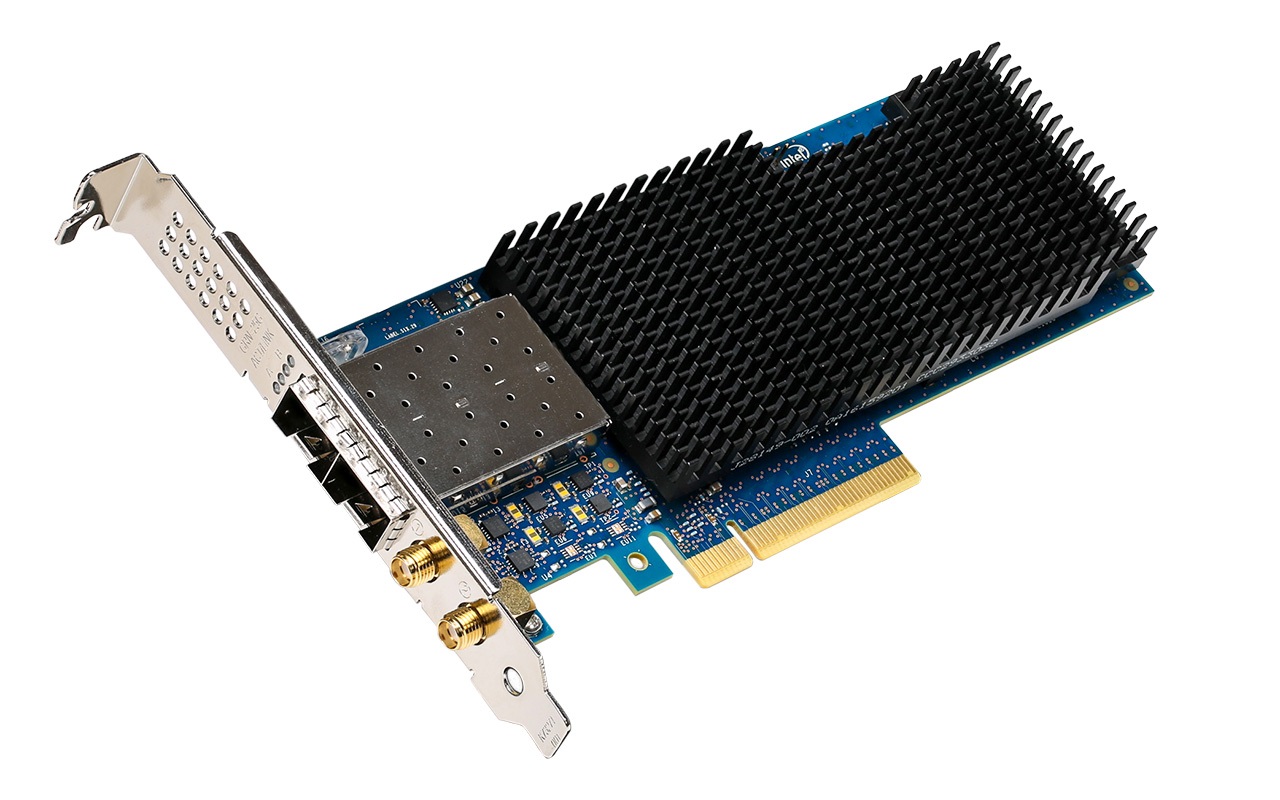
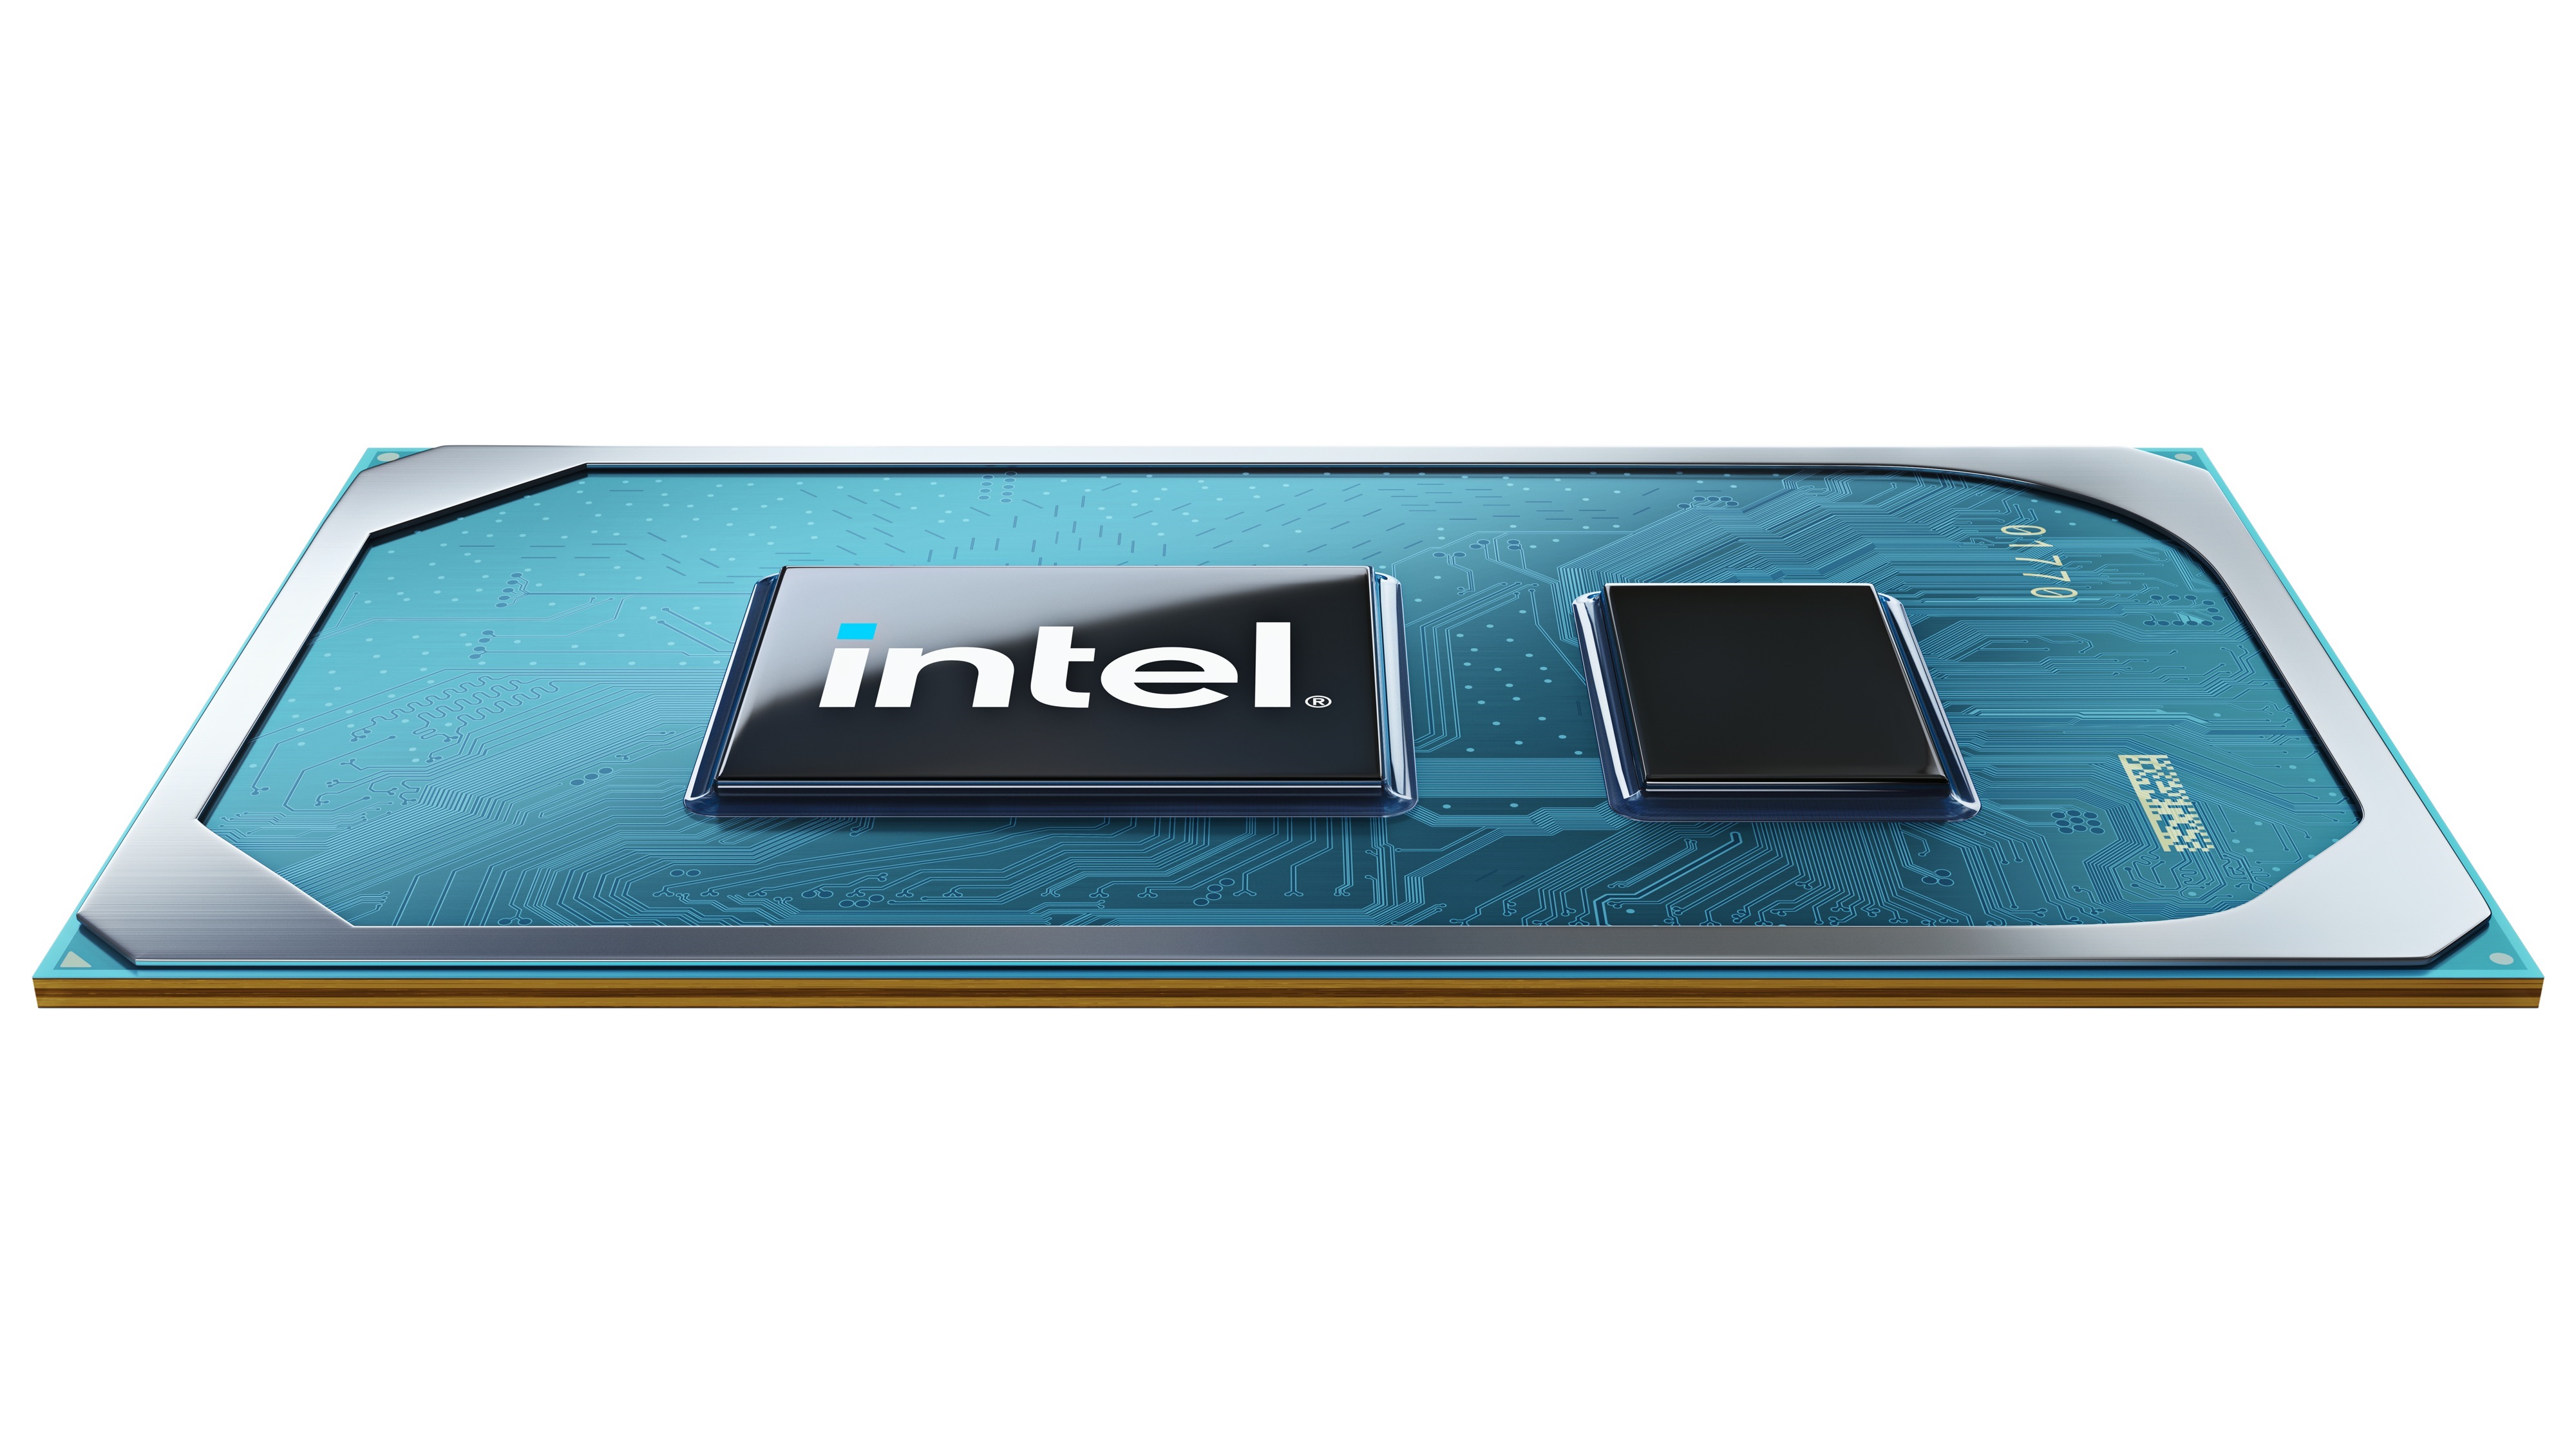
We introduced a broad, data-centric portfolio for 5G network infrastructure, including the Intel® Atom® P5900, our first Intel® architecture-based 10nm SoC for wireless base stations; a next-generation structured ASIC for 5G network acceleration; new 2nd Gen Intel® Xeon® Scalable processors; and the Intel® Ethernet 700 Series Network Adapter with hardware-enhanced Precision Time Protocol, the first 5G network-optimized Ethernet NIC. | | We launched our new processor family for laptops, 11th Gen Intel Core processors with Intel® Iris® Xe graphics leveraging our new 10nm SuperFin process technology. The 11th Gen Intel Core processors optimize power efficiency with leading performance and responsiveness while running at significantly higher frequencies versus prior generations.
| | |
| | |
| | |
| | |
| | | | | | |
| | | |
| | |
| | |
| Ice Lake server processors | | | |
We are now shipping the 10nm-based 3rd Gen Intel Xeon Scalable processors (previously referred to as Ice Lake), which include several architectural, process technology, and platform innovations for performance, security, and operational efficiency. | | Intel® Evo™ platforms | | |
| We introduced the Intel Evo platform brand for designs based on 11th Gen Intel Core processors with Intel Iris Xe graphics. Devices with the Intel Evo platform brand are verified, measured, and tested against specification | | | |
| | |
| | |
| Moovit acquisition | | | |
We acquired Moovit for $915 million to accelerate Mobileye's MaaS offering. Moovit is known for its urban mobility application and brings Mobileye closer to achieving our plan to become a complete mobility provider, including robotaxi services. | | | | |
| | |
| | |
| | |
| Planned divestiture of NAND memory business | | | |
We signed an agreement with SK hynix Inc. (SK hynix), to divest our NAND memory business, including our NAND memory fabrication facility in Dalian, China and certain related equipment and tangible assets (Fab Assets), our NAND SSD business (NAND SSD Business), and our NAND memory technology and manufacturing business (NAND OpCo Business). | | and key experience indicators as part of the next edition of our laptop innovation program, Project Athena. | | |
| | |
| | |
| xPU era with oneAPI and discrete GPUs | | |
We launched discrete GPUs, including the Intel® Iris® Xe MAX GPU for laptops and the first discrete Intel® Server GPU. These are milestone additions to our expanding portfolio of xPUs. We also announced the Gold release of Intel® oneAPI Toolkits, supporting Intel CPUs, GPUs, and FPGAs, which are now available for local installation and for Intel® DevCloud. We are expanding the Intel DevCloud to support the new Intel Iris Xe GPU hardware, including Intel Iris Xe MAX GPU for public access and Intel Iris Xe-HP for select developers. | | |
| |
| |
| 7nm-based CPU products | | |
| We announced in July that our 7nm-based CPU product timing would be delayed and that the primary driver was the yield of our 7nm manufacturing process. We will continue to invest in our future process technology roadmap and advanced packaging technologies to differentiate our products, provide manufacturing optionality and deliver a predictable cadence of leadership products to our customers. | | |
| |
| | | | | | | | |
| | | | | | | | | | | | | |
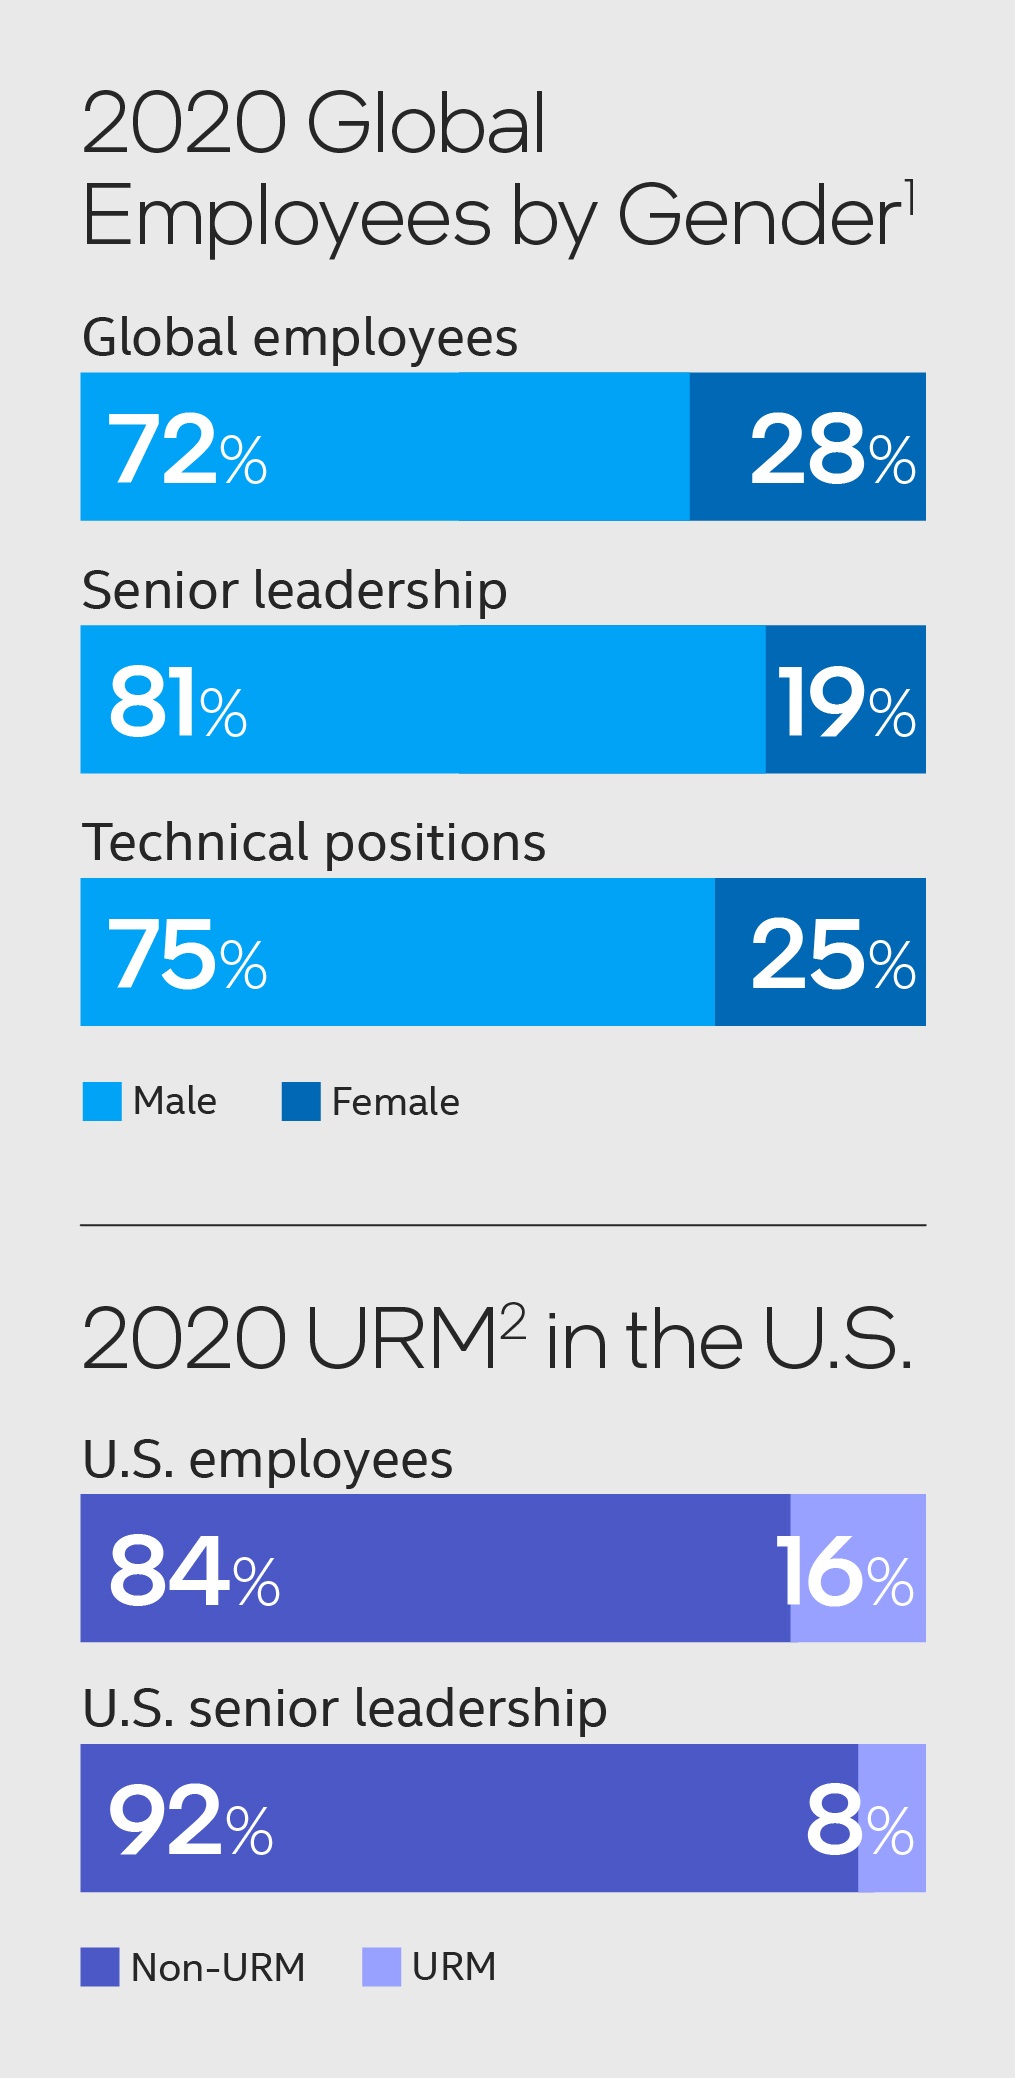
2030 RISE Strategy and Corporate Responsibility Goals | | |
| |
| |
| | | | |
| We created our RISE strategy and established our 2030 corporate responsibility goals (2030 goals), through which we aim to leverage our leadership position in the global technology ecosystem to create a more responsible, inclusive, and sustainable world, enabled through our technology and the expertise and passion of our employees. Our RISE strategy and 2030 goals are deeply rooted in our corporate purpose and aligned with our business strategy to enable us to create value for our customers, investors, employees, and other stakeholders over the next decade and beyond. | |
| |
|
|
| | | | | | | | |
| Fundamentals of Our Business | 5 |
Our strategy is to play a larger role in our customers' success by delivering a predictable cadence of leadership products.
The world is changing and driving the need for exponentially more computing. First we experienced the PC era, followed by the mobile and cloud era. We are now entering the era of distributed intelligence, where computing is pervasive and so many things in our lives—our homes, our cars, our hospitals, and our cities—now function like computers. In this world of distributed intelligence, our three fastest growing opportunities are AI, 5G network transformation, and the intelligent and autonomous edge.
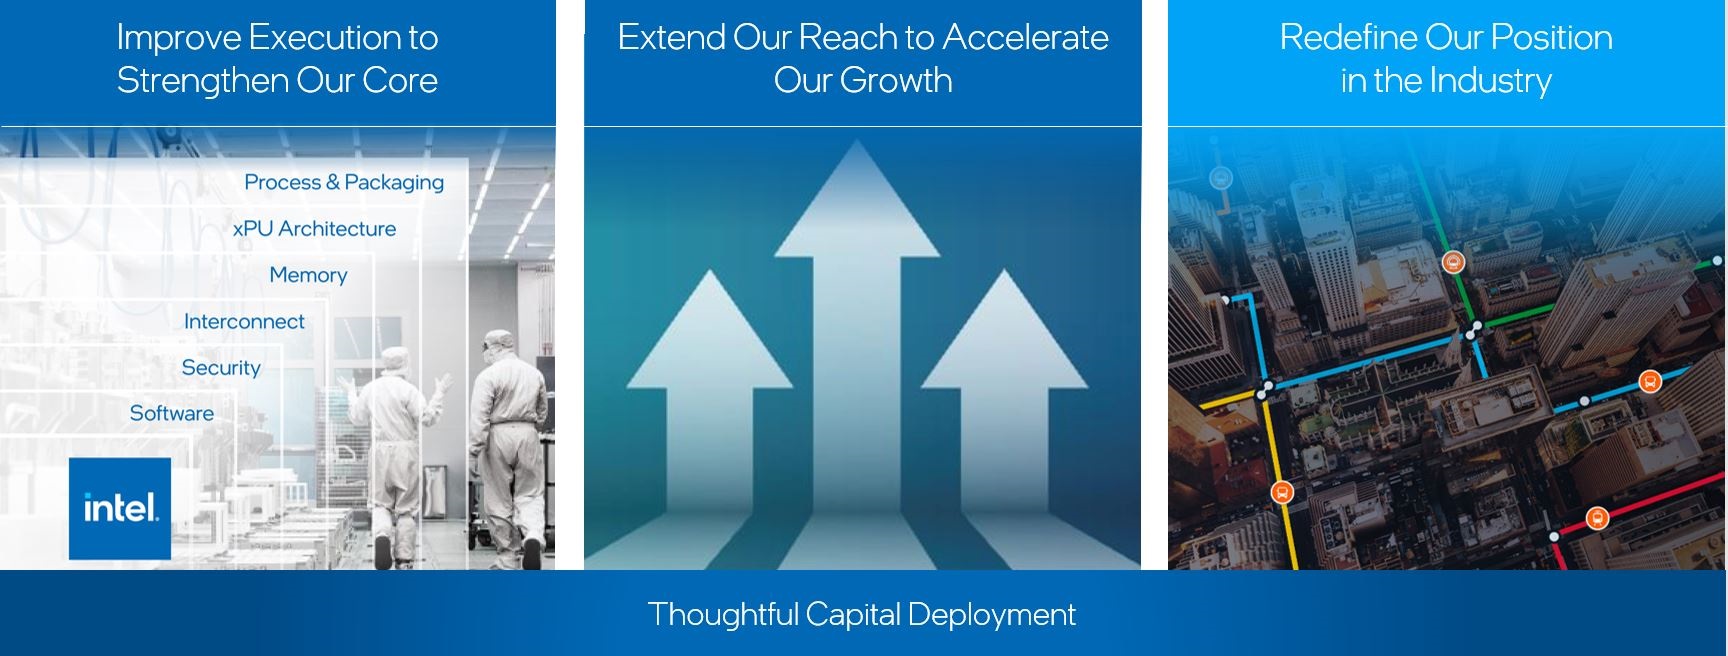
We have a history of transforming to capitalize on market shifts, and we are in the midst of another significant transformation to position ourselves and our customers for growth. With our focus on execution and re-energized culture as a force multiplier, we are transforming from a CPU to a multi-architecture xPU company, from silicon to platforms, and from a traditional IDM to a new, modern IDM. Our priorities are to strengthen our core, extend our reach, and redefine our position in the industry. Our capital provides a foundation to invest in our growth and to supplement and strengthen our capabilities. We are thoughtfully deploying capital and focusing our investment in differentiated technologies where we can play a bigger role in the success of our customers and deliver attractive returns to our stockholders.
Our Priorities
| | |
|
| Improve Execution to Strengthen Our Core |
We have made changes that help position us to sharpen our operational excellence and process technology. We have streamlined our product roadmaps, evolved our technical organization to drive greater transparency and accountability, and exited businesses to enable focus on our core strategy.
Technical talent. Our leadership team has deep technical, engineering, and business expertise and is focused on our opportunities. We are re-energizing our culture to drive better business outcomes for our customers by instilling a growth mindset, increasing accountability around shared company goals, implementing new operational protocols, and renewing a sense of purpose and value to create an environment for innovation and growth.
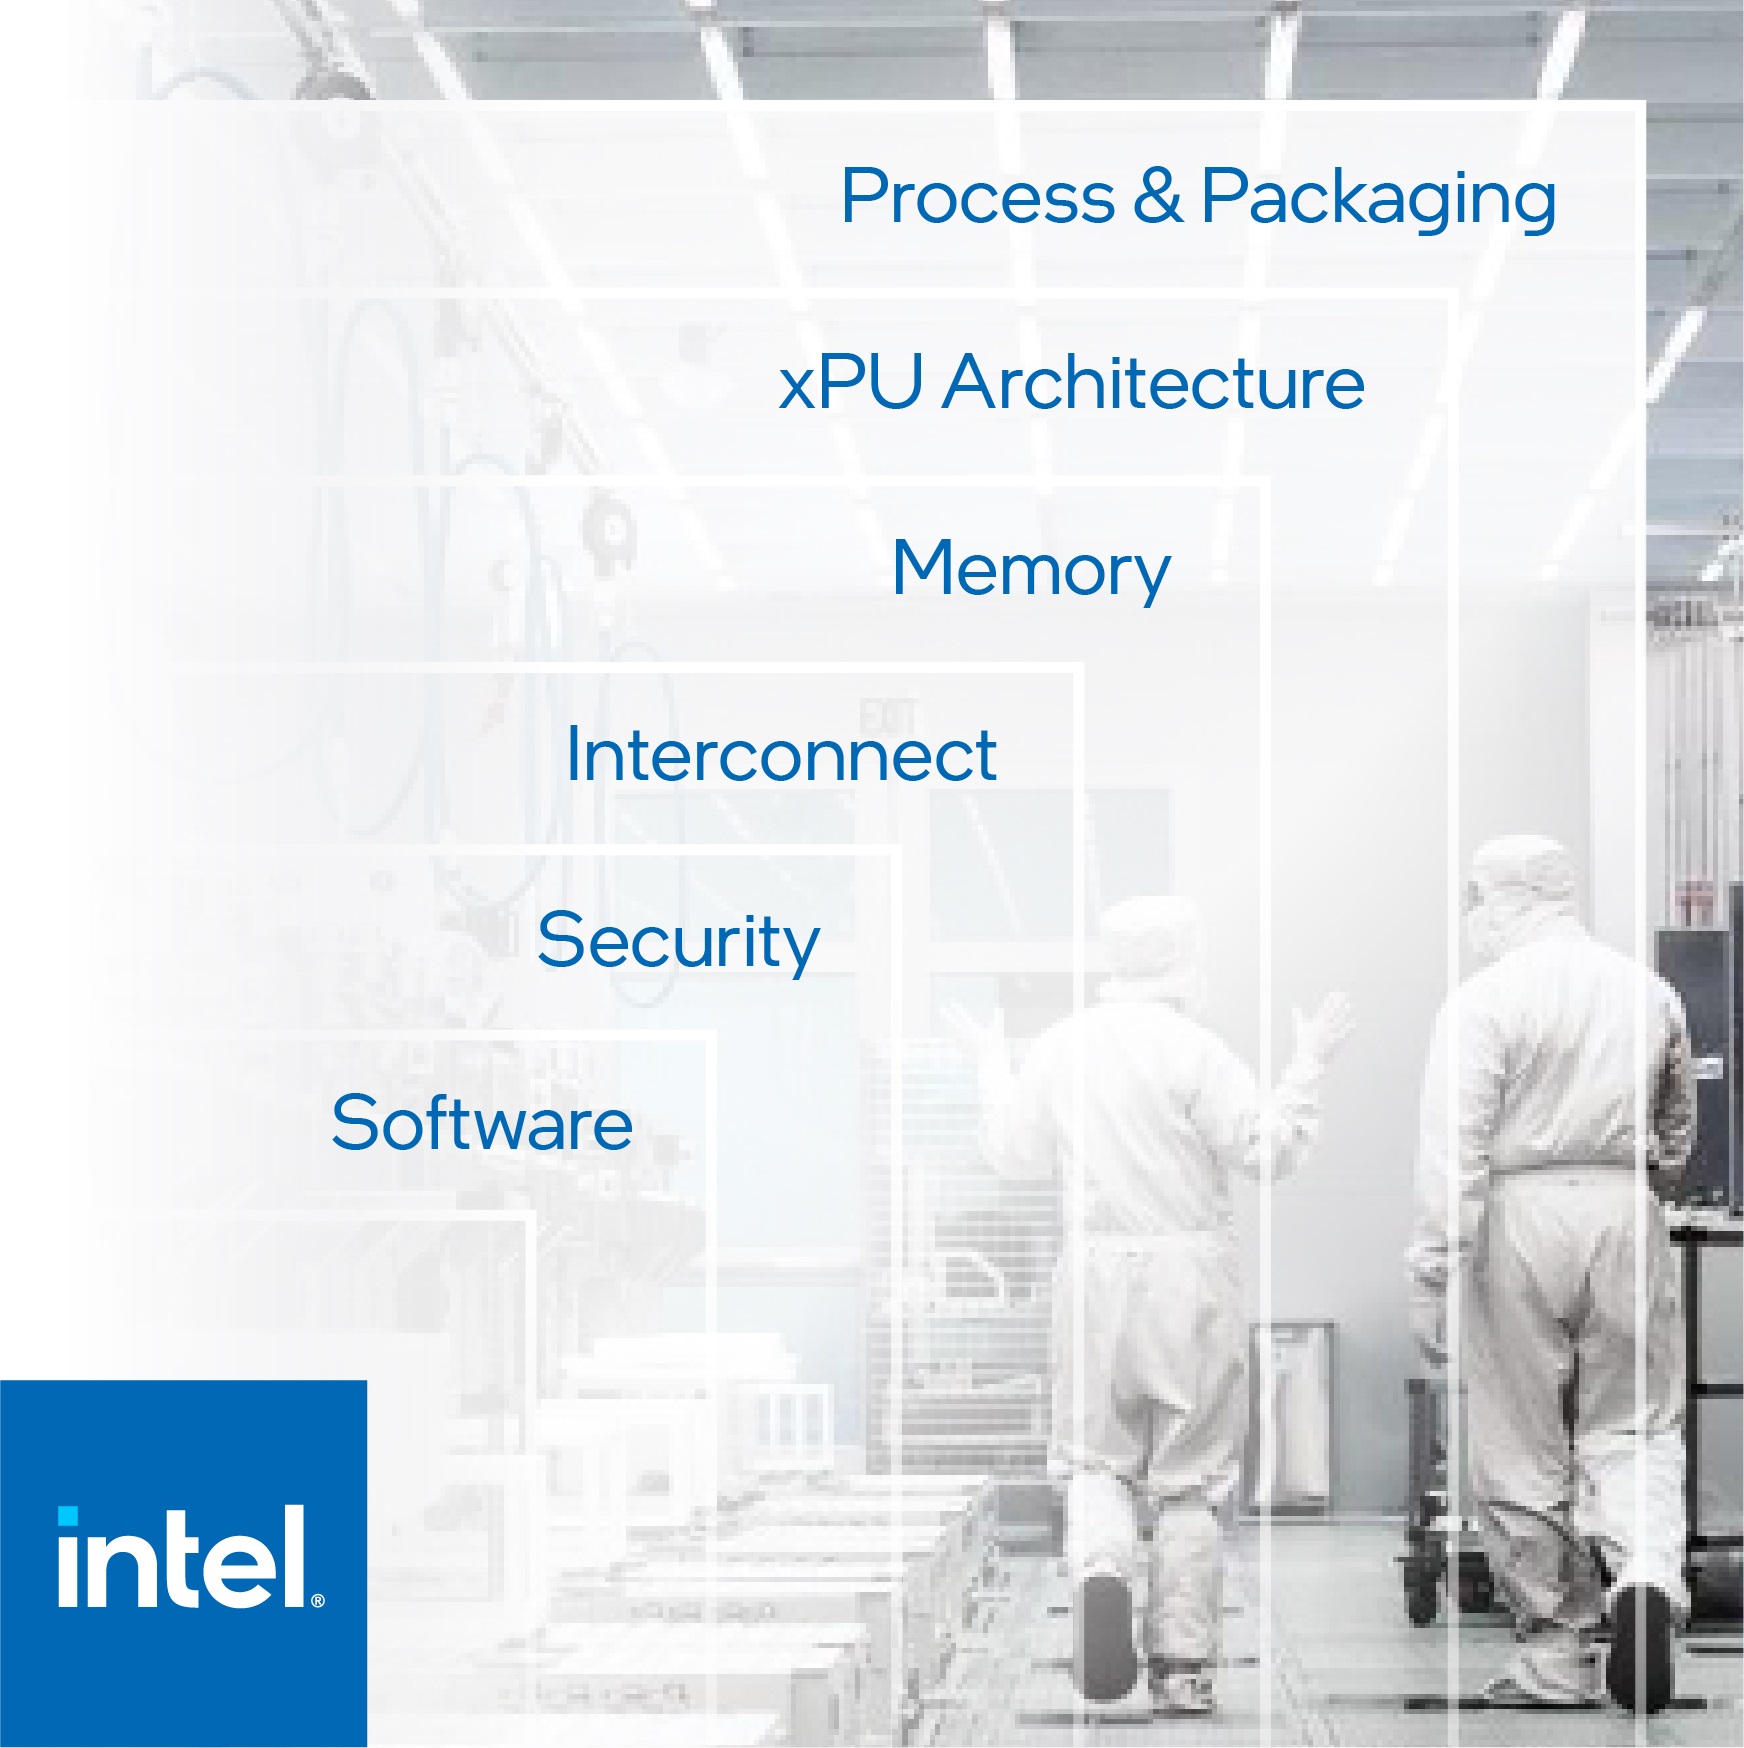
Continuous innovation. To deliver leadership products, we continue to innovate across all of the areas that are key to product leadership: process and packaging, architecture, memory, interconnect, security, and software. With these six areas, we are creating innovative xPU platforms that uniquely serve diverse new workload opportunities, and transforming from silicon to platforms to solve customers' problems through complete solutions offerings.
Predictable cadence. We have made an architectural shift to die disaggregation that, when combined with our differentiated advanced packaging, creates flexibility to use the process that best serves our customers and supports our ability to deliver on a predictable cadence. Disaggregated design allows us to manufacture different components of a chip on different processes: some components can benefit from the greater performance of the latest process node, while others can leverage lower-cost nodes where differentiated performance is not needed. Through disaggregated design, we mix and match architectures, IP, process nodes, and silicon from our own manufacturing facilities or from external foundries.
| | | | | | | | |
| Fundamentals of Our Business | 6 |
New, modern IDM. We are investing to transform our traditional IDM model to adapt to an evolving industry. This means creating greater flexibility to use internal or external foundry processes. It requires that we continue to lead advances in silicon technology by leaning into our expertise and manufacturing scale, while evolving to engage with the ecosystem in new and different ways. It also requires that we leverage our disaggregated design capabilities and continue to manufacture new products with significant cost advantage. We will also continue to invest in process technology development to bring to market the future process nodes and advanced packaging capabilities that create product differentiation and customization, while also enabling manufacturing optionality.
Evolving our engagement with the broader silicon manufacturing and design ecosystem involves working as a strategic partner with equipment vendors, EDA providers, and third-party foundries to help enhance the performance of our manufacturing tools, optimize design software for our processes, simplify design, improve efficiency, and standardize components. This also involves increasing the strategic use of third-party IP for standardized components to allow us to focus on differentiating technology, and updating our design methodologies to support movement of our designs to and from external foundries.
| | |
| Extend Our Reach to Accelerate Our Growth |
Diverse product portfolio to capitalize on the fastest growing opportunities. The proliferation of data analytics, edge computing, and AI is driving a diverse and expanding range of computing applications from edge to cloud. In response, we are innovating to deliver products including a mix of scalar, vector, matrix, and spatial architectures deployed in CPUs, GPUs, accelerators, and FPGAs—unified by an open, industry-standard programming model, oneAPI, to simplify application development.
AI helps our customers make sense of data to unleash its potential. We offer a combination of hardware and software technologies that deliver broad capabilities to support computing, storage, transmission, and tuning in AI. We have taken a multi-architecture approach to AI hardware. Intel Xeon processors provide a foundation for analytics and AI, and software like the OpenVINOTM toolkit significantly simplifies the deployment of solutions. Intel® FPGAs allow customers to access leading AI inferencing performance for their models. Similarly, Intel® MovidiusTM MyriadTM VPUs are purpose-built for AI and support diverse approaches for innovation in a wide range of applications, from healthcare to autonomous driving to facial recognition. Habana's Gaudi* AI training Processor and Goya* AI Inference Processor offer an easy-to-program development environment to help customers deploy and differentiate their solutions as AI workloads continue to evolve with growing demands on computing, memory, and connectivity.
The transition to 5G and the cloudification1 of the network present a significant opportunity. 5G connectivity will transform industries from all business sectors and it continues to be a strategic priority across Intel. We are collaborating with ecosystem and vertical industry partners to define, prototype, test, and deliver 5G standards and solutions. Our 5G efforts are focused on network infrastructure and other data-centric opportunities, and our team has developed a valuable IP portfolio of products designed to support 5G network infrastructure, including the Intel Atom P5900 processor, a next-generation structured ASIC for 5G network acceleration, the new 2nd Gen Intel Xeon Scalable processors, and the Intel® Ethernet 700 Series Network Adapter.
Moving compute to the edge, where data is generated and consumed, provides new insight and revenue from previously untapped data. Our portfolio of products and capabilities positions us well to play a larger role in our customers' success. We are investing in processors with features made for edge workloads. We announced new enhanced Internet of Things capabilities, including 11th Gen Intel Core processors, Intel Atom x6000E series processors, Pentium® processors, and Celeron® N and J series processors, bringing new AI, security, functional safety, and real-time capabilities to edge customers. This year, we announced Mobileye* SupervisionTM, the EyeQ5*-based solution that incorporates an end-to-end engine control unit, surround-view camera array, processors, driving policy, and high-definition maps—all derived directly from our ongoing autonomous vehicle program.
| | | | |
| Redefine Our Position in the Industry | | |
Solve our customers' problems through solutions and platforms. We are expanding beyond the CPU to better solve our customers' problems, and not just deliver parts of the solution. With our xPU portfolio, platform vision, IDM capabilities, and scale, we are able to help our customers tackle their own opportunities. We announced the Intel Evo platform brand powered by 11th Gen Intel Core processors with Intel Iris Xe graphics, representing laptop designs supported by Intel's Project Athena innovation program. In addition, we acquired Moovit to accelerate Mobileye's transformation to a full-stack MaaS provider that can provide hardware, software, sensors, integration, and large-scale services. We are actively evaluating opportunities in software, services, and solutions, in AI, network transformation, and intelligent edge.
1 Intel's definition is included in "Key Terms" within the Financial Statements and Supplemental Details.
| | | | | | | | |
| Fundamentals of Our Business | 7 |
We deploy various forms of capital to execute our strategy in a way that seeks to reflect our corporate values, help our customers succeed, and create value for our stakeholders.
| | | | | | | | | | |
| | | | |
| Capital | Strategy | Value |
| | | | |
| Financial |
| | | Leverage financial capital to invest in ourselves and grow our capabilities, supplement and strengthen our capabilities through acquisitions and strategic investments, and provide returns to stockholders. | We strategically invest financial capital to create long-term value and provide returns to our stockholders in the form of dividends and buybacks. |
| | | | |
| | | | |
| Intellectual |
| | | Invest significantly in R&D and IP to enable us to deliver a predictable cadence of leadership products that move, store, and process data at scale, and extend our reach to accelerate our growth. | We develop IP to enable next-generation products, create synergies across our businesses, expand into new markets, and establish and support our brands. |
| | | | |
| | | | |
| Manufacturing |
| | | Invest timely and at a level sufficient to meet customer demand for current technologies and prepare for future technologies as we evolve our IDM model. | Our manufacturing scope and scale enable us to provide our customers and consumers with a broad range of leading-edge products. |
| | | | |
| Human |
| | | Continue to build a diverse, inclusive, and safe work environment to attract, develop, and retain the talent needed to remain at the forefront of innovation. | Our talented employees enable the development of solutions and enhance the intellectual and manufacturing capital critical to helping our customers win the technology inflections of the future. |
| | | | |
| | | | |
| Social and Relationship |
| | | Build trusted relationships for both Intel and our stakeholders, including employees, suppliers, customers, local communities, and governments. | We collaborate with stakeholders on programs to empower underserved communities through education and technology, and on initiatives to advance accountability and capabilities across our global supply chain, including accountability for the respect of human rights. |
| | | | |
| | | | |
| Natural |
| | | Continually strive to reduce our environmental footprint through efficient and responsible use of natural resources and materials used to create our products. | Our proactive efforts help us mitigate climate and water impacts, achieve efficiencies, and lower costs, and position us to respond to the expectations of our stakeholders. |
2030 RISE Strategy and Corporate Responsibility Goals
Our commitment to corporate responsibility and sustainability leadership is deeply integrated throughout our business. We strive to create an inclusive and positive work environment where every employee has a voice and a sense of belonging, and we are proactive in our efforts to reduce our environmental footprint through efficient and responsible use of natural resources and materials.
We continue to raise the bar for ourselves and leverage our leadership position in the global technology ecosystem to make greater strides in corporate responsibility and apply technology to address social and environmental challenges. Through our new RISE strategy and 2030 goals, we aim to create a more responsible, inclusive, and sustainable world, enabled through our technology and the expertise and passion of our employees. This corporate responsibility strategy is designed to increase the scale of our work through new levels of collaboration with our stakeholders and other organizations; we know that acting alone, we cannot achieve the broad social impact to which we aspire. Details on the results of our 2020 goals and more information on our new 2030 goals are included in our Corporate Responsibility Report1.
1 The contents of our Corporate Responsibility Report are referenced for general information only and are not incorporated by reference in this Form 10-K.
| | | | | | | | | | | |
| Fundamentals of Our Business | Our Capital | 8 |
Our financial capital allocation strategy focuses on building stockholder value. We have returned 95% of free cash flow to investors over the past five years.
| | | |
| Cash from Operating Activities $B |
| | | | | | | | |
| ■ Capital Investment | ■ Free Cash Flow1 |
Our Financial Capital Allocation Decisions Are Driven by Three Priorities
| | | | | | | | | | | | | | | | | | | | | | | | | | |
Invest in the Business | | Acquire and Integrate | | Return Cash to Stockholders |
| Our first allocation priority is to invest in R&D and capital spending to strengthen our competitive position. We are efficiently maintaining our R&D investment as a percentage of revenue and continue to make significant capital investments, increasing our 14nm and 10nm wafer capacity. We also invested in 7nm and future process development. In addition to our own manufacturing capacity, we continue to use third-party foundries to expand the ways we can support our customers. | | Our second allocation priority is to invest in companies around the world that will complement our strategic objectives and stimulate growth of data-centric opportunities. We look for acquisitions that leverage and strengthen our capital and R&D investments. In 2020, we completed various acquisitions to expand our product offerings and the markets we serve. Those acquisitions included Moovit, which accelerates our MaaS offering and brings Mobileye closer to achieving our plan to become a complete mobility provider, including robotaxi services. We take action when investments do not meet our criteria, and in 2020 we divested the majority of our Home Gateway Platform division and signed an agreement to divest our NAND memory business. | | Our third allocation priority is to return cash to stockholders. We achieve this through our dividend and share repurchase programs. In March, we suspended stock repurchases in light of the COVID-19 pandemic and in August we entered into $10.0 billion in ASR agreements in response to our belief that our stock was trading below its intrinsic valuation at that time. In Q1 2021, we intend to complete the remaining $2.4 billion of our $20.0 billion planned repurchases announced in October 2019. During 2020, we paid $5.6 billion in dividends and repurchased $14.2 billion in shares. Our approach has reduced diluted shares outstanding over time. |
| | Dividends Per Share | | | Diluted Shares Outstanding (In Millions) |
| | | | | | |
| | 2020 | $1.32 | | 5% CAGR | 4,232 |
| | 2019 | $1.26 | | 4,473 |
| | 2018 | $1.20 | | 4,701 |
| | | | | | | |
| | | | | | | | | | | | | | | | | |
| R&D and Capital Investments $B | | Acquisitions | | Cash to Stockholders $B |
| | | | | | | | | | | | | | | | | | | | | | | | | | | | | |
| ■ R&D | ■ Logic | ■ Memory | | — # of Acquisitions | ■ Total Spent $B | | ■ Buyback | ■ Dividend |
1 See "Non-GAAP Financial Measures" within MD&A.
| | | | | | | | | | | |
| Fundamentals of Our Business | Our Capital | 9 |
Research and Development
R&D investment is critical for enabling us to deliver a predictable cadence of leadership products and extend our reach to accelerate our growth. Successful R&D efforts can lead to new products and technologies or improvements to existing ones, which we seek to protect through our IP rights. We may augment our R&D initiatives by acquiring or investing in companies, entering into R&D agreements, and directly purchasing or licensing technology.
Areas Key to Product Leadership
Every year we make significant investments in R&D and we have intensified our focus on areas key to product leadership. Our objective is to improve user experiences and value through advances in performance, power, cost, connectivity, security, form factor, and other features with each new generation of products. We are also focused on reducing our design complexity, re-using IP, and increasing ecosystem collaboration to improve our efficiency, including a significant reduction of design rules for future process nodes.
| | | | | | | | | | | |
| |
| |
Process and packaging. We are creating a new wave of compute engines that mix and match different process technologies and then connect them with high-performance, low-power packaging technologies like EMIB1 and Foveros1, the industry's first implementation of stacked processing components. This disaggregated design approach allows us to manufacture different components of a chip on different processes, giving us the flexibility to use the process that best serves our customers. | | |
▪We launched our Intel Core processors with Intel® Hybrid Technology, also referred to as Lakefield, which use Foveros 3D stacking technology to achieve a dramatic reduction in package area. ▪We introduced our 10nm SuperFin Technology, a redefinition of the FinFET with new SuperMIM capacitors. It enables the largest single intranode enhancement in our history. We are planning further 10nm intranode enhancements. xPU architecture. The future is a diverse mix of scalar, vector, matrix, and spatial architectures deployed in CPU, GPU, accelerator, and FPGA | |
sockets, enabled by a scalable software stack and integrated into systems by advanced packaging technology. We are building processors that span four major computing architectures, moving toward an era of heterogeneous computing: |
▪CPU. We started shipping our 11th Gen Intel Core processors, with our next-generation Willow Cove CPU microarchitecture, which includes redesigned caching hierarchy and security enhancements, among other features. These processors also include the next generation of Intel Iris Xe graphics architecture with upgraded 3D performance and media engine capabilities.
▪GPU. We launched the Intel Iris Xe MAX GPU for laptops and the first discrete Intel Server GPU. We also powered on our next-generation GPU for client, referred to as DG2.
▪Accelerator. Habana Gaudi accelerators are at the forefront of AI solutions for data centers. Amazon Web Services announced that Habana Gaudi will be used to power future Amazon Elastic Compute Cloud instances.
▪FPGA. We announced Intel® Stratix® 10 NX and Intel Stratix 10 AX FPGAs, extending our Intel Stratix 10 FPGA family.
Memory. With our Intel® OptaneTM technology, we are developing products to disrupt the memory and storage hierarchy.
▪The Intel Optane DC persistent memory 200 series is available with 3rd Gen Intel Xeon Scalable platforms and will be supported with the Ice Lake server processor. The series is targeted at many workloads, including in-memory AI and analytics, databases, and virtual machine per container density.
Interconnect. We deliver leading technologies that scale across all interconnect layers, spanning on-die, on-package, data center, and long-distance networks.
▪We have a broad portfolio of data center connectivity products, including Intel® Ethernet, Intel® Silicon Photonics Optical Transceivers, and Intel® TofinoTM P4-programmable Ethernet switch ASICs.
▪The new 11th Gen Intel Core processors introduced integrated ThunderboltTM 4 and USB4. Thunderbolt 4, the next-generation universal cable connectivity solution, delivers increased minimum performance, expanded capabilities, and USB4 specification compliance. Thunderbolt 4 enables docks with up to four Thunderbolt ports and universal cables up to 2 meters in length.
1 Intel's definition is included in "Key Terms" within the Financial Statements and Supplemental Details.
| | | | | | | | | | | |
| Fundamentals of Our Business | Our Capital | 10 |
Security. We continue to deliver innovation to the market across foundational security, workload protection, and software reliability. We are working with customers and partners to build a more trusted foundation in a data-centric world.
▪The new 11th Gen Intel Core processors include both TME and Intel® Control-flow Enforcement Technology (Intel® CET) security capabilities. TME provides the capability to encrypt the entirety of the physical memory of a system, while Intel CET delivers CPU-level security capabilities to help protect against common malware attack methods that have been a challenge to mitigate with software alone.
▪We announced Intel® Trust Domain Extensions (Intel® TDX), which enhance control of data security and IP protection for the cloud tenant while helping maintain the cloud service provider's role of managing resources and cloud-platform integrity.
Software. Software unleashes the potential of our hardware platforms across all workloads, domains, and architectures.
▪We released the oneAPI open industry specification and launched the Gold release of Intel's oneAPI toolkits in support of our xPU roadmap. Our oneAPI toolkits enable developers to build cross-architecture applications using a single-code base across xPUs that take advantage of unique hardware features and lower software and maintenance cost. Developers can choose the best architecture for the problem they are solving without needing to rewrite software for different architectures and platforms.
▪The OpenVINO toolkit brings the full power of our xPU roadmap to the Internet of Things, client, and data center businesses. This complementary production-level toolkit focuses on helping developers deliver high-performance deep learning inference and computer vision across CPU, GPU, and FPGA products.
IP Rights
We own and develop significant IP and related IP rights around the world that support our products, services, R&D, and other activities and assets. Our IP portfolio includes patents, copyrights, trade secrets, trademarks, mask work, and other rights. We actively seek to protect our global IP rights and to deter unauthorized use of our IP and other assets. For a detailed discussion of our IP rights, see "Intellectual Property Rights and Licensing" within Other Key Information.
| | | | | | | | |
| "In addition to pledging funds, Intel gave COVID-19 scientists and researchers free access to our vast worldwide intellectual property portfolio this year in the hope and belief that making this intellectual property freely available to them will save lives. We will continue to invent—and protect—our intellectual property, but we offered it freely to those working to protect people from the pandemic."
—Steve Rodgers, Executive Vice President and General Counsel |
We are transforming from a traditional IDM to a modern IDM by investing to lead advances in silicon technology, leaning into our expertise and manufacturing scale, while evolving to engage with the ecosystem and leveraging our disaggregated design capabilities. Unlike many other semiconductor companies, we primarily design and manufacture our products in our own manufacturing facilities and we will continue to integrate engineering and manufacturing to provide new products with significant cost advantage. At the same time, our architectural shift to die disaggregation allows us to mix and match architectures, IP, process nodes, and silicon that creates increasing flexibility for our products.
In developing new generations of manufacturing process technology, we seek to realize the benefits from Moore's Law, a law of economics predicted by our co-founder Gordon Moore more than 50 years ago. Realizing Moore's Law can create economic benefits as we are able to either reduce a chip's cost as we shrink its size, or increase functionality and performance of a chip while maintaining the same cost with higher density. This makes possible the innovation of new products with higher performance while balancing power efficiency, cost, and size to meet customers' needs. Our ability to optimize and apply our manufacturing expertise to deliver more advanced, differentiated products has been foundational to our success and is a continued focus of our investments.
| | | | | |
| "The IDM model has been foundational to Intel's success as a global leader in semiconductor manufacturing by enabling product optimization, improved economics, and supply assurance. We are committed to be the supplier of choice for achieving best-in-class performance and to deliver world-changing products on a predictable cadence for our customers."
—Keyvan Esfarjani, Senior Vice President and General Manager of Manufacturing and Operations |
|
We shipped higher volumes of 10nm products in 2020 than we had anticipated at the beginning of the year. We also launched our 11th Gen Intel Core processors with new 10nm SuperFin Technology.
We announced in July 2020 that our 7nm-based CPU product timing would be delayed and that the primary driver was the yield of our 7nm manufacturing process. We will continue to invest in our future process technology roadmap and advanced packaging technologies to differentiate our products, provide manufacturing optionality and deliver a predictable cadence of leadership products to our customers.
| | | | | | | | | | | |
| Fundamentals of Our Business | Our Capital | 11 |
| | | | | |
| "Our goal is to enable leadership products for Intel by delivering predictable process and packaging technology innovation."
—Ann Kelleher, Senior Vice President and General Manager of Technology Development |
|
Network and Supply Chain
Our global supply chain supports internal partners across architecture, product design, technology development, manufacturing and operations, sales and marketing, and business units, with the goal of enabling product and process leadership, industry-leading total cost of ownership, and uninterrupted supply for our customers. Our supply chain ecosystem comprises thousands of suppliers globally. Our worldwide site expansion projects remained on track despite disruptions from the COVID-19 pandemic. In addition to our own manufacturing capacity, we continue to use third-party foundries to expand the ways in which we can support our customers. These third-party solutions complement our manufacturing and provide additional flexibility. Our world-class safety standards and supply chain operations, including our robust risk management and crisis response model, have to date allowed our worldwide factory and supply chain network to continue to operate safely and with mostly on-time deliveries despite the pandemic.
| | | | | | |
| |
| | "As Intel pursues an expanded data-centric market, our collaboration with our wide-ranging supplier ecosystem is deeper, more vibrant, and farther reaching than ever. Together with the ecosystem, we are focused on enabling technology advancements to deliver uninterrupted supply of leadership products to our customers."
—Dr. Randhir Thakur, Corporate Vice President and Chief Supply Chain Officer |
|
The majority of our logic wafer manufacturing is conducted in the U.S. We have 10 manufacturing sites—six are wafer fabrication, three are assembly/test facilities, and our Costa Rica site added in 2020 is a test-only site. The following map shows our present factory sites and the countries where we have a significant R&D and/or sales presence. In response to COVID-19, we quickly made operational changes and adopted measures to enable a continued safe environment for our employees and operation of our manufacturing sites.
Our manufacturing facilities are primarily used for silicon wafer manufacturing, assembling, and testing of our platform and memory products. We operate in a network of manufacturing facilities integrated as one factory to provide the most flexible supply capacity, allowing us to better analyze our production costs and adapt to changes in capacity needs. Our new process technologies are transferred identically from a central development fab to each manufacturing facility. After transfer, the network of factories and the development fab collaborate to continue driving operational improvements. This enables fast ramp of the operation, fast learning, and better quality control.
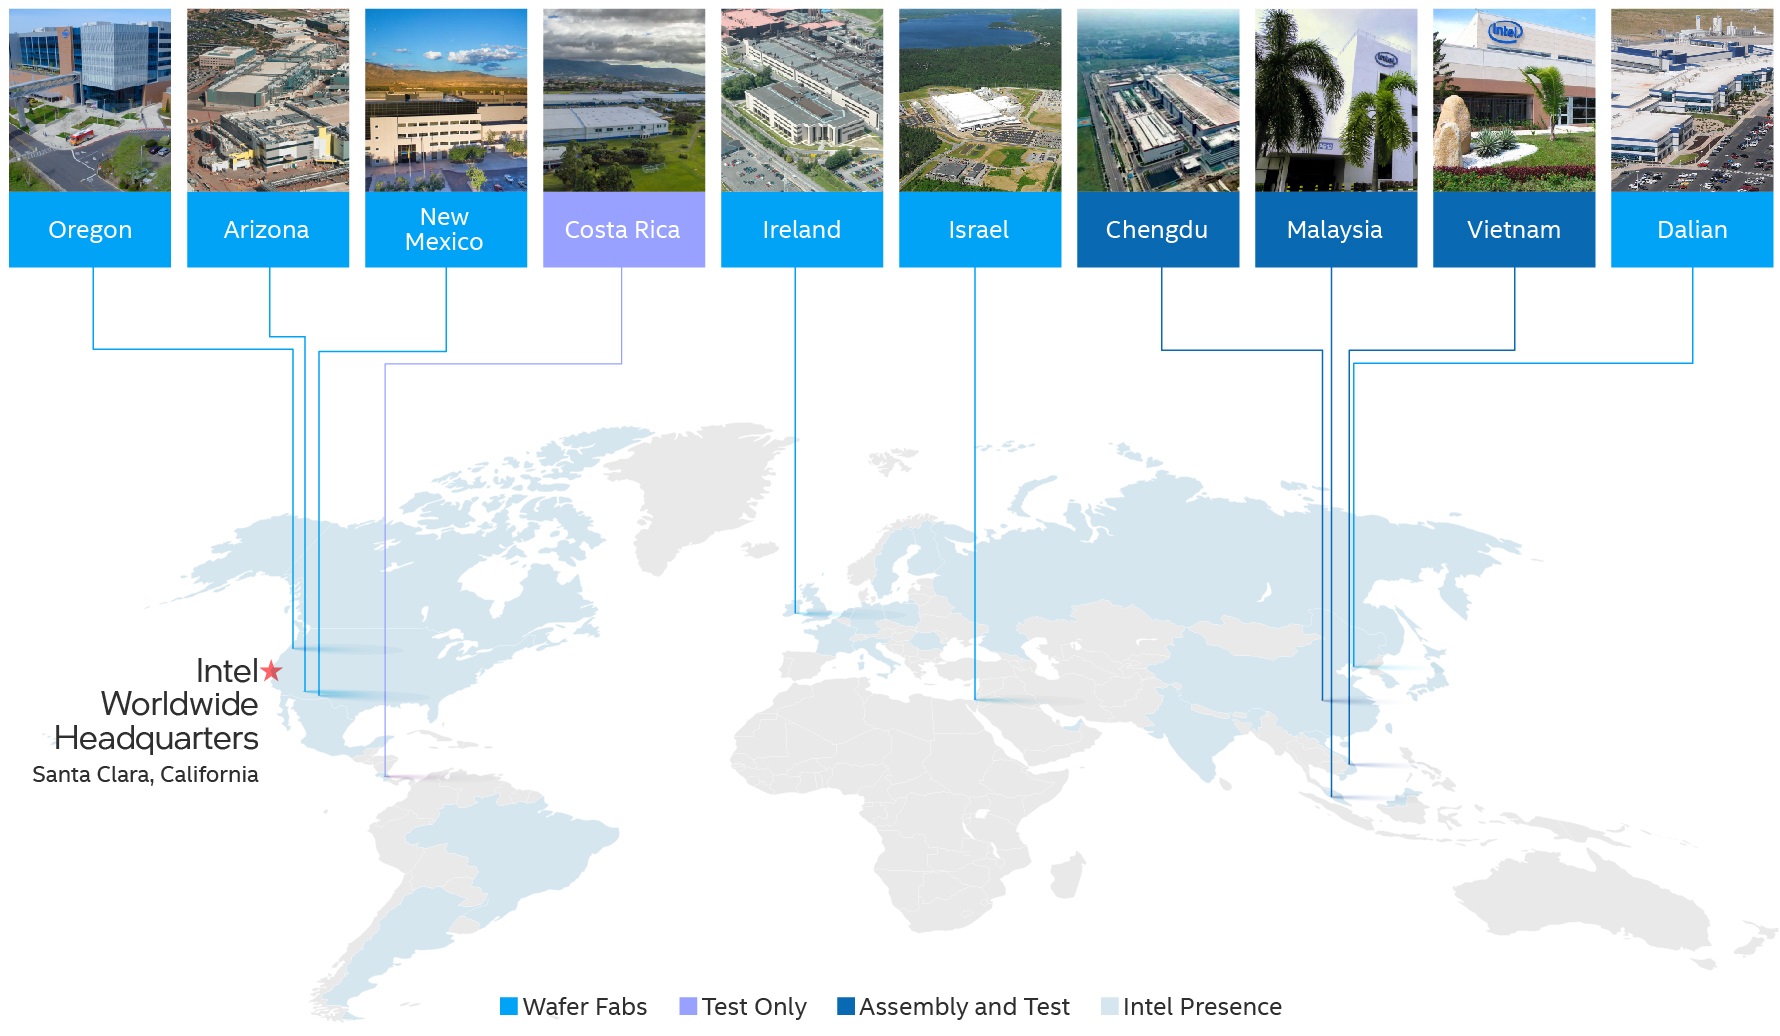
Our NAND memory fabrication facility in Dalian, China is included in the transaction entered into with SK hynix to divest our NAND memory business, and is part of the NAND assets held for sale as of December 26, 2020. Our Intel Optane memory business is expressly excluded from this transaction. The next generations of Intel Optane technology and SSDs are being developed in New Mexico following the sale of our non-controlling interest in IMFT to Micron Technology, Inc. (Micron) in 2019. We will continue to purchase product manufactured by Micron under our supply agreement, which includes the next generation of Intel® 3D XPointTM technology.
| | | | | | | | | | | |
| Fundamentals of Our Business | Our Capital | 12 |
Culture is critically important to Intel's success. We are re-energizing our culture to deliver on our corporate purpose and to attract, develop, and retain top talent needed to build transformative products and services that help our customers succeed in an increasingly data-driven world. We invest in our highly-skilled global workforce of 110,600 people by seeking to create a diverse, inclusive, and safe work environment where our employees can learn, innovate, and deliver their workplace best every day.
Our values—fearless, inclusion, customer-obsessed, one Intel, truth and transparency, and quality—guide how we make decisions, treat each other, and serve our customers. All employees are responsible for upholding these values, the Intel Code of Conduct, and Intel's Global Human Rights Principles, which form the foundation of our policies and practices and ethical business culture.
| | | | | | | | |
| | | |
| | | | |
| | "People with diverse perspectives, experiences, and input are critical to Intel’s innovation, playing important roles in key projects and programs across the company. An essential element of our growth strategy is to build a culture that empowers and inspires employees to collaborate and create, as we strive to become the most inclusive workplace on the planet."
—Sandra Rivera, Executive Vice President and Chief People Officer
| | |
| | | | | | | |
| Inclusion | | | |
Diversity and inclusion are core to Intel's values and instrumental in driving innovation and delivering stronger business growth. We achieved our 2020 goal of full representation in our U.S. workforce two years ahead of schedule, the result of an integrated strategy focused on hiring, retention, and progression. We are proud of what we have accomplished to advance diversity and inclusion, but we recognize we still have work to do, including beyond the walls of Intel. Our RISE strategy and 2030 goals set our global ambitions for the next decade, including doubling the number of women in senior leadership; exceeding 40% female representation in technical roles, including engineering positions and other roles with technical job requirements; increasing the percentage of employees who self-identify as having a disability to 10%; and ensuring accountability for embedding inclusive leadership practices across our business. Our goals also include doubling the number of underrepresented minorities in U.S. senior leadership. To drive accountability, we continue to link a portion of our executive and employee compensation to diversity and inclusion metrics. Today's greatest challenges require a shared commitment to a plan and meaningful action. That is why we have committed our scale, expertise, and reach through our comprehensive RISE strategy to work with customers and other stakeholders to accelerate the adoption of inclusive business practices across industries. We are creating and implementing a Global Inclusion Index and convening a coalition of companies to focus on unified goals and metrics that will be shared through the index. This collective effort will allow the industry to more clearly identify actions needed to advance progress. We will also continue to collaborate on initiatives that expand the diverse pipeline of talent for our industry, advance social equity, make technology fully inclusive, and expand digital readiness for millions of people around the world. | | |
| |
| |
| |
| |
| |
| |
Compensation and Benefits
We strive to provide pay, benefits, and services that help meet the varying needs of our employees. Our total rewards package includes market-competitive pay, broad-based stock grants and bonuses, an employee stock purchase plan, healthcare and retirement benefits, paid time off and family leave, parent reintegration, fertility assistance, flexible work schedules, sabbaticals, and on-site services. Since 2019, we have achieved gender pay equity globally and we continued to maintain race/ethnicity pay equity in the U.S. We achieve pay equity by closing the gap in average pay between employees of different genders or race/ethnicity in the same or similar roles after accounting for legitimate business factors that can explain differences, such as location, time at grade level, and tenure. We also advanced transparency in our pay and representation data by publicly releasing our EEO-1 survey pay data in 2019. Although the U.S. Equal Employment Opportunity Commission did not require employers to file EEO-1 survey pay data in 2020 due to COVID-19, we felt it was important to continue collecting the data and to disclose it publicly in 2020. We believe that our holistic approach toward pay equity, representation, and creating an inclusive culture enables us to cultivate a workplace that helps employees develop and progress in their careers at all levels.
To aid and support employees during COVID-19, we are investing more than $100 million in additional benefits, including special recognition for employees working on site. We also put in place a telecommuting reimbursement program to help employees required to work from home improve their workspaces, and increased flexibility in our leave programs to support employees caring for children and others.
1 Senior leadership refers to salary grades 10+ and equivalent grades. While we present male and female, we acknowledge this is not fully encompassing of all gender identities.
2 The term underrepresented minority (URM) is used to describe diverse populations, including African American, Hispanic, and Native American employees in the U.S.
| | | | | | | | | | | |
| Fundamentals of Our Business | Our Capital | 13 |
Growth and Development
We invest significant resources to develop the talent needed to remain at the forefront of innovation and make Intel an employer of choice. We offer extensive training programs and provide rotational assignment opportunities. We implemented a new performance management system to support our culture evolution and to increase focus on continuous learning and development. Through our regular Employee Experience Surveys, employees can voice their perceptions of the company and their work experience, including learning and development opportunities. Our undesired turnover rate was 4% in 2020.
Health, Safety, and Wellness
Our commitment in Intel's Environmental, Health, and Safety Policy is to provide a safe and injury-free workplace. We continually invest in programs designed to improve physical, mental, and social well-being. We provide access to a variety of innovative, flexible, and convenient health and wellness programs, including on-site health centers, which were increasingly critical this year for our essential workers who have worked on site since the start of the COVID-19 pandemic. Throughout our response to COVID-19, our priority has remained protecting the health and safety of our employees. Intel's Pandemic Leadership Team—which has been in place for 15 years—regularly reviews and adapts our policies based on evolving research and guidance related to the virus. In support of our 2030 goals, we will continue to build our strong safety culture and drive global expansion of our corporate wellness program through continued employee education and engagement activities.
| | | | | |
| Social and Relationship Capital |
We are committed to engaging in corporate responsibility and sustainability initiatives that support our communities and help us develop trusted relationships with our stakeholders. Proactive engagement with our stakeholders and investments in social impact initiatives, including those aligned with the United Nations Sustainable Development Goals, advance our position as a leading corporate citizen and create shared value for Intel, our global supply chain, and our communities.
Economic and social. The health of our business and local economies depends on continued investments in innovation. We provide high-skill, high-paying jobs around the world. Many of these are manufacturing and R&D jobs located in our own domestic and international factories. We also benefit economies through our R&D ecosystem spending, sourcing activities, consumer spending by our employees, and tax payments. We make sizable capital investments and provide leadership in public-private partnerships to spur economic growth and innovation.
We stand at the forefront of new technologies that are increasingly being used to empower individuals, companies, and governments around the world to solve major societal challenges. We also aim to empower people through education and advance social initiatives to create career pathways into the technology industry. This has included our global Intel AI for Youth program, scaled in partnership with governments and institutions to empower youth with digital readiness and AI skills, as well as our multi-year partnerships with historically black colleges and universities in the U.S. aimed at increasing the number of African Americans who pursue electrical engineering, computer engineering, and computer science fields. Our employees and retirees actively share their expertise through volunteer initiatives in the communities where we operate. These efforts contributed more than 10 million hours of service over the past decade, and our new goals include a commitment to volunteer an additional 10 million hours by 2030. In 2020, we volunteered 910 thousand hours. COVID-19 presented challenges for in-person volunteering, resulting in lower reported volunteer hours compared to prior years. However, we saw an outpouring of support from employees for virtual volunteering, donations, and innovative technology projects to support our communities. In April, we announced the Pandemic Response Technology Initiative, a commitment of $50 million to combat COVID-19. Our focus is to leverage our technology, expertise, resources, and our global ecosystem, to accelerate access to technology that can combat the current pandemic and get ahead of future pandemics through scientific discovery, enable remote learning for students, and aid in economic recovery. To date, we have partnered with many organizations on numerous projects across sectors, including technology, healthcare, education, industrial, retail, transportation, and academia.
Human rights commitment. We are committed to maintaining and improving processes to avoid human rights violations related to our operations, supply chain, and products. We have established an integrated approach to managing human rights across our business, including board-level oversight and the involvement of senior-level Management Review Committees. We also meet throughout the year with external stakeholders and experts on human rights to continue to inform and evolve our human rights policies and oversight processes. While we do not always know nor can we control what products our customers create or the applications end users may develop, we do not tolerate our products being used to violate human rights. Where we become aware of a concern that Intel products are being used by a business partner in connection with abuses of human rights, we restrict or cease business with the third party until we have high confidence that Intel's products are not being used to violate human rights. As a result, in 2020 we restricted certain sales based on our Human Rights Principles that would have otherwise been considered lawful.
Supply Chain Responsibility
We actively manage our supply chain to help reduce risk, improve product quality, achieve environmental and social goals, and improve overall performance and value creation for Intel, our customers, and our suppliers. To drive responsible and sustainable practices throughout our supply chain, we have robust programs to educate and engage suppliers that support our global manufacturing operations. We actively collaborate with other companies and lead industry initiatives on key issues such as improving transparency around climate and water impacts in the global electronics supply chain and, as part of our RISE strategy, we will advance collaboration across our industry on responsible minerals sourcing.
| | | | | | | | | | | |
| Fundamentals of Our Business | Our Capital | 14 |
Over the past decade, we have directly engaged with our suppliers to verify compliance and build capacity to address risks of forced and bonded labor and other human rights issues. We perform supplier audits and identify critical direct suppliers to engage through capability-building programs, which help suppliers build sustainability acumen and verify compliance with the Responsible Business Alliance and our Code of Conduct. The suppliers covered by these audits represent 78% of cash payments made to managed suppliers. We also engage with indirect suppliers through our programs on forced and bonded labor, responsible minerals, and supplier diversity. Although COVID-19 presented travel and safety challenges in 2020 that impacted our ability to complete as many in-person supplier audits as in the previous year, we continued to engage with our suppliers and communicate our expectations and requirements. To achieve our 2030 goals, we will significantly expand the number of suppliers covered by our engagement activities to deepen accountability for human rights.
Our commitment to diversity and inclusion also extends to our suppliers. We believe a diverse supply chain supports greater innovation and value for our business. We achieved our 2020 goal to reach $1 billion in annual spending with diverse-owned suppliers and our new 2030 goals include doubling this figure over the next decade. Beginning in 2021, we will not retain or use outside law firms in the U.S. that are average or below average on diversity for their equity partners. We are applying a similar rule to firms used by our tax department, including non-legal firms.
Driving to the lowest environmental footprint possible helps create efficiencies, lower costs, and respond to the needs of our stakeholders. We invest in conservation projects and set company-wide environmental targets to drive reductions in greenhouse gas emissions, energy use, water use, and waste generation. We build energy efficiency into our products to help our customers lower their own emissions and energy costs, and we collaborate with policymakers and other stakeholders to use technology to address environmental challenges. We achieved our 2020 greenhouse gas goal, reducing our emissions 39% on a per unit basis from 2010 levels. Through our 2030 goals we will continue to drive to higher levels of operational efficiency, including a further 10% reduction in our carbon emissions on an absolute basis even as we continue to grow. Our 2030 strategy and goals also focus on improving product energy efficiency and increasing our "handprint"—the ways in which Intel technologies can help others reduce their footprints, including Internet of Things solutions that enable intelligence in machines, buildings, supply chains, and factories, and make electrical grids smarter, safer, and more efficient.
Climate and Energy
We focus on reducing our own climate impact, and over the past two decades have reduced our direct emissions and indirect emissions associated with energy consumption. We achieved our 2020 energy goal, saving more than 4.5 billion kWh since 2012 by investing in energy conservation projects in our global operations. In 2020, we conserved more than 155 million kWh of energy in support of our new 2030 goal to conserve an additional 4 billion kWh of energy over the next 10 years. In addition to conserving energy, we invest in green power and on-site alternative energy projects that provide power directly to our buildings. We continue to link a portion of our executive and employee compensation to corporate responsibility metrics. In 2020, these included a climate-related metric to use 75% renewable energy globally during the year, which supports our 2030 goal to achieve 100% renewable energy use across our global manufacturing operations. In 2020, we signed on to RE100, a global coalition of businesses committed to 100% renewable electricity use.
We are committed to transparency around our carbon footprint and climate risk and use the framework developed by the TCFD to inform our disclosure on climate governance, strategy, risk management, and metrics and targets. For governance and strategy, we follow an integrated approach to address climate change, with multiple teams responsible for managing climate-related activities, initiatives, and policies. Strategies and progress toward goals are reviewed with senior executives and the Intel Board of Directors' Corporate Governance and Nominating Committee. We describe our overall risk management processes in our Proxy Statement, and describe our climate-related risks and opportunities in our annual Corporate Responsibility Report, the Intel Climate Change Policy, and "Risk Factors" within this Form 10-K. In addition to what is included within this Form 10-K, results of our 2020 goals and information on our 2030 goals, are included in our Corporate Responsibility Report. Our Corporate Responsibility Report includes a mapping of our disclosure to the TCFD, the Sustainability Accounting Standards Board framework, and our CDP Climate Change Survey, all available on our website.1
Water Stewardship
Water is essential to the semiconductor manufacturing process. We use ultrapure water to remove impurities from our silicon wafers, and we use fresh and reclaimed water to run our manufacturing facility systems. Over the past decade, our sustainable water management efforts and partnerships have enabled us to conserve billions of gallons of water, and through our 2030 goals we have committed to conserve an additional 60 billion gallons in this decade. As part of this commitment, we plan to achieve net positive water use globally. In 2020, we linked a portion of our executive and employee compensation to our target to conserve more than 5 billion gallons of water in our operations and fund new water restoration projects in collaboration with environmental and community partners that restore more than 1 billion gallons of water during the year to local watersheds.

1 The contents of our website and our Corporate Responsibility Report, Climate Change Policy, and CDP Climate Change Survey are referenced for general information only and are not incorporated by reference in this Form 10-K.
| | | | | | | | | | | |
| Fundamentals of Our Business | Our Capital | 15 |
Circular Economy and Waste Management
We have long been committed to waste management, recycling, and circular economy strategies that enable the recovery and productive re-use of waste streams. We achieved our 2020 waste management goals, reaching a 93% recycle rate for our non-hazardous waste and sending zero hazardous waste to landfills.1 Our 2030 goals include a target of zero total waste to landfill, as well as implementation of circular economy strategies for 60% of our manufacturing waste streams in partnership with our suppliers. This can include reuse of waste streams directly in our own operations or enabling reuse of our waste streams by other industries.
Value We Create
Each of our six forms of capital plays a critical role in our long-term value creation. We consider numerous indicators in determining the success of our capital deployment in creating value. Highlights of value created in 2020 are as follows:
1 We define zero hazardous waste to landfill as 1% or less.
2 See "Non-GAAP Financial Measures" within MD&A.
| | | | | | | | | | | |
| Fundamentals of Our Business | Our Capital | 16 |
| | | | | |
| Management's Discussion and Analysis | |
| |
Our Products
We are at the forefront of developing new technologies and products as building blocks for an increasingly smart and connected world. These technologies and products are used as integrated solutions for a broad spectrum of markets.
| | | | | |
| We Have an End-to-End Product Portfolio |
From processing to moving and storing data, our end-to-end product portfolio offers innovative solutions that scale from edge computing to the network, the cloud, and the emerging fields of AI and autonomous driving. Our products, such as our gaming CPUs, may be sold directly to end consumers, or they may be further integrated by our customers into end products such as notebooks and storage servers. Combining some of these products—for example, integrating FPGAs and memory with Intel Xeon processors in a data-center solution—enables incremental synergistic value and performance. We introduced new products in 2020 such as 10nm-based 11th Gen Intel Core processors, 3rd Gen Intel Xeon Scalable processors (previously referred to as Cooper Lake), Intel Atom P5900 processors for wireless base stations, a next-generation structured ASIC for 5G network acceleration, Intel Stratix 10 NX FPGAs, and the Intel Optane DC persistent memory 200 series. We are now shipping our 10nm-based 3rd Gen Intel Xeon Scalable processors (previously referred to as Ice Lake).
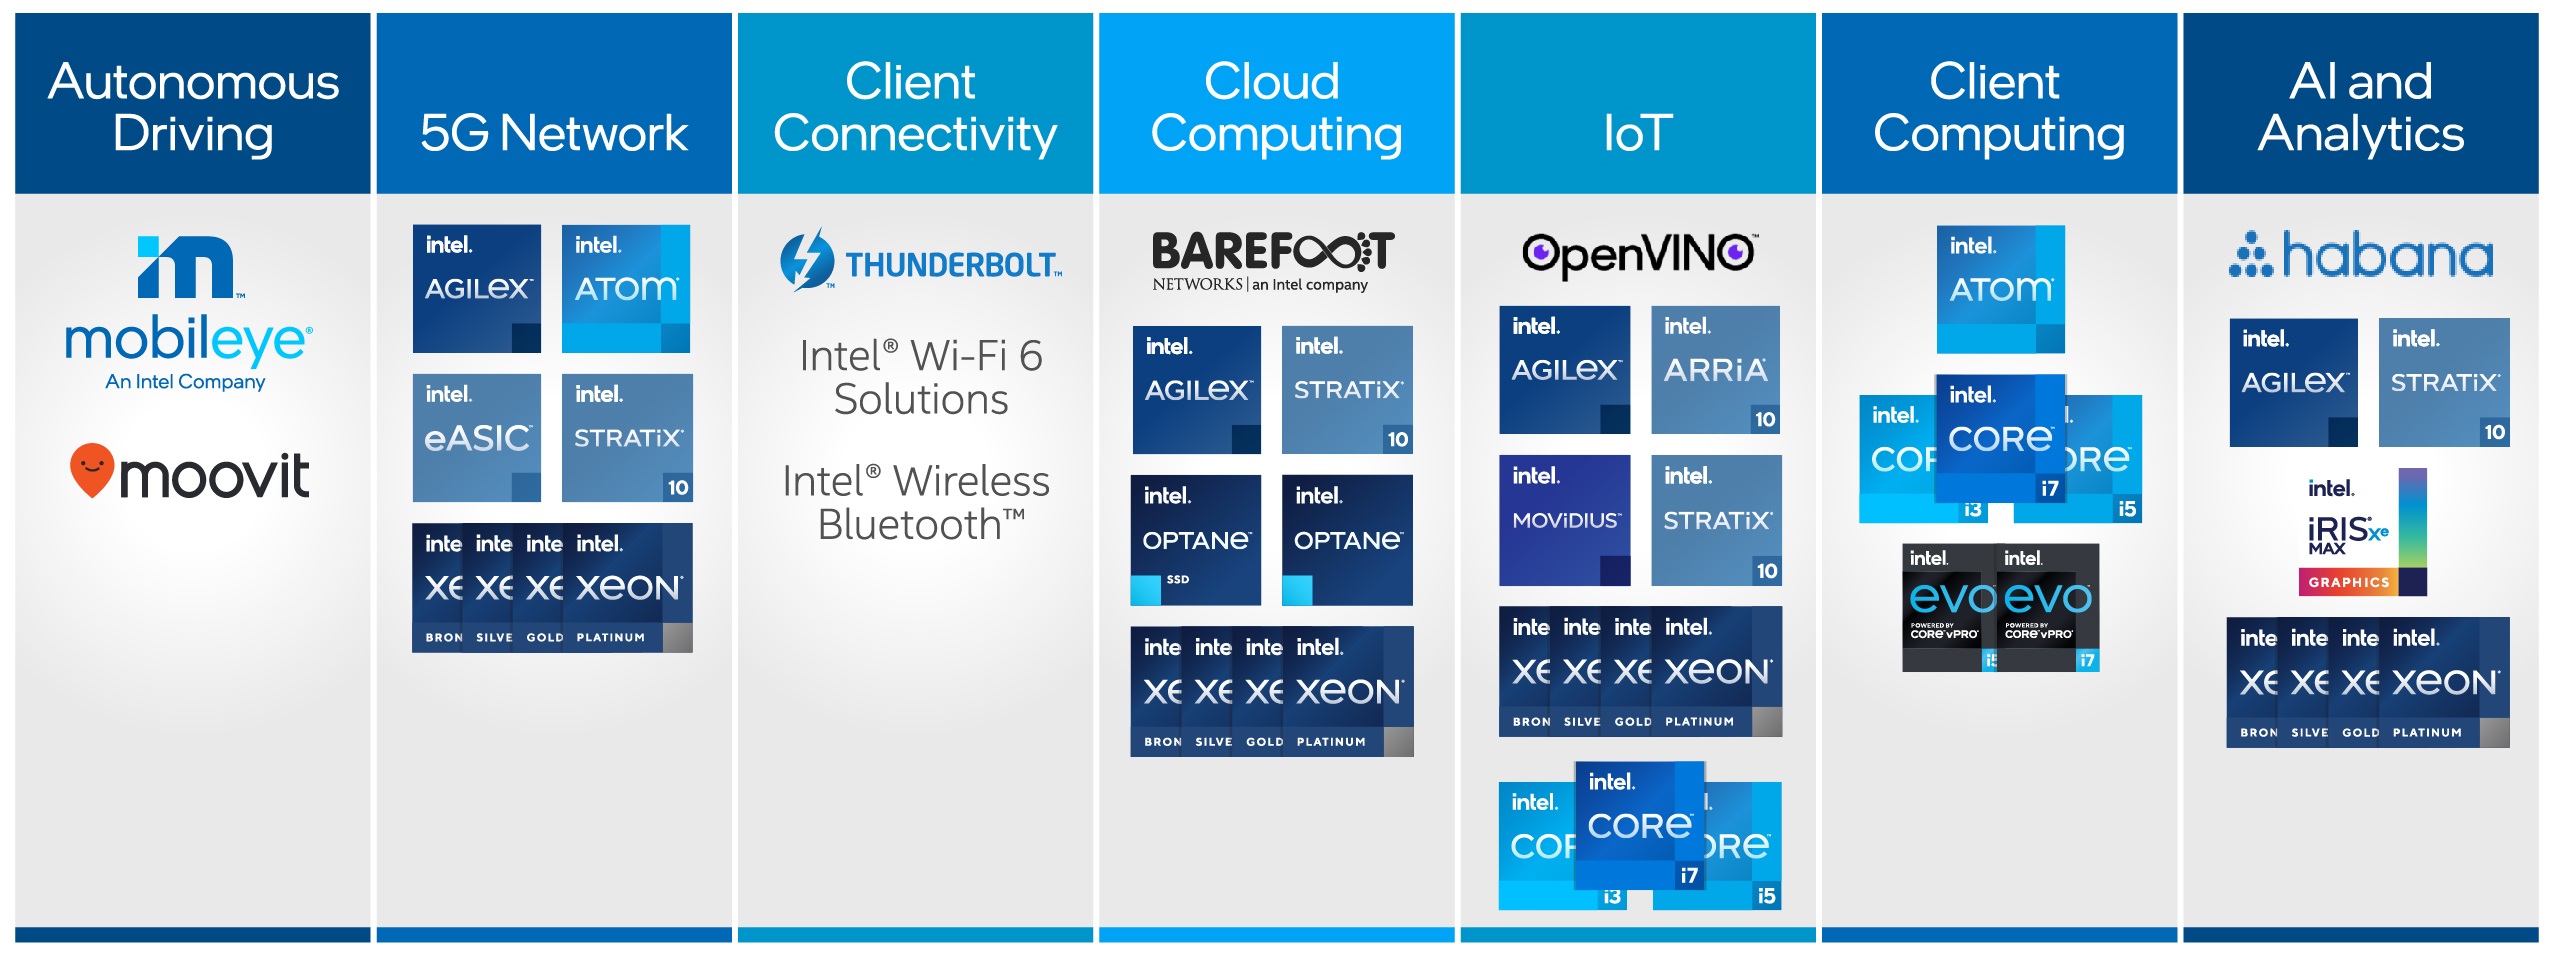
Platform Products: Our platform products can be a CPU and chipset, an SoC, or a multichip package, based on Intel® architecture that processes data and controls other devices in a system. These products are primarily used in solutions sold through CCG, DCG, and IOTG.
Adjacent Products: Our non-platform, or adjacent, products can be combined with platform products to form comprehensive platform solutions to meet customer needs. These products are used in solutions sold through each of our businesses and include the following:
▪Accelerators - Silicon products that can operate alone or accompany our processors in a system, such as FPGAs for PSG, VPUs for IOTG, and Mobileye EyeQ* SoCs
▪Boards and Systems - Server boards and small form factor systems such as Intel® NUCs for CCG
▪Connectivity Products - Ethernet controllers and silicon photonics for DCG; and cellular modems, Wi-Fi, and Bluetooth® for CCG
▪Memory and Storage Products - SSD, persistent memory, and memory components sold through NSG and DCG
| | | | | | | | | | |
| | |
| | | "Our customers' success is our obsession. We are committed to delivering a portfolio of the best quality products, performance, and experiences to enable our customers to solve the world's most challenging problems." —Michelle Johnston Holthaus, Executive Vice President and General Manager of the Sales, Marketing and Communications Group |
|
| | | | | | | | | | | | | | | | | | | | | | | | |
| | | | |
| | | | |
| % Intel Revenue | | | Key Markets and Products |
| | | Includes workload-optimized platforms and related products designed for cloud service providers, enterprise and government, and communications service providers market segments. | | |
| | | | | | |
| | | Includes high-performance compute solutions for targeted verticals and embedded applications in market segments such as retail, industrial, healthcare, and vision. | | |
| | | | | | | | |
| | | Includes development of computer vision and machine learning-based sensing, data analysis, localization, mapping, and driving policy technology for ADAS and autonomous driving. | | |
| | | | | | | | |
| | | Includes memory and storage products like Intel® Optane™ technology and Intel® 3D NAND technology, primarily used in SSDs. | | |
| | | | | | | | |
| | | Includes programmable semiconductors, primarily FPGAs and structured ASICs, and related products for communications, cloud and enterprise, and embedded market segments. | | |
| | | | | | | | | | | | | | | | | | | | | | | | |
|
|
| | | | | | | | |
| Highlights | | Opportunities | | Challenges |
Revenue from our data-centric businesses was up 9% year over year. Growth in DCG, NSG, and Mobileye was partially offset by decline in IOTG and PSG. We are now shipping our 10nm-based 3rd Gen Intel Xeon Scalable processors (Ice Lake). We also introduced new data-centric products, such as the 3rd Gen Intel Xeon Scalable processor (Cooper Lake), the Intel Optane DC persistent memory 200 series, Intel Atom P5900 processors for wireless base stations, a next-generation structured ASIC for 5G network acceleration, and Intel Stratix 10 NX FPGAs. In addition, Mobileye continued to secure new design wins at major U.S. and global automakers. | | Our broadened portfolio enables new opportunities for us and creates value for our customers. For example, our product offerings for AI workloads reach from the cloud to the edge, and we are developing CPU, GPU, FPGA, and AI accelerator products to span inference and training AI workloads, while also pursuing ongoing software optimizations for AI. | | In the first half of 2020, DCG customers expanded capacity and continued building robust cloud and network-fueled server solutions. As macroeconomic uncertainty persisted and businesses began working through inventory, demand slowed in the second half. We are operating in an increasingly competitive market. Our 2020 gross margin was impacted by higher platform unit cost associated with ramping our 10nm products. We expect 10nm costs to improve as the node matures. |
| | | | | | | | | | | | | | | | | | | | | | | | | | | |
| % Intel Revenue | | | Key Markets and Products |
| | | Includes platforms designed for end-user form factors, focusing on high-growth segments of 2-in-1, thin-and-light, commercial and gaming, and growing adjacencies such as connectivity and graphics. | | |
| | | | | | | | | |
| | | | |
| | | | |
| | | | | | | | | | | | | | | | | | | | | | | | |
|
|
| | | | | | | | |
| Highlights | | Opportunities | | Challenges |
Our PC-centric business revenue grew 8% year over year. We began shipping our 10nm SuperFin Technology-based 11th Gen Intel Core processors. These processors feature an optimized CPU, GPU, AI acceleration, best-in-class connectivity, and software optimization and platform capabilities to maximize real-world performance on commonly used applications and features. We also announced the Intel Evo platform brand, representing premium laptop designs that are verified to deliver exceptional real-world experiences, powered by 11th Gen Intel Core processors. | | We are targeting an approximately $71 billion PC-centric revenue TAM1. This expanded portfolio includes markets such as connectivity, graphics, and systems, which enable new opportunities as we innovate through the platform. We continue to drive industry innovation through programs, such as our Intel Evo platform brand, which is designed to deliver advanced laptops that are verified to meet ambitious key experience indicators in areas like responsiveness, battery life, instant wake, and connectivity. | | Our PC-centric business is operating in an increasingly disruptive and competitive environment, and we are focused on executing a predictable cadence of leadership products to deliver the experiences people need in this new era of distributed intelligence. The accelerated shift to cloud makes our investments in differentiated performance and features for cloud applications even more critical. Excellence in engineering and manufacturing, as well as accelerating our competitive response, is of utmost importance. Our 2020 gross margin was impacted by higher platform unit cost associated with ramping our 10nm products. We expect 10nm costs to improve as the node matures. |
1 Source: Intel calculated 2025 TAM derived from industry analyst reports.

| | | | | | | | |
| Overview | |
DCG develops workload-optimized platforms for compute, storage, and network functions. With unmatched scale, portfolio breadth, and ecosystem support, we are uniquely positioned to enable the world to unleash the potential of data, unlocking value for people, business, and society on a global scale. Market segments include cloud service providers, enterprise and government, and communications service providers. We serve the global appetite for cloud computing and enable transformation of the network and edge. |
| |
| Highlights and Segment Imperatives |
| | "We are driving game-changing platforms that enable our customers to move, store, and process the world's data." —Navin Shenoy, Executive Vice President and General Manager, Data Platforms Group1 |
■ | Revenue grew 11% as cloud service providers increased capacity to serve customer demand and the communications service providers market segment continued to grow. We also experienced significant growth in adjacencies driven by 5G networking deployment. The enterprise and government market segment declined due to COVID-related demand impacts. |
■ | In 2020, we continued to advance our data-centric portfolio with the introduction of the 3rd Gen Intel Xeon Scalable processor family; the Intel Optane persistent memory 200 series; the first Intel architecture-based 10nm SoC for wireless base stations, the Intel Atom P5900 platform; and the Intel Silicon Photonics 400G transceiver. |
■ | We have significant opportunities in cloud, networking, AI, and data analytics. As we broadened our product offerings and continued to innovate, the data center market TAM2 is expected to grow to approximately $119 billion3 by 2025. |
| |
| | |
| | | | | | | | | | | | | | | | | | | | |
| ■ Revenue $B | | ■ Op Income $B | |
1 Our Data Platforms Group includes our DCG segment. See "Information About Our Executive Officers" within Other Key Information for more details.
2 Source: Intel calculated 2025 TAM derived from industry analyst reports.
3 DCG 2025 TAM includes Optane SSDs.
Market and Business Overview
Market Trends and Strategy
Data is a significant force in society, and is being generated at an unprecedented pace. The future of technology is being shaped by the rise of several technology inflections:
▪The levels of efficiency and scale that cloud architectures brought to the data center are now being extended to the network and edge. Workloads are no longer static between enterprises and public clouds; they are distributed to a mix of hybrid and multi-cloud.
▪5G will enable rich new experiences and services, fundamentally changing the way we think of compute and requiring most networks to transform.
▪AI is fundamental and becoming pervasive in all applications, and is enabling customers to leverage the power of data.
▪The edge is demanding more and more compute closer to where data is being created and consumed, driving a new wave of multifunction, compute-hungry devices.
Data centers—whether in the cloud, the network, or at the edge—will go through a massive architectural transformation in the coming years, leveraging heterogeneous computing with different types of processor architectures optimized for different workloads. With unmatched scale, portfolio breadth, and ecosystem support, we are uniquely positioned to unlock the value of data for people, business, and society on a global scale.
Cloud revenue grew in 2020, driven by rapidly expanding hyperscaler demand for capacity, peaking in the first half with inventory digestion throughout the remainder of the year. The on-premises enterprise business experienced cyclical declines due to sustained COVID-19 workplace trends and macroeconomic uncertainty; enterprise customers continue to embrace cloud as an alternative to traditional legacy architectures. The communications service providers segment continued to grow, accelerating the global transformation of the network and edge through 5G-enabled solutions.
Products and Competitiveness
| | | | | | | | |
| We offer customers a broad portfolio of silicon and software designed to provide workload-optimized performance across compute, storage, and network. As a leading provider of data center platforms, we face competition from competitors such as Advanced Micro Devices, Inc. (AMD), providers of GPU products such as NVIDIA Corporation (NVIDIA), companies using ARM* architecture, new entrants developing products customized for specific data center workloads, and internally developed solutions by cloud service providers and others. We expect an increasingly competitive environment in 2021. | | |
We are now shipping our 10nm-based 3rd Gen Intel Xeon Scalable processors (previously referred to as Ice Lake). In 2020, we introduced our 3rd Gen Intel Xeon Scalable processors (previously referred to as Cooper Lake) accompanied by the Intel Optane DC persistent memory 200 series. As the industry's only mainstream data center CPUs with built-in AI acceleration, Intel Xeon processors are helping customers solve problems and gain insight for future opportunities. We also collaborated with 5G leaders to design the world's first standard, high-volume silicon for radio access networks, the Intel Atom P5900 processor, designed from the ground up for 5G wireless base stations. Since acquiring Habana Labs in December 2019, we aligned our specialized AI accelerator investments around the Habana Gaudi training processor and we began shipping Goya inference processors this year, which contributed to advancing our AI strategy. Amazon Web Services announced that Habana Gaudi will be used to power future Amazon Elastic Compute Cloud instances. In the connectivity space, we brought together Barefoot Networks' programmable Ethernet switch technology and our silicon photonics technology in a successful demonstration of the industry's first co-packaged optics Ethernet switch.
Financial Performance
| | | | | | | | | | | | | | |
| DCG Revenue $B | | DCG Operating Income $B | |
▪Higher platform volume driven by strength in cloud service providers (up 20%) and continued growth in communications service providers (up 17%), partially offset by decline in enterprise and government (down 8%) (compared to cloud service providers up 13%, communications service providers up 6%, and enterprise and government down 14% from 2019 to 2018). Cloud service providers grew over the first three quarters as they added capacity to serve demand before entering a capacity digestion cycle in the fourth quarter. The enterprise and government segment declined in the second half of the year on COVID-related macroeconomic weakness.
▪Adjacent growth driven by 5G networking deployment.
▪Platform ASP decline driven by SoC volume growth, competitive pricing environment, and customer mix, partially offset by Xeon product mix.
| | | | | | | | | | | | | | | | | | | | | | | | | | | | | | | | |
| | 2020 vs. 2019 | | 2019 vs. 2018 |
| (In Millions) | | % Growth | | $ Impact | | % Growth | | $ Impact |
| | | | | | | | | | |
| Platform volume | | up | 11% | | $ | 2,316 | | | down | (3)% | | $ | (654) | |
| Platform ASP | | down | (3)% | | (701) | | | up | 5% | | 940 | |
| Adjacent products | | up | 49% | | 1,007 | | | up | 11% | | 204 | |
| | | | | | | | | | |
| Total change in revenue | | | | | $ | 2,622 | | | | | | $ | 490 | |
| | | | | | | | | | |
| | | | | | | | | | |
| | | | | | | | | | |
| | | | | | | | | | |
| | | | | | | | | | |
| | |
Operating income increased 3% year over year, and operating margin was 40% in 2020.
| | | | | | | | |
| (In Millions) | | |
| $ | 10,571 | | | 2020 Operating Income |
| 1,325 | | | Higher gross margin from platform revenue |
| 235 | | | Lower period charges due to lower factory start-up costs associated with the initial ramp of 10nm, partially offset by platform product reserves |
| (425) | | | Higher operating expenses |
| (375) | | | Lower DCG adjacent product margin |
| (295) | | | Higher platform unit cost |
| (125) | | | Primarily driven by higher logistic expenses due to COVID-19 |
| 4 | | | Other |
| $ | 10,227 | | | 2019 Operating Income |
| (805) | | | Higher period charges, primarily associated with the initial ramp of 10nm |
| (510) | | | Higher operating expenses primarily related to R&D |
| (140) | | | Lower DCG adjacent product margin |
| (80) | | | Higher platform unit cost |
| 370 | | | Higher gross margin from platform revenue |
| (84) | | | Other |
| $ | 11,476 | | | 2018 Operating Income |
More industries are harnessing the power of data to create business value, innovate, and grow. This requires that intelligence move closer to the edge, allowing data to be acted on where it is created. Working with our partners, we are using our architecture, accelerators, and software to develop and scale a growing Internet of Things portfolio and ecosystem. Our Internet of Things portfolio is comprised of our IOTG and Mobileye businesses.
Internet of Things Group
| | | | | | | | |
| Overview | |
IOTG develops high-performance compute platforms that solve for technology and business use cases that can scale across vertical industries and embedded markets. Our customers include retailers, manufacturers, health and life sciences, governments, and education providers. We reduce complexity in the ecosystem with a common architecture and software to help enable our customers to create, store, and process data at the edge to analyze it faster and to act on it sooner. |
| |
| Highlights and Segment Imperatives |
| | "The acceleration of data creation across industries requires high-performance compute at the edge built with AI and edge-native functionality. The value unlocked through distributed intelligence is helping companies accelerate their digital transformation to meet customer needs. Together with our ecosystem partners, we are solving those needs through scalable solutions built with our hardware and software." —Tom Lantzsch, IOTG General Manager |
■ | Revenue was down 21%, driven by weaker core mix and lower demand for IOTG platform products due to economic impacts of COVID-19. Revenue was also negatively affected by considerations related to the U.S. government Entity List. |
■ | We announced enhanced Internet of Things product capabilities, which include the 11th Gen Intel Core processors, Intel Atom x6000E series processors, Pentium processors, and Celeron N and J series processors, bringing new AI, security, functional safety, and real-time capabilities to edge customers. These products are a response to needs across the Internet of Things industry to reduce edge complexity, lower cost of ownership, and support a range of environmental conditions. |
■ | We are working with our ecosystem partners to continue to grow the portfolio of Intel® IoT Market Ready Solutions (Intel® IMRS) and Intel® IoT RFP Ready Kit—scalable, end-to-end solutions that provide solid business results today and lay the foundation for the future. Currently, IOTG has over 450 Intel IMRS and Intel IoT RFP Ready Kit offerings with approximately 13,000 new deployments across 130 countries in 2020. |
■ | We continue to update solutions to accelerate market adoption of edge and AI applications. This includes advancing the OpenVINO toolkit, which has been downloaded hundreds of thousands of times since launching in 2018 and nearly doubled the number of developers from 2019 to 2020. It is supported by Intel DevCloud for the Edge, which allows users to prototype and experiment with AI workloads on Intel hardware from anywhere at any time. |
| | | | | | | | | | | | | | | | | | | | |
| ■ Revenue $B | | ■ Op Income $B | |
Market and Business Overview
Market Trends and Strategy
The Internet of Things market is at the center of a global digital transformation. Through a broad portfolio of technology, solutions, and tools, we are transforming the way businesses create products, deliver services, and conduct operations—from schools and hospitals, to retailers and smart factories. Solving customer challenges in a highly fragmented global market requires a strong ecosystem in each vertical industry with horizontal technologies that can scale quickly and efficiently. Our customer verticals include the following:
| | | | | | | | | | | | | | | | | |
| | Retail – Retailers produce mountains of data that can be used to proactively address evolving customer demands and improve operations. With our partners we provide solutions that enable retailers to extract insights from their data, allowing retailers to provide personalized, convenient shopping experiences and supply chain efficiencies that lead to greater customer loyalty, revenue, and profitability. With solutions like the Intel IMRS offerings, customers can adapt quickly to changing market dynamics that provide the right environment for their shoppers. |
|
|
|
| Industrial – We are transforming manufacturing today and expanding on what is possible for tomorrow's autonomous operations. We are driving the realization of Industry 4.0 and, together with our partners, addressing industry challenges like the convergence of information technology and operational technology and bringing AI and analytics to operations. From the supply chain to the smart factory, we are using digital and physical technologies to drive flexible, responsive, and interconnected industrial infrastructure to make informed decisions that lower maintenance costs, create new service opportunities, and increase productivity. |
|
|
|
|
| Healthcare – We are advancing technologies to enable healthcare providers to focus on patients and their care. Technologies like AI, robotics, and the Internet of Things are making healthcare and life sciences more connected, personalized, and intelligent. In lab and research environments, our technology innovations give researchers powerful tools to make breakthrough discoveries and solve some of the world's largest healthcare and life science challenges. By working together with solution providers and end users in the healthcare community, we will continue to develop transformative technologies for the future of healthcare and life sciences.
|
|
|
|
|
Products and Competitiveness
We meet the specific requirements of each vertical industry by utilizing platform and adjacent products and technology from Intel's entire portfolio, while making additional investments needed to further enhance Internet of Things and edge products. We offer end-to-end solutions with our wide spectrum of products, including Intel Atom, Intel Core, and Intel Xeon processor-based computing, wireless connectivity, FPGAs, Movidius VPUs, and developer tools, such as the Intel DevCloud for the Edge, the OpenVINO ecosystem, and the Intel® Edge Software Hub. IOTG product development focuses on addressing the key challenges businesses face when implementing Internet of Things solutions, including interoperability, connectivity, safety, security, industrial use conditions, and long-life support.
For more than 30 years, we have been a supplier of technology and software for embedded products and edge computing. Our strategy is to continue to serve this market to unlock business opportunities for our partners and customers. This marketplace continues to expand significantly, with increasing types and numbers of smart and connected devices for retail, industrial, and healthcare uses. As this marketplace evolves, we face numerous large and small incumbent processor competitors, as well as new entrants that use the ARM architecture and other operating systems and software. The Internet of Things requires a broad range of connectivity solutions and we face competition from semiconductor companies providing traditional wireless solutions such as cellular, Wi-Fi, and Bluetooth, as well as several new entrants who are taking advantage of new focused communications protocols.
As businesses continue to create a deluge of data from more and more smart and connected devices across industries, the demand for high-performance compute at the edge has expanded exponentially. The Internet of Things market is fragmented and complex, requiring interoperability, standard-based approaches, software, developer tools, and the ecosystem working together to accelerate time to value with commercial solutions at scale.
Mobileye
| | | | | | | | |
| Overview | |
Mobileye is the global leader in driving assistance and self-driving solutions. Our product portfolio employs a broad set of technologies, covering computer vision and machine learning-based sensing, data analysis, localization, mapping, and driving policy technology for ADAS and AVs. Mobileye's ADAS products form the building blocks for higher levels of autonomy. Our customers and strategic partners include major global OEMs, Tier 1 automotive system integrators, fleet managers, and transportation operators.
|
| |
| Highlights and Segment Imperatives |
| |
■ | We achieved record revenue in 2020 despite a significant decline in global vehicle production related to COVID-19 in the first half of the year. Our EyeQ SoC volume grew approximately 12% and we expect to see additional growth in the adoption of enhanced ADAS technologies. | "The trinity of Mobileye's vision is based on a unique interplay between ADAS and AV realms, a full-fledged mapping solution, and an industry-first formal model for safety. With the past year's significant progress and achievements, we completed another leap in executing our vision for autonomous mobility solutions." —Prof. Amnon Shashua, President and Chief Executive Officer, Mobileye |
■ | Despite unprecedented challenges to the auto industry amid the COVID-19 pandemic, we secured more than 37 new design wins, including deals with major OEMs such as Geely and Ford. We are currently active in 49 production programs1 across over 25 OEMs. |
■ | We expanded our relationship with Ford, providing our suite of EyeQ sensing technology to support Ford's Co-Pilot360TM Technology driver-assist features, which will be visible in vehicles with Mobileye's logo on display. We also announced a large-scale deal with Chinese automaker Geely to provide Mobileye Supervision, our new ADAS solution. This win marks the first time Mobileye will be responsible for the full solution stack, including hardware and software, driving policy, and control. |
| |
| |
■ | We acquired Moovit to accelerate Mobileye's MaaS offering. Moovit is known for its urban mobility application and brings Mobileye closer to achieving our plan to become a complete mobility provider, including robotaxi services. |
| | | | | | | | | | | | | | | | | |
| ■ Revenue $B | | ■ Op Income $B |
Market and Business Overview
Market Trends and Strategy
The COVID-19 pandemic negatively impacted the global vehicle industry, resulting in a year over year decline in overall production of approximately 17%3, and delayed deployment of certain OEMs' advanced features and other projects. We expect ADAS volume to recover from the effects of COVID-19 faster than overall global vehicle production, and we expect long-term growth of ADAS to remain unaffected as consumers increasingly consider ADAS a differentiating factor in their automotive purchasing decisions.
The continued growth of ADAS is dependent on various factors, including regulation, market demand, and consumers' recognition of its value. Mobileye's ADAS solutions also serve as a qualification space for our autonomous technology, using vast experience and proliferation to validate and constantly improve AV technology. This year, we introduced Mobileye Supervision, the EyeQ5-based solution that incorporates an end-to-end engine control unit, surround-view camera array, processors, driving policy, and high-definition maps—all derived directly from our ongoing autonomous vehicle program. AV technologies such as Mobileye Supervision will make their way into premium ADAS solutions, broadening monetization opportunities and value proposition.
1 This refers to the total number of production programs with active project managers. Intel's definition of program is included in "Key Terms" within the Financial Statements and Supplemental Details.
2 Mobileye was acquired in Q3 2017; 2017 results do not represent the full year.
3 Source: IHS Markit
Despite the COVID-19-related impact on vehicle production, OEMs are still looking to enhance current L2+ solutions by improving system fidelity, availability, and performance. High-definition maps with constant updates, global coverage, and various semantic features are prerequisites for L2+ applications and the future deployment of robotaxi and passenger car autonomy (Consumer AV). Canonical mapping methods rely on extensive manual labor and dedicated mapping vehicles. Mobileye's disruptive REM crowdsource mapping technology provides automatic map creation and updates. REM mapping capabilities are also being leveraged to extend the value of static and dynamic data to businesses in new market segments such as smart cities and infrastructure surveys.
We believe the future of autonomous driving will unfold in two phases: commercial robotaxi and series-production passenger car consumer AVs. We expect consumer AVs to materialize only after the robotaxi industry deploys and matures. The main inhibitors of a mass market product offering of consumer AV are the cost of AV technology, ability to scale at a low cost, regulatory framework, and public acceptance. Thus, we see the robotaxi phase as a necessary corridor to consumer AV. Mobileye is well-positioned to play a significant role in the broader MaaS market with the commercialization of robotaxi and the future consumer AV market. Our full-stack self-driving system—geared with our camera-centric backbone and vast experience in productizing cutting-edge technology in the automotive industry—is the foundation for developing an economically competitive AV solution. Proliferation of data-collection vehicles alongside REM technology will allow for low-cost geographic expansion and coverage. Together with Moovit's complementary assets in the service layers, Mobileye is building itself as an end-to-end service provider at scale.
Until the UNECE, EU, and U.S. provide regulation for self-driving vehicles without safety drivers for commercial ride sharing and public transportation, several countries are pushing to enact laws and regulation by 2021 to enable regular deployment and operation of MaaS fleets with self-driving vehicles starting in 2022.
Products and Competitiveness
Our offering for ADAS and AV is propelled by our computer vision and AI expertise and software assets, deployed on our EyeQ SoC family. The tight co-design of hardware and software gives the EyeQ SoC the ability to support complex and computationally intense tasks and sets it apart from competition because it is purpose-fit for high-compute, low-power, automotive-compliant mission profiles. Our 5th Gen EyeQ5 SoC is designed to act as the central computer for fully autonomous driving vehicles. We have been able to achieve power, performance, and cost targets by employing proprietary computational cores that are optimized for a wide variety of computer vision, signal processing, and machine learning tasks, including deep neural networks. Starting with EyeQ5, we are supporting an automotive-grade standard operating system and providing a complete software development kit to allow customers to differentiate their solutions by deploying their algorithms on EyeQ5. The EyeQ5 SoC is expected to be in commercial vehicles starting in 2021 and is already operational in our autonomous test vehicles.
EyeQ5 serves as the computational foundation for our scalable camera-only surround sensing system. The system consists of multiple independent computer vision engines and deep networks for algorithmic redundancy. The result is a robust and comprehensive model of the environment that allows end-to-end autonomous driving. The surround computer vision system is the backbone of Mobileye's AV architecture and the flagship offering for next-generation ADAS.
The next significant building block in our complete offering is REM mapping technology, which compiles crowdsourced mapping data from EyeQ SoC-equipped vehicles. We are focused on our crowd-sourced mapping efforts and expect a significant increase in harvesting capabilities in 2021. We also expect an expansion of the number of vehicles using our localization capabilities by the end of 2021. The REM RoadbookTM can enhance current ADAS applications through a variety of advanced features, including predictive adaptive cruise control, lane-level localization in all weather and road conditions, hands-free driving application, and real-time alerts.
Leveraging this data, we launched a full suite of vision-based data services for cities, road operators, transportation authorities, and mapping companies. Using vehicles equipped with Mobileye's road mapping technology, we provide highly refreshed geographic information systems data about the road network, infrastructure assets, pavement condition, mobility, and traffic. This information allows our customers to monitor and preserve their infrastructure more efficiently, making roadways and streets safer for all.
The third building block in our full stack offering is our unique formal model for AV safety (RSS). At its core, RSS is a pragmatic method to design and then efficiently validate the safety of an AV, serving as the governing safety layer for the decision-making system. RSS formalizes human decision making for safe driving under two main principles: first, it acknowledges the need to balance safety with useful driving by making plausible worst-case scenario assumptions for other road users; and second, it provides a technology-neutral model and a transparent framework for the regulatory endeavor of building an industry standard for safety. In late 2019, Intel was named to lead the IEEE working group to develop AV decision making standards.
These building blocks are already part of our recently launched Mobileye Supervision, a direct derivative of our autonomous driving program. This solution proves that there is a valuable use case for AV technology in the most advanced driver-assistance systems.
Financial Performance
| | | | | | | | | | | | | | |
| Internet of Things Revenue $B | | Internet of Things Op Income $B | |
2020 vs. 2019
IOTG revenue decreased $814 million, or 21%, primarily driven by the economic impacts of COVID-19 with $470 million in lower ASPs driven by weaker core mix and $265 million driven by weaker demand for IOTG platform products. Revenue was also negatively affected by considerations related to the U.S. government Entity List.
Mobileye revenue was $967 million, up $88 million, driven by higher demand from improved global vehicle production in the second half of 2020, offsetting the decline in production experienced in the first half of the year due to the effects of the COVID-19 pandemic.
2019 vs. 2018
IOTG revenue increased $366 million, or 11%, driven by $283 million in higher ASPs from stronger core mix and $92 million from higher IOTG platform unit sales, partially offset by lower revenue from our divestiture of Wind River in Q2 2018, which negatively impacted the revenue comparison by approximately $153 million in the first half of 2019. After adjusting for Wind River, IOTG revenue grew $519 million, or 16%, year over year.
Mobileye revenue was $879 million, up $181 million, due to increasing adoption of ADAS.
2020 vs. 2019
IOTG operating income decreased $600 million, primarily due to lower platform revenue.
Mobileye operating income was $241 million, down $4 million, due to higher spending primarily driven by the Moovit acquisition, partially offset by growth in revenue.
2019 vs. 2018
IOTG operating income increased $117 million, due to higher platform revenue from stronger core mix offset by higher period charges related to reserves taken on legacy products.
Mobileye operating income was $245 million, up $102 million, driven by growth in revenue partially offset by higher spending.

| | | | | | | | |
| Overview | |
NSG provides next-generation memory and storage products based on breakthrough Intel Optane technology and Intel 3D NAND technology. NSG is disrupting the memory and storage hierarchy with new tiers that balance capacity, performance, and cost. Our products are available in innovative new form factors and densities to address the memory and storage challenges our customers face in a rapidly evolving technological landscape. Our customers include enterprise and cloud-based data centers, and users of business and consumer desktops and laptops. |
| |
| Highlights and Segment Imperatives |
| | "The world's data is growing at an exponential rate, and Intel is leading two major innovations in non-volatile memory, Optane and NAND. Our advanced product portfolio continues to disrupt the memory-and-storage hierarchy and allows us to play a bigger and more strategic role for our customers." —Rob Crooke, NSG General Manager |
■ | We achieved record revenue in 2020, driven by improved NAND pricing and memory bit growth. We achieved significant improvement in NAND profitability from market pricing recovery and continued improvements in unit cost. |
■ | We launched the 2nd Gen Intel Optane persistent memory and Intel® Optane™ SSD P5800X, our first PCIe 4.0 SSD, which performs over three times faster than the previous generation. |
■ | We launched Intel® SSD D7-P5500, D7-P5600 Series with 96-Layer TLC 3D NAND, and D7-P5510 Series with 144-Layer TLC 3D NAND Data Center SSDs in six capacities up to 7.68 terabytes, with industry-leading PCIe Gen4, areal density, and layer count. For client applications, we launched Intel® SSD 670p with 144-Layer QLC 3D NAND. |
■ | We signed an agreement with SK hynix to divest our NAND memory business, including our Fab Assets, our NAND SSD Business, and our NAND OpCo Business. The NAND memory business represents the substantial majority of NSG. |
| | | | | | | | | | | | | | | | | |
| ■ Revenue $B | | ■ Op Income $B | |
Market and Business Overview
Market Trends and Strategy
The combination of ever-exploding growth in data and the desire to analyze data for actionable insights requires our customers to balance performance, real-time access, and cost. Our technology innovations enable various tiers of memory and storage to ensure that critical, or "hot," data is close to the CPU for rapid access to larger data sets with Intel Optane-based products and efficient cost-effective capacity storage with Intel 3D NAND TLC and QLC Technology.
In October 2020, we signed an agreement with SK hynix to divest our NAND memory business. This transaction will allow us to further prioritize our investments in differentiated technology where we can play a bigger role in the success of our customers and deliver attractive returns to our stockholders. Our Intel Optane business is expressly excluded from the sale. The transaction will occur over two closings. In connection with the first closing, the parties will enter into a NAND wafer manufacturing and sale agreement, pursuant to which we will continue to manufacture NAND wafers at our Dalian, China memory fabrication facility. We will sell these wafers to SK hynix until final closing.
Products and Competitiveness
We compete against other providers of NAND products. We offer 96-layer and 64-layer TLC NAND high-capacity SSDs, and 144-layer QLC NAND high-capacity SSDs. We also provide unparalleled low latency and high performance with Intel Optane technology. We focus our efforts primarily on incorporating NAND into solution products and on our innovative Intel Optane technology, which offers a unique combination of performance, density, power, non-volatility, and cost advantages that redefine the memory storage hierarchy between conventional DRAM memory and NAND. We believe that our memory offerings, including our Intel Optane technology, complement our product offerings in our other segments.
The acceleration in data growth across our customer base requires significant innovation in storage and memory technology. Our storage and memory roadmap led the way in re-imagining usages and architecting innovative solutions that have disrupted the industry with 96-layer and 144-layer 3D NAND TLC and QLC solutions. We launched six new products to keep up with the evolving business needs of our customers. We have seen increased volume in the Intel Optane technology business.
We launched the second generation of Intel Optane persistent memory products, available for 3rd Gen Intel Xeon processor platforms for data center usages. This technology redefines the memory storage hierarchy and offers the performance of memory with the large capacities and persistence characteristics of storage. We offer the industry's only drive to combine Intel Optane memory and Intel® QLC 3D NAND Technology. This new technology will enable innovative new form factors and higher capacity drives.
Financial Performance
| | | | | | | | | | | | | | |
| NSG Revenue $B | | NSG Operating Income $B | |
2020 vs. 2019
Revenue increased $996 million, driven by $716 million higher ASP from improved NAND pricing and $280 million from improved overall demand.
2019 vs. 2018
Revenue increased $55 million, driven by a $3.9 billion increase in unit sales due to an increase in demand for NAND products, offset by a $3.8 billion impact from lower ASP due to lower NAND market pricing.
2020 vs. 2019
NSG had an operating profit of $361 million, up from an operating loss of $1.2 billion in 2019. The operating profit was driven by $716 million higher ASPs from market pricing recovery and $741 million due to continued improvements in unit cost.
2019 vs. 2018
NSG had an operating loss of $1.2 billion, down from an operating loss of $5 million in 2018. The operating loss was driven by $3.8 billion lower ASPs, partially offset by $1.6 billion of improved unit cost and $1.1 billion higher unit sales. While the ramp at Fab 68 in 2019 drove cost improvements, the decline in ASP and the absence of $160 million in government grants recognized in Q3 2018 more than offset improved unit cost, resulting in lower gross margin.

| | | | | | | | |
| Overview | |
PSG offers programmable semiconductors, primarily FPGAs, structured ASICs, and related products, for a broad range of applications across our embedded, communications, and cloud and enterprise market segments. Our product portfolio delivers FPGA acceleration in tandem with Intel microprocessors, which enables us to combine the benefits of our broad portfolio of technologies to allow more flexibility for systems to operate with increased efficiency and higher performance.
|
| |
| Highlights and Segment Imperatives |
| |
■ | Revenue was down 7% year over year, driven by a decline in our communications market segment due to customer transition to 5G ASICs and decline in our embedded market segment, partially offset by strength in the cloud and enterprise market segment. | "With major technology inflections happening across 5G, AI, intelligent edge, and the cloud, the flexibility and programmability of Intel FPGAs and structured ASICs are critical elements of Intel's portfolio that enable rapid innovation and customization." —David Moore, PSG General Manager |
■ | We continue to leverage our heterogeneous architecture on advanced nodes to deliver innovative products at an accelerated pace. We announced Intel Stratix 10 NX, extending our Intel Stratix 10 FPGA family. |
■ | We expanded our FPGA SmartNIC portfolio with the introduction of the Intel® FPGA SmartNIC C5000X platform architecture, targeting cloud data center applications. Together with Silicom Ltd., we introduced the Intel FPGA SmartNIC N5010 platform for network infrastructure acceleration. |
■ | We introduced the Intel® eASICTM N5X device family, previously referred to as Diamond Mesa, for low-latency 5G network acceleration, cloud acceleration and storage, AI, and edge applications. |
| |
| | | | | | | | | | | | | | | | | | | | |
| ■ Revenue $B | | ■ Op Income $B | |
1 PSG was acquired in Q1 2016.
Market and Business Overview
Market Trends and Strategy
With the rise of pervasive connectivity and autonomous transactions, vast networks of devices and systems are linked from the edge through infrastructure to the cloud. Our FPGA and structured ASIC technologies enhance Intel's ability to meet the needs of customers across these technology inflections by delivering flexible and high-performance acceleration to extend platform capabilities, intercepting evolving requirements when standards are still changing, and enabling customers to validate next-generation technology proof points early in the market transition. The Intel FPGA portfolio enables this transformation with discrete FPGAs and software-defined, hardware-based, multi-function acceleration cards that allow faster development times, high performance, and power efficiency with lower overall total cost of ownership.
We enable a broad range of solutions targeting applications across our embedded, communications, and cloud and enterprise market segments. The configurability and efficiency of FPGAs provide advantages to enable transformative applications such as 5G wireless, network function virtualization acceleration, and edge acceleration for video analytics and Industry 4.0. At the edge, where systems ingest large amounts of data, Intel FPGAs are ideal for pre-processing data to accelerate Intel processors. In the network, where data traffic is increasing and network functions are being virtualized to improve transport efficiency, Intel FPGAs are built to deliver high-bandwidth aggregation and processing. In the cloud, where workloads shift dynamically and algorithms change, Intel FPGAs are the ideal solution for adapting to new demands through reconfigurability.
Products and Competitiveness
We deliver solutions in the PLD market, primarily FPGAs and structured ASICs, to accelerate applications that help secure, power, and connect billions of devices and the infrastructure of the smart, connected, data-centric world. We face competition from other programmable logic companies, as well as companies that make other types of semiconductor products, such as ASICs, application-specific standard products, GPUs, digital signal processors, and CPUs. Targeted growth areas for our programmable solutions include 5G, AI, intelligent edge, and cloud applications. The FPGA life cycle generally takes three or more years from the time that a design win is secured before a customer starts volume production and we receive the associated revenue.
| | | | | |
We expanded our FPGA silicon portfolio by offering additional capability with the Intel Stratix 10 FPGA family. We announced the Intel Stratix 10 NX FPGA, Intel's first AI-optimized FPGA for high-bandwidth, low-latency AI acceleration. We continued the rollout of our 10nm Intel® AgilexTM family, which leverages our innovative heterogeneous architecture that allows the capability to integrate analog, memory, custom computing, custom I/O, and Intel eASIC chiplets into a single package. | |
We continue to invest in the Intel eASIC silicon portfolio. We announced Intel eASIC N5X, the next-generation Intel eASIC device. Structured ASIC products serve as an intermediary technology between FPGAs and standard-cell ASICs that provides lower unit cost and lower power compared to FPGAs, and faster time-to-market and lower non-recurring engineering cost compared to standard-cell ASICs. Intel eASIC products have growth opportunities through adoption in 5G applications and scale across a wide range of markets. |
|
We announced several new FPGA SmartNIC platforms to help cloud service providers, communications service providers, and enterprise customers optimize and future-proof their infrastructures. Our FPGA SmartNIC platform strategy includes delivering platforms from Intel and leveraging our ecosystem partners to deliver platforms based on Intel® FPGA silicon. We introduced the Intel FPGA SmartNIC C5000X platform architecture, targeted for data center applications, and partnered with Silicom on the Silicom FPGA SmartNIC N5010 platform, powered by Intel Stratix 10 FPGAs and targeted for the communications market. |
We also announced the Intel® Open FPGA Stack (Intel® OFS), the first source-accessible FPGA hardware and software acceleration infrastructure, which will enable solution and board providers to build their own differentiated FPGA platforms for servers with Intel Xeon CPUs.
We continue to execute to our developer-first strategy with the release of oneAPI in production, with support for several Intel FPGA families and the Intel® FPGA Programmable Acceleration Card (Intel® FPGA PAC). OneAPI allows users to save significant development time and enhance productivity while using a single, unified language for CPUs, GPUs, and FPGAs.
Financial Performance
| | | | | | | | | | | | | | |
| PSG Revenue $B | | PSG Operating Income $B | |
2020 vs. 2019
Revenue decreased $134 million, driven by a decline in our communications market segment due to customer transition to 5G ASICs which benefited DCG adjacencies, and decline in our embedded market segment. The decline was partially offset by strength in the cloud and enterprise market segment.
2019 vs. 2018
Revenue decreased $136 million, driven by a decline in our cloud and enterprise market segment, offset by strength in wireless and advanced products.
2020 vs. 2019
Operating income decreased $58 million, driven by lower revenue in our embedded and communications market segments, partially offset by strength in the cloud and enterprise market segment.
2019 vs. 2018
Operating income decreased $148 million, driven by lower revenue in our cloud and enterprise market segment, offset by strength in wireless and advanced products.

| | | | | | | | |
| Overview | |
| The PC is more essential than ever, enriching lives by helping people focus, create, and connect with friends, family, and coworkers around the world. Working with our partners across the industry, we intend to continue to advance PC experiences. As the largest business unit at Intel, CCG is investing more heavily in the PC, ramping its capabilities even more aggressively, and designing the PC experience even more deliberately, including delivering a predictable cadence of leadership products. As a result, we are able to fuel innovation across Intel, providing an important source of IP, scale, and cash flow. |
| |
| Highlights and Segment Imperatives |
| |
■ | We delivered our fifth consecutive year of revenue growth, to $40.1 billion, as the PC became more essential than ever with more people working and learning from home due to COVID-19-related impacts. We maintained focus on high-growth segments and disciplined portfolio management. | "At a time when people are relying on their PCs more than ever, we are committed to creating and delivering the most advanced PC experiences to meet their real-world needs." —Gregory Bryant, Executive Vice President and General Manager, CCG |
■ | We introduced our 11th Gen Intel Core processor-based systems built on our new 10nm SuperFin process technology and launched our new 10th Gen Intel® CoreTM vPro® processors. |
■ | We continue to accelerate the pace of innovation to deliver new experiences and form factors. We announced the Intel Evo platform brand, powered by 11th Gen Intel Core processors. We experienced growth through Intel Evo-verified designs and continued growth in the commercial market segment. We also drove growth in our adjacencies in areas like systems and connectivity, while also introducing our first discrete graphics product—Intel Iris Xe MAX graphics. |
| | | | | | | | | | | | | | | | | | | | |
| ■ Revenue $B | | ■ Op Income $B | |
Market and Business Overview
Market Trends and Strategy
Time spent on PCs has increased dramatically across all major usage categories, as well as the number of PCs per household, reinforcing the importance of bringing innovative platforms and form factors to market that support and enhance user experiences. The COVID-19 pandemic has also driven a shift to notebooks that enables increased user mobility and connectivity to enable working and learning from home.
Currently, we estimate there are approximately 150 million1 enterprise and government PCs that are more than four years old. The experience and capabilities that new PCs deliver are dramatically better today, reinforcing the opportunity to drive a refresh cycle among enterprise customers. This brings a significant opportunity in the commercial market segment.
Overall, market conditions across consumer and commercial market segments continue to improve in an increasingly competitive environment. We will optimize our strategy to stay focused on these competitive market segments and exit businesses that are not delivering growth—most recently seen by our exit in our Home Gateway Platform division.
Products and Competitiveness
We are accelerating the pace of innovation and delivering a predictable cadence of leadership products, including for modern notebooks and high-end enthusiast PCs. We deliver value to our customers by leveraging our engineering capabilities and working with our partners to deliver technology across every major vector of the computing experience, including performance, battery life, connectivity, memory, graphics, and form factors to create the most advanced PC platforms.
We launched our 11th Gen Intel Core processors with Intel Iris Xe graphics. This latest generation of processors, powered by our new 10nm SuperFin transistors, combines new industry technologies like Wi-Fi 6 (Gig+), Thunderbolt 4, AV1 media decode, CPU-attached PCIe Gen 4 interface, and hardware-hardened security features. There were more than 100 designs based on 11th Gen Intel Core processors by the end of 2020 from partners including Acer, Asus, Dell, HP, Lenovo, LG, Razer, Samsung, and others, and approximately 50 additional designs are expected in 2021.
We announced the Intel Evo platform brand powered by 11th Gen Intel Core processors with Intel Iris Xe graphics, representing laptop designs made possible by Intel's Project Athena innovation program. Laptop designs built on the Intel Evo platform will feature the Intel Evo badge, signaling that they are tested and verified in Intel labs to ensure they deliver new experience targets or key experience indicators defined by real-world usage models and innovation across areas like responsiveness, battery life, instant wake, and connectivity.
We also introduced three additions to our 10th Gen Intel Core processor family, extending our leadership in gaming and business. The Intel Core H-series mobile processors include a new H-series processor that delivers desktop-caliber performance that gamers and creators can take anywhere; the Intel Core S-series desktop processors include Intel's flagship Core i9-10900K processor, featuring up to 10 cores, 20 threads and DDR4-2933 memory speeds; and our new 10th Gen Intel Core vPro processors are designed for enterprise needs and deliver increased productivity improvements, connectivity, security features, and remote manageability.
We expanded the Intel NUC small form factor product lines for commercial, gaming, and channel laptops, and launched the Intel NUC Elements modular product. At the end of 2020, these product lines started the transition to 11th Gen Intel Core processors. We continue to enhance our platform products with new adjacent technologies. We launched the Intel® Wi-Fi 6 (Gig+) 802.11ax connectivity solution, the first Wi-Fi 6 solution in the PC market, featuring faster speeds, increased throughput, and better experiences for activities such as video conferencing. We are driving new industry standards for USB-C connector-based products with the introduction of Thunderbolt 4, Intel's universal cable connectivity solution. Strong adoption of ThunderboltTM 3 continues, and it serves as the underlying architecture of USB4.
We continue to focus on an advanced pace of innovation and a predictable cadence of leadership products. We operate in a particularly competitive market with strong competition from AMD; vendors who use applications processors based on ARM architecture, such as Qualcomm Inc. (Qualcomm); and customers who internally develop their own semiconductors, which now include Apple Inc. (Apple). We expect this competitive environment to intensify in 2021.
1 Source: Intel calculated the volume of devices over four years old from industry analyst reports and internal data.
Financial Performance
| | | | | | | | | | | | | | |
| CCG Revenue $B | | CCG Operating Income $B | |
▪Increased unit sales driven by strength in notebook demand, partially offset by lower desktop demand.
▪Lower notebook ASPs resulting from higher demand for consumer education PCs, partially offset by higher desktop ASPs from increased demand for performance products in the gaming market segment.
▪Weakness in adjacent revenue driven by volume decline in LTE modem and connected home devices, partially offset by strength in Wi-Fi sales.
| | | | | | | | | | | | | | | | | | | | | | | | | | | | | | | | |
| | 2020 vs. 2019 | | 2019 vs. 2018 |
| (In Millions) | | % | | $ Impact | | % | | $ Impact |
| | | | | | | | | | |
Desktop platform volume | | down | (11)% | | $ | (1,316) | | | down | (6)% | | $ | (705) | |
Desktop platform ASP | | up | 2% | | 186 | | | up | 3% | | 307 | |
Notebook platform volume | | up | 28% | | 5,770 | | | down | (5)% | | (1,080) | |
Notebook platform ASP | | down | (6)% | | (1,646) | | | up | 5% | | 929 | |
Adjacent products and other | | | | | (83) | | | | | | 691 | |
| | | | | | | | | | |
| Total change in revenue | | | | | $ | 2,911 | | | | | | $ | 142 | |
Operating income remained flat year over year, and operating margin was 38% in 2020.
| | | | | | | | |
| (In Millions) | | |
| $ | 15,129 | | | 2020 Operating Income |
| (3,025) | | | Higher platform unit cost primarily from increased mix of 10nm products |
| (125) | | | Primarily driven by higher logistic expenses due to COVID-19 |
| 1,715 | | | Higher gross margin from platform revenue |
| 640 | | | Lower operating expenses |
| 420 | | | Lower period charges due to lower start-up cost associated with 10nm products and sell-through of previously reserved platform products related to our 10nm process technology |
| 300 | | | Higher CCG adjacent product margin |
| 2 | | | Other |
| $ | 15,202 | | | 2019 Operating Income |
| 1,425 | | | Lower period charges primarily due to lower factory start-up costs and sell-through of previously reserved non-qualified platform product associated with our 10nm process technology |
| 725 | | | Lower operating expenses primarily driven by lower investment in modem |
| (1,170) | | | Higher platform unit cost |
| (145) | | | Lower gross margin from platform revenue |
| | |
| | |
| 145 | | | Other |
| $ | 14,222 | | | 2018 Operating Income |
| | | | | |
| Consolidated Results of Operations | |
| |
We achieved record revenue in 2020 amid a volatile environment. Data-centric and PC-centric revenue were both up, driven by growth in DCG, CCG, and NSG. Our gross margin was impacted by a higher mix of 10nm products, but we reduced spending to 25.3% of revenue while increasing our investment in R&D.
| | | | | | | | | | | | | | | | | | | | | | | | | | | | | | | | | | | | | | |
Years Ended
(In Millions, Except Per Share Amounts) | | December 26, 2020 | | December 28, 2019 | | December 29, 2018 |
| Amount | | % of Net
Revenue | | Amount | | % of Net
Revenue | | Amount | | % of Net
Revenue |
| Net revenue | | $ | 77,867 | | | 100.0 | % | | $ | 71,965 | | | 100.0 | % | | $ | 70,848 | | | 100.0 | % |
| Cost of sales | | 34,255 | | | 44.0 | % | | 29,825 | | | 41.4 | % | | 27,111 | | | 38.3 | % |
| Gross margin | | 43,612 | | | 56.0 | % | | 42,140 | | | 58.6 | % | | 43,737 | | | 61.7 | % |
| Research and development | | 13,556 | | | 17.4 | % | | 13,362 | | | 18.6 | % | | 13,543 | | | 19.1 | % |
| Marketing, general and administrative | | 6,180 | | | 7.9 | % | | 6,350 | | | 8.8 | % | | 6,950 | | | 9.8 | % |
| Restructuring and other charges | | 198 | | | 0.3 | % | | 393 | | | 0.5 | % | | (72) | | | (0.1) | % |
| | | | | | | | | | | | |
| Operating income | | 23,678 | | | 30.4 | % | | 22,035 | | | 30.6 | % | | 23,316 | | | 32.9 | % |
| Gains (losses) on equity investments, net | | 1,904 | | | 2.4 | % | | 1,539 | | | 2.1 | % | | (125) | | | (0.2) | % |
| Interest and other, net | | (504) | | | (0.6) | % | | 484 | | | 0.7 | % | | 126 | | | 0.2 | % |
| Income before taxes | | 25,078 | | | 32.2 | % | | 24,058 | | | 33.4 | % | | 23,317 | | | 32.9 | % |
| Provision for taxes | | 4,179 | | | 5.4 | % | | 3,010 | | | 4.2 | % | | 2,264 | | | 3.2 | % |
| Net income | | $ | 20,899 | | | 26.8 | % | | $ | 21,048 | | | 29.2 | % | | $ | 21,053 | | | 29.7 | % |
| Earnings per share—diluted | | $ | 4.94 | | | | | $ | 4.71 | | | | | $ | 4.48 | | | |
Revenue
Our total revenue grew from $59.4 billion in 2016 to $77.9 billion in 2020, representing 7% CAGR. Data-centric businesses collectively grew faster than Intel at 9% CAGR over the last five years and are approaching 50% of our revenue.
| | |
| PC to Data-centric Transformation Over the Last 5 years |
| | | | | | | | | | | | | | |
| ■ PC-centric $B | ■ Data-centric $B | — Data-centric as a % of total Intel revenue
| |
2020 vs. 2019
In 2020, revenue was $77.9 billion, up $5.9 billion, or 8%, from 2019. Our data-centric businesses collectively grew 9% due to increased platform volume as cloud service providers increased capacity to serve customer demand. We also saw continued growth in DCG communications service providers, partially offset by enterprise and government decline. We saw growth in DCG adjacencies driven by 5G networking deployment and improved NAND pricing and higher demand in NAND, partially offset by weaker core mix and demand in IOTG platform products due to COVID-19. Our PC-centric business was up 8% year over year driven by strength in notebook and Wi-Fi sales. That growth was slightly offset by lower desktop volume and lower notebook ASPs resulting from higher demand for consumer and education PCs, and volume decline in LTE modem and connected home following the exit of those businesses.
2019 vs. 2018
In 2019, revenue was $72.0 billion, up $1.1 billion, or 2%, from 2018. Our data-centric businesses collectively grew 3% year over year and made up nearly half of our total revenue in 2019. Platform ASPs increased due to stronger core mix offset by a decline in NSG ASPs due to lower NAND market pricing and a decrease in DCG platform unit sales as the enterprise and government market segment contracted. Our PC-centric business was flat year over year as ASP strength from richer commercial segment mix and modem growth were offset by declines in platform volume.
Gross Margin
We derived most of our overall gross margin dollars from the sale of platform products in the DCG and CCG operating segments. Our overall gross margin dollars in 2020 increased by $1.5 billion, or approximately 3%, compared to 2019, and in 2019 decreased by $1.6 billion, or 4%, compared to 2018. Our gross margin percentage was down as the increase in platform revenue was offset by higher platform unit cost and a higher portion of our revenue from lower margin adjacent businesses.
| | | |
| Gross Margin $B |
| (Percentages in chart indicate gross margin as a percentage of total revenue) |
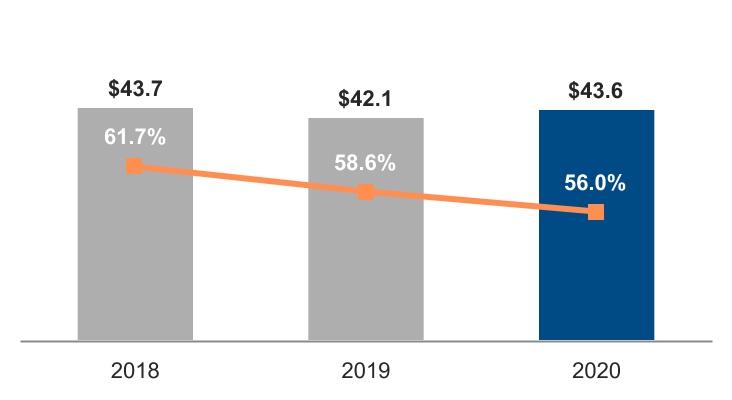
| | | | | | | | |
| (In Millions) | | |
| $ | 43,612 | | | 2020 Gross Margin |
| 2,360 | | | Higher gross margin from platform revenue |
| 1,855 | | | Higher gross margin from adjacent businesses primarily due to higher margins on NAND, modem, and Wi-Fi, partially offset by lower margins on DCG adjacencies |
| 630 | | | Lower factory start-up costs associated with our 10nm process technology |
| 155 | | | Lower period charges |
| (3,285) | | | Higher platform unit cost primarily from increased mix of 10nm products |
| (255) | | | Primarily driven by higher logistic expenses due to COVID-19 |
| | |
| 12 | | | Other |
| $ | 42,140 | | | 2019 Gross Margin |
| (1,360) | | | Lower gross margin from adjacent businesses primarily due to NAND, DCG adjacencies, and PSG offset by higher gross margin on Mobileye |
| (1,300) | | | Higher platform unit cost, primarily from increased mix of performance products |
| 580 | | | Higher gross margin from platform revenue |
| 490 | | | Lower period charges primarily due to lower factory start-up costs and sell-through of previously reserved non-qualified platform product, offset by higher initial production costs associated with our 10nm process technology |
| (7) | | | Other |
| | |
| | |
| | |
| $ | 43,737 | | | 2018 Gross Margin |
Operating Expenses
Total R&D and MG&A expenses for 2020 were $19.7 billion, flat compared to 2019. These expenses represented 25.3% of revenue for 2020 and 27.4% of revenue for 2019.
We continue to invest in R&D to accelerate our growth and profitability, while driving operational efficiencies to reduce our MG&A spending.
| | | | | | | | |
| Research and Development $B | | Marketing, General, and Administrative $B |
| (Percentages indicate expenses as a percentage of total revenue) |
| | | | | | | |
| 2020 vs. 2019 | | |
| | | |
| R&D spending increased by $194 million, or 1%, driven by the following: | | |
| | | |
| + | Investments in our process technology | | |
| + | Investments in our PC and data-centric businesses | | |
| - | Ramp down of 5G smartphone modem business | | |
| - | Incentive-based cash compensation | | |
| | | |
| | | |
| 2019 vs. 2018 | | |
| | | |
| R&D spending decreased by $181 million, or 1%, driven by the following: | | |
| | | |
| - | Ramp down of 5G smartphone modem business and other projects | | |
| - | Incentive-based cash compensation | | |
| - | Corporate spending efficiencies | | |
| + | Investments in our data-centric businesses | | |
| + | Investments in our process technology | | |
| | |
| Marketing, General and Administrative |
| | | | | | | |
| 2020 vs. 2019 | | |
| | | |
| MG&A spending decreased by $170 million, or 3%, driven by the following: | | |
| | | |
| - | Corporate spending efficiencies | | |
| - | Incentive-based cash compensation | | |
| | | |
| | | |
| | | |
| 2019 vs. 2018 | | |
| | | |
| MG&A spending decreased by $600 million, or 9%, driven by the following: | | |
| | | |
| - | Corporate spending efficiencies | | |
| - | Reduction in marketing programs | | |
| - | Incentive-based cash compensation | | |
| - | Lower expenses due to the Wind River divestiture in Q2 2018 | | |
| | | |
| | | |
Gains (Losses) on Equity Investments and Interest and Other, Net
| | | | | | | | | | | | | | | | | | | | |
| Years Ended (In Millions) | | Dec 26, 2020 | | Dec 28, 2019 | | Dec 29, 2018 |
| Ongoing mark-to-market adjustments on marketable equity securities | | $ | (133) | | | $ | 277 | | | $ | (129) | |
| Observable price adjustments on non-marketable equity securities | | 176 | | | 293 | | | 202 | |
| Impairment charges | | (303) | | | (122) | | | (424) | |
Sale of equity investments and other | | 2,164 | | | 1,091 | | | 226 | |
| Gains (losses) on equity investments, net | | $ | 1,904 | | | $ | 1,539 | | | $ | (125) | |
| | | | | | |
| Interest and other, net | | $ | (504) | | | $ | 484 | | | $ | 126 | |
Gains (Losses) on Equity Investments, Net
Ongoing mark-to-market net gains and losses reported during 2020 were primarily driven by Montage Technology, Co. Ltd. (Montage); 2019 and 2018 net gains and losses were primarily driven by ASML Holding N.V. (ASML) and Cloudera. In 2019, we sold our equity investment in ASML.
During 2020, we recognized higher than historically experienced impairment charges on our non-marketable portfolio based on our assessment of the impact of recent public and private market volatility and tightening of liquidity. We recognized impairments of $290 million on non-marketable equity securities ($122 million in 2019 and $132 million in 2018). In 2018, we recognized an impairment charge of $290 million in our equity method investment in IMFT.
In sale of equity investments and other, we recognized $1.1 billion on the initial fair value adjustment from a Montage holding becoming marketable and $606 million related to four other equity investments that went public in 2020. We recognized McAfee dividends of $126 million in 2020 and $632 million in 2019, and in 2019 we recognized $107 million from our sale of our non-controlling interest in IMFT.
Interest and Other, Net
We recognized a net loss in interest and other in 2020 compared to a net gain in 2019, primarily due to lower divestiture gains in 2020 compared to 2019.
We recognized a higher net gain in interest and other in 2019 compared to 2018, primarily due to lower loss on debt conversions and larger divestiture gains in 2019 compared to 2018.
Provision for Taxes
| | | | | | | | | | | | | | | | | | | | |
| Years Ended (Dollars in Millions) | | Dec 26, 2020 | | Dec 28, 2019 | | Dec 29, 2018 |
| Income before taxes | | $ | 25,078 | | | $ | 24,058 | | | $ | 23,317 | |
| Provision for taxes | | $ | 4,179 | | | $ | 3,010 | | | $ | 2,264 | |
| Effective tax rate | | 16.7 | % | | 12.5 | % | | 9.7 | % |
Our effective tax rate increased in 2020 compared to 2019, primarily driven by a change in our permanent reinvestment assertion with respect to undistributed earnings in China, as a result of our planned divestiture of the NAND memory business. It also increased due to the reduction in our foreign derived intangible income benefit in 2020.
Our effective tax rate increased in 2019 compared to 2018, primarily driven by one-time benefits that occurred in 2018.
Liquidity and Capital Resources
We consider the following when assessing our liquidity and capital resources:
| | | | | | | | | | | | | | |
| (In Millions) | | Dec 26, 2020 | | Dec 28, 2019 |
| Cash and cash equivalents, short-term investments, and trading assets | | $ | 23,895 | | | $ | 13,123 | |
| Other long-term investments | | $ | 2,192 | | | $ | 3,276 | |
| Loans receivable and other | | $ | 947 | | | $ | 1,239 | |
| Reverse repurchase agreements with original maturities greater than three months | | $ | — | | | $ | 350 | |
| | | | |
| Total debt | | $ | 36,401 | | | $ | 29,001 | |
| Temporary equity | | $ | — | | | $ | 155 | |
Cash generated by operations is our primary source of liquidity. When assessing our sources of liquidity, we include cash and investments as shown in the preceding table. We maintain a diverse investment portfolio that we continually analyze based on issuer, industry, and country. Substantially all of our investments in debt instruments and financing receivables are in investment-grade securities.
Other potential sources of liquidity include our commercial paper program and our automatic shelf registration statement on file with the SEC, pursuant to which we may offer an unspecified amount of debt, equity, and other securities. Under our commercial paper program, we have an ongoing authorization from our Board of Directors to borrow up to $10.0 billion. As of December 26, 2020, we had no commercial paper outstanding. During 2020, we issued a total of $10.3 billion aggregate principal amount of senior notes and repaid $1.0 billion of our 1.85% senior notes that matured in May 2020 and $1.8 billion of our 2.45% senior notes that matured in July 2020. We also repaid $700 million in floating-rate senior notes that matured in May 2020. Additionally, we paid $1.1 billion to satisfy conversion obligations for the remaining $372 million of our $2.0 billion 2009 Debentures.
On March 24, 2020, we suspended the use of our financial resources for stock repurchases. On August 19, 2020, in response to our belief that our stock was trading well below its intrinsic valuation at that time, we entered into ASR agreements to repurchase an aggregate of $10.0 billion of our common stock. In total, we have repurchased approximately $17.6 billion in shares as part of our planned $20.0 billion share repurchases announced in October 2019. We intend to complete the remaining $2.4 billion balance of these planned repurchases in Q1 2021.
We believe we have sufficient financial resources to meet our business requirements in the next 12 months, including capital expenditures for worldwide manufacturing and assembly and test; working capital requirements; and potential acquisitions, strategic investments, dividends, and common stock repurchases.
| | | |
Sources and Uses of Cash (In Millions) | |
In summary, our cash flows for each period were as follows:
| | | | | | | | | | | | | | | | | | | | |
| Years Ended (In Millions) | | Dec 26, 2020 | | Dec 28, 2019 | | Dec 29, 2018 |
| Net cash provided by operating activities | | $ | 35,384 | | | $ | 33,145 | | | $ | 29,432 | |
| Net cash used for investing activities | | (20,796) | | | (14,405) | | | (11,239) | |
| Net cash provided by (used for) financing activities | | (12,917) | | | (17,565) | | | (18,607) | |
| | | | | | |
| Net increase (decrease) in cash and cash equivalents | | $ | 1,671 | | | $ | 1,175 | | | $ | (414) | |
Operating Activities
Cash provided by operating activities is net income adjusted for certain non-cash items and changes in assets and liabilities.
For 2020 compared to 2019, the $2.2 billion increase in cash provided by operating activities was primarily due to changes in working capital. Changes in working capital were driven by accounts receivable, inventory, and income taxes, offset by other assets and liabilities.
For 2019 compared to 2018, the $3.7 billion increase in cash provided by operating activities was primarily due to changes in working capital. Changes in working capital were driven by taxes, other assets and liabilities, and accounts receivable, offset by customer utilization of prepaid supply agreement payments and inventory build.
Investing Activities
Investing cash flows consist primarily of capital expenditures, investment purchases, sales, maturities, and disposals, and proceeds from divestitures and cash used for acquisitions. Our capital expenditures were $14.3 billion in 2020, excluding NAND capital expenditures subsequent to the held for sale date ($16.2 billion in 2019 and $15.2 billion in 2018).
The increase in cash used for investing activities in 2020 compared to 2019 was primarily due to an increase in purchases of available-for-sale debt investments and trading assets, offset by an increase in maturities and sales of available-for-sale debt investments and trading assets, and a decrease in capital expenditures and cash paid for acquisitions.
The increase in cash used for investing activities in 2019 compared to 2018 was primarily due to net trading asset activity, acquisitions, and capital expenditures. The increase was partially offset by net available-for-sale debt investment activity.
Financing Activities
Financing cash flows consist primarily of repurchases of common stock, payment of dividends to stockholders, issuance and repayment of short-term and long-term debt, and proceeds from the sale of shares of common stock through employee equity incentive plans.
The decrease in cash used for financing activities in 2020 compared to 2019 was primarily due to an increase in cash provided by long-term debt issuances, offset by an increase in repayments of debt and debt conversions and an increase in repurchases of common stock. During 2020, we repurchased $14.2 billion of common stock under our authorized common stock repurchase program, compared to $13.6 billion in 2019. As of December 26, 2020, $9.7 billion remained available for repurchasing common stock under the repurchase authorization limit. Our total dividend payments were $5.6 billion in 2020 compared to $5.6 billion in 2019. We have paid a cash dividend in each of the past 113 quarters.
The decrease in cash used for financing activities in 2019 compared to 2018 was primarily due to increased long-term debt issuance, offset by increased repurchases of common stock.
Contractual Obligations
Significant contractual obligations as of December 26, 2020 were as follows:
| | | | | | | | | | | | | | | | | | | | | | | | | | | | | | | | |
| | Payments Due by Period |
| (In Millions) | | Total | | Less than
1 year | | 1–3 years | | 3–5 years | | More than
5 years |
Operating lease obligations1 | | $ | 559 | | | $ | 175 | | | $ | 229 | | | $ | 121 | | | $ | 34 | |
Capital purchase obligations2 | | 8,570 | | | 8,006 | | | 556 | | | 8 | | | — | |
Other purchase obligations and commitments3 | | 2,585 | | | 1,831 | | | 598 | | | 149 | | | 7 | |
Tax obligations4 | | 4,418 | | | 259 | | | 1,234 | | | 2,478 | | | 447 | |
Long-term debt obligations5 | | 55,543 | | | 3,725 | | | 7,046 | | | 7,571 | | | 37,201 | |
Other long-term liabilities6 | | 2,059 | | | 1,072 | | | 820 | | | 41 | | | 126 | |
Total7 | | $ | 73,734 | | | $ | 15,068 | | | $ | 10,483 | | | $ | 10,368 | | | $ | 37,815 | |
1Operating lease obligations represent the undiscounted lease payments under non-cancelable leases, but exclude non-lease components.
2Capital purchase obligations represent commitments for the construction or purchase of property, plant and equipment. They were not recorded as liabilities on our Consolidated Balance Sheets as of December 26, 2020, as we had not yet received the related goods nor taken title to the property.
3Other purchase obligations and commitments include payments due under various types of licenses and agreements to purchase goods or services.
4Tax obligations represent the future cash payments related to Tax Reform enacted in 2017 for the one-time transition tax on our previously untaxed foreign earnings. For further information, see "Note 8: Income Taxes" within the Consolidated Financial Statements.
5Amounts represent principal payments for all debt obligations and interest payments for fixed-rate debt obligations. Interest payments on floating-rate debt obligations, as well as the impact of fixed-rate to floating-rate debt swaps, are excluded.
6Amounts represent future cash payments to satisfy other long-term liabilities recorded on our Consolidated Balance Sheets, including the short-term portion of these long-term liabilities. Derivative instruments are excluded from the preceding table because they do not represent the amounts that may ultimately be paid.
7Total excludes contractual obligations already recorded on our Consolidated Balance Sheets as current liabilities, except for the short-term portions of long-term debt obligations and other long-term liabilities.
The expected timing of payments of the obligations in the preceding table is estimated based on current information. Timing of payments and actual amounts paid may be different, depending on the time of receipt of goods or services, or changes to agreed-upon amounts for some obligations.
Contractual obligations for purchases of goods or services included in "Other purchase obligations and commitments" in the preceding table include agreements that are enforceable and legally binding and that specify all significant terms, including fixed or minimum quantities to be purchased; fixed, minimum, or variable price provisions; and the approximate timing of the transaction. For obligations with cancellation provisions, the amounts included in the preceding table were limited to the non-cancelable portion of the agreement terms or the minimum cancellation fee.
For the purchase of raw materials, we have entered into certain agreements that specify minimum prices and quantities based on a percentage of the total available market or based on a percentage of our future purchasing requirements. Due to the uncertainty of the future market and our future purchasing requirements, as well as the non-binding nature of these agreements, obligations under these agreements have been excluded from the preceding table. Our purchase orders for other products are based on our current manufacturing needs and are fulfilled by our vendors within short time horizons. In addition, some of our purchase orders represent authorizations to purchase rather than binding agreements.
Contractual obligations that are contingent upon the achievement of certain milestones have been excluded from the preceding table. Approximately half of our milestone-based contracts are tooling related for the purchase of capital equipment. These arrangements are not considered contractual obligations until the milestone is met by the counterparty. As of December 26, 2020, assuming that all future milestones are met, the additional required payments would be approximately $530 million.
For the majority of RSUs granted, the number of shares of common stock issued on the date the RSUs vest is net of the minimum statutory withholding requirements that we pay in cash to the appropriate taxing authorities on behalf of our employees. The obligation to pay the relevant taxing authority is excluded from the preceding table, as the amount is contingent upon continued employment. In addition, the amount of the obligation is unknown, as it is based in part on the market price of our common stock when the awards vest.
Quantitative and Qualitative Disclosures About Market Risk
We are affected by changes in currency exchange and interest rates, as well as equity and commodity prices. Our risk management programs are designed to reduce, but may not entirely eliminate, the impacts of these risks. All of the following potential changes are based on sensitivity analyses performed on our financial positions as of December 26, 2020 and December 28, 2019. Actual results may differ materially.
Currency Exchange Rates
We are exposed to currency exchange risks of non-U.S.-dollar-denominated investments in debt and equity instruments and loans receivable, and may economically hedge this risk with foreign currency contracts, such as currency forward contracts or currency interest rate swaps. Gains or losses on these non-U.S.-currency investments are generally offset by corresponding losses or gains on the related hedging instruments. We are exposed to currency exchange risks from our non-U.S.-dollar-denominated debt indebtedness and may use foreign currency contracts designated as cash flow hedges to manage this risk.
Substantially all of our revenue is transacted in U.S. dollars. However, a significant portion of our operating expenditures and capital purchases are incurred in other currencies, primarily the euro, the Japanese yen, the Israeli shekel, and the Chinese yuan. We have established currency risk management programs to protect against currency exchange rate risks associated with non-U.S. dollar forecasted future cash flows and existing non-U.S. dollar monetary assets and liabilities. We may also hedge currency risk arising from funding of foreign currency-denominated future investments. We may utilize foreign currency contracts, such as currency forwards or option contracts in these hedging programs. We considered the historical trends in currency exchange rates and determined that it was reasonably possible that a weighted average adverse change of 10% in currency exchange rates could be experienced in the near term. Such an adverse change, after taking into account balance sheet hedges only and offsetting recorded monetary asset and liability positions outstanding as of December 26, 2020 and December 28, 2019, would result in an adverse impact on income before taxes of less than $61 million and less than $38 million, respectively.
Interest Rates
We are exposed to interest rate risk related to our fixed-rate investment portfolio and outstanding debt. The primary objective of our investment policy is to preserve principal and the financial flexibility to fund our business while maximizing yields, which generally track the U.S. dollar three-month LIBOR. We generally enter into interest rate contracts to convert the returns on our fixed-rate debt investment with remaining maturities longer than six months into U.S. dollar three-month LIBOR-based returns. We also enter into swaps to convert fixed-rate coupon payments into floating-rate coupon payments for our existing indebtedness. Gains or losses on these instruments are generally offset by corresponding losses or gains on the related hedging instruments.
A hypothetical increase in benchmark interest rates of up to 1%, after taking into account investment hedges, would have resulted in a decrease in the fair value of our investment portfolio of approximately $75 million as of December 26, 2020 (a hypothetical decrease of 1% would have resulted in an increase of approximately $88 million as of December 28, 2019).
Taking into account floating-rate debt and fixed-rate debt that is swapped to floating-rate debt, a hypothetical increase in interest rates of up to 1% would result in an increase in annual interest expense on our indebtedness of approximately $132 million from debt outstanding as of December 26, 2020 (an increase of approximately $139 million from debt outstanding as of December 28, 2019).
Equity Prices
We are exposed to equity market risk through our investments in marketable equity securities, which we typically do not attempt to reduce or eliminate through hedging activities.
As of December 26, 2020, the fair value of our marketable equity securities was $1.8 billion ($450 million as of December 28, 2019). Substantially all of our marketable equity securities portfolio as of December 26, 2020 was concentrated in securities traded on the Chinese Shanghai Stock Exchange Science and Technology Innovation Board. To determine reasonably possible decreases in the market value of our marketable equity securities, we have analyzed the historical market price sensitivity of our portfolio. Assuming a decline of 60% in market prices, the aggregate value of our marketable equity securities could decrease by approximately $1.1 billion, based on the value as of December 26, 2020 (a decrease in value of approximately $180 million, based on the value as of December 28, 2019 using an assumed decline of 40%).
We utilize total return swaps to offset changes in liabilities related to the equity market risks of certain deferred compensation arrangements. Gains or losses from changes in fair value of these total return swaps are generally offset by the losses or gains on the related liabilities.
Many of the same factors that could result in an adverse movement of equity market prices affect our non-marketable equity investments, although we cannot always quantify the impacts directly. Financial markets are volatile, which could negatively affect the prospects of the companies we invest in, their ability to raise additional capital, and the likelihood of our ability to realize value in our investments through liquidity events such as initial public offerings, mergers, and private sales. These types of investments involve a great deal of risk, and there can be no assurance that any specific company will grow or become successful; consequently, we could lose all or part of our investment. Our non-marketable equity securities had a carrying amount of $3.3 billion as of December 26, 2020 ($3.5 billion as of December 28, 2019) and included our investment in Beijing Unisoc Technology Ltd. of $658 million ($658 million as of December 28, 2019). The carrying amount of our equity method investments was $18 million as of December 26, 2020 ($37 million as of December 28, 2019).
Commodity Price Risk
Although we operate facilities that consume commodities, we are not directly affected by commodity price risk to a material degree. We have established forecasted transaction risk management programs to protect against fluctuations in commodity prices. We may use commodity derivatives contracts, such as commodity swaps, in these hedging programs. In addition, we have sourcing plans in place that are designed to mitigate the risk of a potential supplier concentration for our key commodities.
Non-GAAP Financial Measures
In addition to disclosing financial results in accordance with U.S. GAAP, this document contains references to the non-GAAP financial measures below. We believe these non-GAAP financial measures provide investors with useful supplemental information about our operating performance, enable comparison of financial trends and results between periods where certain items may vary independent of business performance, and allow for greater transparency with respect to key metrics used by management in operating our business and measuring our performance.
Our non-GAAP financial measures reflect adjustments based on one or more of the following items, as well as the related income tax effects where applicable. Income tax effects have been calculated using an appropriate tax rate for each adjustment. These non-GAAP financial measures should not be considered a substitute for, or superior to, financial measures calculated in accordance with U.S. GAAP, and the financial results calculated in accordance with U.S. GAAP and reconciliations from these results should be carefully evaluated.
| | | | | | | | |
| Non-GAAP adjustment or measure | Definition | Usefulness to management and investors |
| Acquisition-related adjustments | Amortization of acquisition-related intangible assets consists of amortization of intangible assets such as developed technology, brands, and customer relationships acquired in connection with business combinations. Charges related to the amortization of these intangibles are recorded within both cost of sales and MG&A in our U.S. GAAP financial statements. Amortization charges are recorded over the estimated useful life of the related acquired intangible asset, and thus are generally recorded over multiple years. | We exclude amortization charges for our acquisition-related intangible assets for purposes of calculating certain non-GAAP measures because these charges are inconsistent in size and are significantly impacted by the timing and valuation of our acquisitions. These adjustments facilitate a useful evaluation of our current operating performance and comparison to our past operating performance and provide investors with additional means to evaluate cost and expense trends. |
| Restructuring and other charges | Restructuring charges are costs associated with a formal restructuring plan and are primarily related to employee severance and benefit arrangements. Other charges include asset impairments, pension charges, and costs associated with restructuring activity. | We exclude restructuring and other charges, including any adjustments to charges recorded in prior periods, for purposes of calculating certain non-GAAP measures because these costs do not reflect our current operating performance. These adjustments facilitate a useful evaluation of our current operating performance and comparisons to past operating results and provide investors with additional means to evaluate expense trends. |
| Gains (losses) from divestiture | Gains or losses are recognized at the close of a divestiture. | We exclude gains or losses resulting from divestitures for purposes of calculating certain non-GAAP measures because they do not reflect our current operating performance. These adjustments facilitate a useful evaluation of our current operating performance and comparisons to past operating results. |
| Ongoing mark-to-market on marketable equity securities | After the initial mark-to-market adjustment is recorded upon a security becoming marketable, gains and losses are recognized from ongoing mark-to-market adjustments of our marketable equity securities. | We exclude these ongoing gains and losses for purposes of calculating certain non-GAAP measures because we do not believe this volatility correlates to our core operational performance. These adjustments facilitate a useful evaluation of our current operating performance and comparisons to past operating results. |
| Tax Reform | We made adjustments to the original estimate of income tax expense resulting from Tax Reform. | We exclude adjustments to the provisional tax estimate for purposes of calculating certain non-GAAP measures because they are the result of regulatory change and do not reflect our current operating performance. These adjustments facilitate a useful evaluation of our current operating performance and comparisons to past operating results. |
| Free cash flow | We reference a non-GAAP financial measure of free cash flow, which is used by management when assessing our sources of liquidity, capital resources, and quality of earnings. Free cash flow is operating cash flow adjusted to exclude additions to property, plant and equipment. We also reference a ratio of free cash flow to non-GAAP net income. | This non-GAAP financial measure is helpful in understanding our capital requirements and provides an additional means to evaluate the cash flow trends of our business. We excluded additions to held for sale NAND property, plant and equipment because the additions are not representative of our long-term capital requirements and we expect these assets to be sold. The ratio of free cash flow to non-GAAP net income is helpful in comparing the results and trends of our adjusted cash flow to income. |
Following are the reconciliations of our most comparable U.S. GAAP measures to our non-GAAP measures presented:
| | | | | | | | | | | | | | | | | | | | |
| Years Ended (In Millions, Except Per Share Amounts) | | Dec 26, 2020 | | Dec 28, 2019 | | Dec 29, 2018 |
| Operating income | | $ | 23,678 | | | $ | 22,035 | | | $ | 23,316 | |
| Acquisition-related adjustments | | 1,416 | | | 1,324 | | | 1,305 | |
| | | | | | |
| | | | | | |
| | | | | | |
| | | | | | |
| Restructuring and other charges | | 198 | | | 393 | | | (72) | |
| Non-GAAP operating income | | $ | 25,292 | | | $ | 23,752 | | | $ | 24,549 | |
| | | | | | |
| Operating margin | | 30.4 | % | | 30.6 | % | | 32.9 | % |
| Acquisition-related adjustments | | 1.8 | % | | 1.8 | % | | 1.8 | % |
| | | | | | |
| | | | | | |
| | | | | | |
| | | | | | |
| Restructuring and other charges | | 0.3 | % | | 0.5 | % | | (0.1) | % |
| Non-GAAP operating margin | | 32.5 | % | | 33.0 | % | | 34.7 | % |
| | | | | | |
| Net income | | $ | 20,899 | | | $ | 21,048 | | | $ | 21,053 | |
| Acquisition-related adjustments | | 1,416 | | | 1,324 | | | 1,305 | |
| | | | | | |
| | | | | | |
| | | | | | |
| Restructuring and other charges | | 198 | | | 393 | | | (72) | |
| | | | | | |
| | | | | | |
| (Gains) losses from divestiture | | (6) | | | (690) | | | (494) | |
| Ongoing mark-to-market on marketable equity securities | | 133 | | | (277) | | | 129 | |
| Tax Reform | | — | | | — | | | (294) | |
| Income tax effects | | (209) | | | (14) | | | (102) | |
| Non-GAAP net income | | $ | 22,431 | | | $ | 21,784 | | | $ | 21,525 | |
| | | | | | |
| Earnings per share—diluted | | $ | 4.94 | | | $ | 4.71 | | | $ | 4.48 | |
| Acquisition-related adjustments | | 0.33 | | | 0.29 | | | 0.28 | |
| | | | | | |
| | | | | | |
| | | | | | |
| | | | | | |
| Restructuring and other charges | | 0.05 | | | 0.09 | | | (0.02) | |
| (Gains) losses from divestiture | | — | | | (0.16) | | | (0.11) | |
| Ongoing mark-to-market on marketable equity securities | | 0.03 | | | (0.06) | | | 0.03 | |
| Tax Reform | | — | | | — | | | (0.06) | |
| Income tax effects | | (0.05) | | | — | | | (0.02) | |
| Non-GAAP earnings per share—diluted | | $ | 5.30 | | | $ | 4.87 | | | $ | 4.58 | |
| | | | | | | | | | | | | | | | | | | | | | | | | | | | | | | | |
| Years Ended (In Millions) | | Dec 26, 2020 | | Dec 28, 2019 | | Dec 29, 2018 | | Dec 30, 2017 | | Dec 31, 2016 |
| Net cash provided by operating activities | | $ | 35,384 | | | $ | 33,145 | | | $ | 29,432 | | | $ | 22,110 | | | $ | 21,808 | |
| Additions to property, plant and equipment | | (14,259) | | | (16,213) | | | (15,181) | | | (11,778) | | | (9,625) | |
| Free cash flow | | $ | 21,125 | | | $ | 16,932 | | | $ | 14,251 | | | $ | 10,332 | | | $ | 12,183 | |
| | | | | | | | | | |
| Net cash used for investing activities | | $ | (20,796) | | | $ | (14,405) | | | $ | (11,239) | | | $ | (15,762) | | | $ | (25,817) | |
| Net cash provided by (used for) financing activities | | $ | (12,917) | | | $ | (17,565) | | | $ | (18,607) | | | $ | (8,475) | | | $ | (5,739) | |
Selected Financial Data
| | | | | | | | | | | | | | | | | | | | | | | | | | | | | | | | |
Years Ended
(In Millions, Except Per Share Amounts) | | Dec 26, 2020 | | Dec 28, 2019 | | Dec 29, 2018 | | Dec 30, 2017 | | Dec 31, 2016 |
| Net revenue | | $ | 77,867 | | | $ | 71,965 | | | $ | 70,848 | | | $ | 62,761 | | | $ | 59,387 | |
Gross margin1 | | $ | 43,612 | | | $ | 42,140 | | | $ | 43,737 | | | $ | 39,098 | | | $ | 36,233 | |
Gross margin percentage1 | | 56.0 | % | | 58.6 | % | | 61.7 | % | | 62.3 | % | | 61.0 | % |
Research and development1 | | $ | 13,556 | | | $ | 13,362 | | | $ | 13,543 | | | $ | 13,035 | | | $ | 12,685 | |
Marketing, general and administrative1 | | $ | 6,180 | | | $ | 6,350 | | | $ | 6,950 | | | $ | 7,629 | | | $ | 8,671 | |
R&D and MG&A as a percentage of revenue1 | | 25.3 | % | | 27.4 | % | | 28.9 | % | | 32.9 | % | | 36.0 | % |
Operating income1 | | $ | 23,678 | | | $ | 22,035 | | | $ | 23,316 | | | $ | 18,050 | | | $ | 13,133 | |
Net income2 | | $ | 20,899 | | | $ | 21,048 | | | $ | 21,053 | | | $ | 9,601 | | | $ | 10,316 | |
Effective tax rate2 | | 16.7 | % | | 12.5 | % | | 9.7 | % | | 52.8 | % | | 20.3 | % |
Earnings per share2
| | | | | | | | | | |
| Basic | | $ | 4.98 | | | $ | 4.77 | | | $ | 4.57 | | | $ | 2.04 | | | $ | 2.18 | |
| Diluted | | $ | 4.94 | | | $ | 4.71 | | | $ | 4.48 | | | $ | 1.99 | | | $ | 2.12 | |
| Weighted average diluted shares of common stock outstanding | | 4,232 | | | 4,473 | | | 4,701 | | | 4,835 | | | 4,875 | |
| Dividends per share of common stock, declared and paid | | $ | 1.32 | | | $ | 1.26 | | | $ | 1.20 | | | $ | 1.0775 | | | $ | 1.04 | |
| Net cash provided by operating activities | | $ | 35,384 | | | $ | 33,145 | | | $ | 29,432 | | | $ | 22,110 | | | $ | 21,808 | |
| Additions to property, plant and equipment | | $ | 14,259 | | | $ | 16,213 | | | $ | 15,181 | | | $ | 11,778 | | | $ | 9,625 | |
| Repurchase of common stock | | $ | 14,229 | | | $ | 13,576 | | | $ | 10,730 | | | $ | 3,615 | | | $ | 2,587 | |
| Payment of dividends to stockholders | | $ | 5,568 | | | $ | 5,576 | | | $ | 5,541 | | | $ | 5,072 | | | $ | 4,925 | |
| | | | | | | | | | |
| (In Millions) | | Dec 26, 2020 | | Dec 28, 2019 | | Dec 29, 2018 | | Dec 30, 2017 | | Dec 31, 2016 |
| Property, plant and equipment, net | | $ | 56,584 | | | $ | 55,386 | | | $ | 48,976 | | | $ | 41,109 | | | $ | 36,171 | |
| Total assets | | $ | 153,091 | | | $ | 136,524 | | | $ | 127,963 | | | $ | 123,249 | | | $ | 113,327 | |
| Debt | | $ | 36,401 | | | $ | 29,001 | | | $ | 26,359 | | | $ | 26,813 | | | $ | 25,283 | |
| Stockholders' equity | | $ | 81,038 | | | $ | 77,504 | | | $ | 74,563 | | | $ | 69,019 | | | $ | 66,226 | |
| Employees (in thousands) | | 110.6 | | | 110.8 | | | 107.4 | | | 102.7 | | | 106.0 | |
1 In Q1 2018, we adopted "Retirement Benefits—Improving the Presentation of Net Periodic Pension Cost and Net Periodic Postretirement Benefit Cost" on a retrospective basis. As a result of the adoption of this standard, cost of sales, operating expenses, and interest and other, net for periods 2017 and 2016 in the preceding table have been restated.
2 In Q4 2017, we recognized a $5.4 billion higher income tax expense as a result of one-time impacts from Tax Reform. In 2018, our effective tax rate benefited from the reduction of the U.S. statutory federal tax rate.
Sales and Marketing
Customers
We sell our products primarily to OEMs, ODMs, and cloud service providers. ODMs provide design and manufacturing services to branded and unbranded private-label resellers. In addition, our customers include other manufacturers and service providers, such as industrial and communication equipment manufacturers and other cloud service providers, who buy our products through distributor, reseller, retail, and OEM channels throughout the world. For more information about our customers, including customers who accounted for greater than 10% of our net consolidated revenue, see "Note 3: Operating Segments" within the Consolidated Financial Statements.
Our worldwide reseller sales channel consists of thousands of indirect customers—systems builders that purchase Intel® processors and other products from our distributors. We have incentive programs that allow distributors to sell our microprocessors and other products in small quantities to systems integrators. Our microprocessors and other products are also available in direct retail outlets.
Sales Arrangements
Our products are sold through distribution channels throughout the world. Sales of our products are frequently made via purchase order acknowledgments that contain standard terms and conditions covering matters such as pricing, payment terms, and warranties, as well as indemnities for issues specific to our products, such as patent and copyright indemnities. Because our customers generally order from us on a purchase order basis, they can typically cancel, change, or delay product purchase commitments with little or no notice to us and without penalty. From time to time, we may enter into additional agreements with customers covering, for example, changes from our standard terms and conditions, new product development and marketing, and private-label branding. Our sales are routinely made using electronic and web-based processes that allow the customer to review inventory availability and track the progress of specific goods ordered. Pricing on particular products may vary based on volumes ordered and other factors. We also offer discounts, rebates, and other incentives to customers to increase acceptance of our products and technology.
In accordance with contract terms, revenue for product sales is recognized at the time of product shipment from our facilities or delivery to the customer location, as determined by the agreed-upon shipping terms. Our standard terms and conditions of sale typically provide that payment is due at a later date, 30 days after shipment or delivery. We assess credit risk through quantitative and qualitative analysis. From this analysis, we establish shipping and credit limits, and determine whether we will seek to use one or more credit support protection devices, such as obtaining a parent guarantee, standby letter of credit, or credit insurance. Credit losses may still be incurred due to bankruptcy, fraud, or other failure of the customer to pay.
Our sales to distributors are typically made under agreements allowing for price protection on unsold merchandise and a right of return on stipulated quantities of unsold merchandise. Under the price protection program, we give distributors credits for the difference between the original price paid and the current price that we offer. Our products typically have no contractual limit on the amount of price protection, nor is there a limit on the time horizon under which price protection is granted. The right of return granted generally consists of a stock rotation program in which distributors are able to exchange certain products based on the number of qualified purchases made by the distributor.
Distribution
Distributors typically handle a wide variety of products, including those that compete with our products, and fill orders for many customers. Customers may place orders directly with us or through distributors. We have several distribution warehouses that are located in proximity to key customers.
Seasonal Trends
Historically, our net revenue has typically been higher in the second half of the year than in the first half of the year, accelerating in the third quarter and peaking in the fourth quarter. Due to COVID-19 related impacts on demand in 2020, net revenue was higher in the first half of the year due to strong notebook platform demand driven by the increase in working and learning from home, and strength in data center demand as cloud service providers increased capacity.
Marketing
Our global marketing objectives are to build a strong, well-known, differentiated, and meaningful Intel corporate brand that drives preference with businesses and consumers, and to offer a limited number of meaningful and valuable brands in our portfolio to aid businesses and consumers in making informed choices about technology purchases. The Intel Core processor family and the Intel Atom, Celeron, Pentium, and Intel Xeon trademarks make up our key CPU brands. This year, we added a new GPU brand, Intel Iris. We also introduced the Intel Evo platform brand for designs based on 11th Gen Intel Core processors.
In 2020, we launched our new brand that signals our business transformation. We promote brand awareness and preference, and generate demand through our own direct marketing, as well as through co-marketing programs. Our direct marketing activities primarily include advertising through digital and social media and television, as well as consumer and trade events, industry and consumer communications, and press relations. We market to consumer and business audiences and focus on building awareness and generating demand for our products. Our key messaging focuses on increased performance, improved energy efficiency, and other capabilities such as connectivity.
Certain customers participate in cooperative advertising and marketing programs. These cooperative advertising and marketing programs broaden the reach of our brands beyond the scope of our own direct marketing. Certain customers are licensed to place Intel® logos on computing devices containing our microprocessors and processor technologies, and to use our brands in their marketing activities. The program partially reimburses customers for marketing activities for products featuring Intel® brands, subject to customers meeting defined criteria. These marketing activities primarily include advertising through digital and social media and television, as well as press relations. We have also entered into joint marketing arrangements with certain customers.
Intellectual Property Rights and Licensing
Intel owns and develops significant IP and related IP rights around the world that relate to our products, services, R&D, and other activities and assets. Our IP portfolio includes patents, copyrights, trade secrets, trademarks, trade dress rights, and mask work rights. We actively seek to protect our global IP rights and to deter unauthorized use of our IP and other assets. Such efforts can be difficult, however, particularly in countries that provide less protection to IP rights and in the absence of harmonized international IP standards. For a discussion of the risks related to IP and our IP rights, see "We are subject to IP risks and risks associated with litigation and regulatory proceedings" in "Risk Factors" within this section. While our IP rights are important to our success, our business as a whole is not significantly dependent on any single patent, copyright, or other IP right.
We have obtained patents in the U.S. and other countries. Because of the fast pace of innovation and product development, and the comparative pace of governments' patenting processes, our products are often obsolete before the patents related to them expire; in some cases, our products may be obsolete before the patents related to them are granted. As we expand our product offerings into new industries, we also seek to extend our patent development efforts to patent such products. In addition to developing patents based on our own R&D efforts, we may purchase or license patents from third parties. Established competitors in existing and new industries, as well as companies that purchase and enforce patents and other IP, may already have patents covering similar products. There is no assurance that we will be able to obtain patents covering our own products, or that we will be able to obtain licenses from other companies on favorable terms or at all.
The software that we distribute, including software embedded in our component-level and platform products, is entitled to copyright and other IP protection. To distinguish our products from our competitors' products, we have obtained trademarks and trade names for our products, and we maintain cooperative advertising programs with customers to promote our brands and to identify products containing genuine Intel components. We also protect details about our processes, products, and strategies as trade secrets, keeping confidential the information that we believe provides us with a competitive advantage.
Critical Accounting Estimates
The methods, assumptions, and estimates that we use in applying our accounting policies may require us to apply judgments regarding matters that are inherently uncertain. We consider an accounting policy to be a critical estimate if: (1) we must make assumptions that were uncertain when the judgment was made, and (2) changes in the estimate assumptions, or selection of a different estimate methodology, could have a significant impact on our financial position and the results that we report in our Consolidated Financial Statements. While we believe that our estimates, assumptions, and judgments are reasonable, they are based on information available when the estimate was made.
Refer to "Note 2: Accounting Policies" within the Consolidated Financial Statements for further information on our critical accounting estimates and policies, which are as follows:
▪Inventories—the transition of manufacturing costs to inventory, excluding factory excess capacity costs. Inventory reflected at the lower of cost or net realizable value considering future demand and market conditions;
▪Long-lived assets—the valuation methods and assumptions used in assessing the impairment of property, plant and equipment, identified intangibles, and goodwill, including the determination of asset groupings and the identification and allocation of goodwill to reporting units;
▪Non-marketable equity investments—the valuation estimates and assessment of impairment and observable price adjustments; and
▪Loss contingencies—the estimation of when a loss is probable and reasonably estimable.
Risk Factors
The following risks could materially and adversely affect our business, financial condition, cash flows, and results of operations, and the trading price of our common stock could decline. These risk factors do not identify all risks that we face; our operations could also be affected by factors that are not presently known to us or that we currently consider to be immaterial to our operations. Due to risks and uncertainties, known and unknown, our past financial results may not be a reliable indicator of future performance, and historical trends should not be used to anticipate results or trends in future periods. Refer also to the other information set forth in this Form 10-K, including in the MD&A and Financial Statements and Supplemental Details sections.
Changes in product demand can adversely affect our financial results.
Demand for our products is variable and hard to predict. Our products are used in different market segments, and demand for our products varies within or among the market segments served by our PC-centric and data-centric businesses. It is difficult to forecast these changes and their impact. For example, we saw negative COVID-driven demand impacts in several areas of our business during the second half of 2020, as discussed in MD&A, and the nature and extent of future impacts are difficult to predict. Changes in the demand for our products, particularly our CCG and DCG platform products, can reduce our revenue, lower our gross margin, or require us to write down the value of our assets.
Important factors that lead to variation in the demand for our products include:
▪business conditions, including downturns in the market segments in which we operate, or in global or regional economies;
▪consumer confidence or income levels, and the levels of customer capital spending, which may be impacted by changes in market conditions, including changes in government borrowing, taxation, or spending policies; the credit market; expected inflation; employment; and energy or other commodity prices;
▪our ability to timely introduce competitive products;
▪competitive and pricing pressures, including new product introductions and other actions taken by competitors;
▪the level of our customers' inventories and computing capacity;
▪customer order patterns, including order cancellations, which can be affected by maturing product cycles for our products, customers' products, and related products such as operating system upgrade cycles; disruptions affecting customers; and other factors;
▪market acceptance and industry support of our new and maturing products, including the introduction and availability of products used together with our products; and
▪customer product needs and emerging technology trends, including changes in the levels and nature of customer and end-user computing workloads.
Due to the complexity of our manufacturing operations, we are not always able to timely respond to fluctuations in demand and we may incur significant charges and costs. Because we own and operate high-tech fabrication facilities, our operations have high costs that are fixed or difficult to reduce in the short term, including our costs related to utilization of existing facilities, facility construction and equipment, R&D, and the employment and training of a highly skilled workforce. To the extent product demand decreases or we fail to forecast demand accurately, we could be required to write off inventory or record excess capacity charges, which would lower our gross margin. To the extent the demand decrease is prolonged, our manufacturing or assembly and test capacity could be underutilized, and we may be required to write down our long-lived assets, which would increase our expenses. We may also be required to shorten the useful lives of under-used facilities and equipment and accelerate depreciation. Conversely, at times product demand increases or we fail to forecast accurately or produce the mix of products demanded, and we are unable to add capacity or increase production fast enough, or otherwise fail to meet market demand, which can result in a loss of revenue opportunities or market share, legal claims, and/or damage to customer relationships.
We face significant competition. The industry in which we operate is highly competitive and subject to rapid technological and market developments; changes in industry standards; changes in customer and end-user needs, expectations, and preferences; and frequent product introductions and improvements. When we do not anticipate and/or respond to these developments, our competitive position can weaken, and our products or technologies can become uncompetitive or obsolete. Our competitive environment has intensified, and we expect it to continue to do so in the future.
Our products primarily compete based on performance, energy efficiency, integration, ease-of-use, innovative design, features, workload optimization, price, quality, reliability, security, software ecosystem and developer support, time-to-market, reliable product roadmap execution, brand recognition, customer support and customization, and availability. The importance of these factors varies by product and market segment. For example, our competitors have introduced data center and client platform products with performance improvements and additional processor core counts that have contributed to an increasingly competitive environment. In our IOTG business, for example, interoperability, connectivity, safety, security, industrial use conditions, and long-life support are among the key competitive factors. To the extent our products do not meet our customers' requirements across these factors in an increasingly competitive landscape, our business and results of operation can be harmed.
We face intense competition across our product portfolio from companies offering platform products, such as AMD and Qualcomm; accelerator products such as GPUs, including those offered by NVIDIA; other accelerator products such as ASICs, application-specific standard products, and FPGAs; memory and storage products; connectivity and networking products; and other semiconductor products. Some of these competitors have developed or utilize competing computing architectures and platforms, such as the ARM architecture, and these architectures and platforms can produce beneficial network effects for competitors when an ecosystem of customers and application developers for such architectures and platforms grows at scale. For example, ARM-based products are being used in PCs and servers, which could lead to further development and growth of the ARM ecosystem. We also compete with internally developed semiconductors from OEMs, cloud service providers, and others, some of whom are customers. Some of these customers vertically integrate their own semiconductor designs with their software assets and/or customize their designs for specific computing workloads. For example, in 2020, Apple introduced PC products utilizing its own internally developed ARM-based semiconductor designs in place of our client CPUs.
Most of our competitors rely on third-party foundries, such as Taiwan Semiconductor Manufacturing Company, Ltd. (TSMC) or Samsung Electronics Co., Ltd., and subcontractors for manufacture and assembly and test of their semiconductor components and products. Manufacturing process improvements introduced by TSMC have contributed, and may continue to contribute, to increasingly competitive offerings by our competitors. As an IDM, we have higher capital expenditures and R&D spending than many of our "fabless" competitors. We also face new sources of competition as a result of changes in industry participants through, for example, acquisitions or business collaborations, as well as new entrants, including in China, which could have a significant impact on our competitive position. For example, we could face increased competition as a result of China's programs to promote a domestic semiconductor industry and supply chains.
Introduction of competitive new products and technologies, aggressive pricing, and other actions taken by competitors can harm demand for our products, exert downward pricing pressure on our products, and adversely affect our business. For example, our DCG platform ASPs were impacted by the competitive pricing environment during 2020. Additionally, a number of business combinations and strategic partnerships in the semiconductor industry have occurred over the last several years, and more could occur in the future. For example, in 2020, NVIDIA announced an agreement to acquire ARM Holdings plc, and AMD announced an agreement to acquire Xilinx, Inc. Consolidation could also lead to fewer customers, partners, or suppliers, any of which could negatively affect our financial results.
If we are not able to compete effectively, our financial results will be adversely affected, including reduced revenue and gross margin, and we may be required to accelerate the write-down of the value of certain assets.
We invest significantly in R&D, and to the extent our R&D efforts are unsuccessful, our competitive position can be harmed and we may not realize a return on our investments. To compete successfully, we must maintain a successful R&D effort, develop new products and manufacturing processes, and improve our existing products and processes, all ahead of competitors. We are focusing our R&D efforts across several key areas: process and packaging technology, architecture, memory, interconnect, security, and software. These include ambitious initiatives, such as our unified oneAPI portfolio of developer tools. We cannot guarantee that all of these efforts will deliver the benefits we anticipate. For example, we previously experienced significant delays in the implementation of our 10nm process technology, and during 2020, we announced that our 7nm process technology would be delayed relative to our prior expectations, as discussed in the risk factor “We are subject to risks associated with the development and implementation of new manufacturing process technology.” To the extent we do not timely introduce new manufacturing process technologies that improve transistor density with sufficient manufacturing yields and operational efficiency, relative to competing foundry processes, we can face cost, product performance, and time-to-market disadvantages. In addition, we are not always able to timely or successfully develop new product designs. To the extent our R&D efforts do not timely produce semiconductor designs for our platform products with improvements in areas like performance, performance per watt, die utilization, and core counts, and with new features such as optimizations for AI and other workloads, our competitive position can be harmed. We have adopted a disaggregated design approach for some of our future products, in which different processors and components can be manufactured on different processes and connected by advanced packaging technology into a single package. This approach introduces new areas of complexity in design and manufacturability, particularly in the deployment of advanced packaging technologies, several of which are novel, have a limited manufacturing history, and/or have increased costs. Delays or failures in implementing disaggregated designs could adversely affect our ability to timely introduce competitive products. For example, adapting a processor or component design for a new or different manufacturing process involves additional R&D expense and can result in delays in the development of the associated product.
We do not expect all of our R&D investments to be successful. Some of our efforts to develop and market new products fail, and the products and technologies we invest in and develop are not always well received by customers, who may adopt competing technologies. We make significant investments in R&D, and our investments at times do not contribute to our future operating results for several years, if at all, and such contributions at times do not meet our expectations or even cover the costs of such investments.
Our investments in new businesses, products, and technologies are inherently risky and do not always succeed. In recent years, we have entered new areas and introduced new products as we seek to lead in key technology inflections such as AI, 5G networking, and the intelligent and autonomous edge. We have expanded our adjacent product offerings in client computing, the data center, the Internet of Things, and memory, with offerings such as discrete GPUs, silicon photonics solutions, and Intel Optane technology products. These efforts are not always successful. For example, in 2019, we exited the 5G smartphone modem business based on our determination that there was no clear path to profitability for the business.
These new and developing areas and products represent a significant portion of our expanded TAM, and they also introduce new sources of competition, including, in some of these market segments, incumbent competitors with established technologies, ecosystems, and customer bases, lower prices or costs, and greater brand recognition. These developing products and market segments require significant investment, do not always grow as projected or at all, or sometimes utilize technologies that are different from the ones that we develop and manufacture, and we may not realize an adequate return on our investments. For example, AI and machine learning are increasingly driving innovations in technology, but if we fail to develop leading products for these workloads, or if our customers use competing technologies, we may not realize a return on our investments in these areas. Similarly, while we see significant opportunity in networking infrastructure and the distribution of computing to the network edge, we expect intense competition for this opportunity and may not succeed in our efforts. To be successful, we need to cultivate new industry relationships with customers and partners in these market segments. In addition, we must continually improve the cost, performance, integration, time-to-market, and energy efficiency of our products, as well as expand our software capabilities to provide customers with comprehensive computing solutions. Some of these new businesses face challenging market conditions. For example, market pricing for NAND memory products has been, and may continue to be, highly volatile. Despite our ongoing efforts, there is no guarantee that we will achieve or maintain market demand or acceptance for our products and services in these various market segments or realize an adequate return on our investments, which could lead to impairment of assets and restructuring charges, as well as opportunity costs.
Changes in the mix of products sold can materially impact our financial results. Our pricing and margins vary across our products and market segments due in part to marketability of our products and differences in their features or manufacturing costs. For example, our platform product offerings range from lower-priced and entry-level platforms, such as those based on Intel Atom processors, to higher-end platforms based on Intel Xeon processors. Our adjacent products also typically have significantly lower margins than our higher-priced platform products, and at times are not profitable. To the extent demand shifts from our higher-priced to lower-priced platform products in any of our market segments, or our adjacent products represent an increasingly greater share of our mix of products sold, our gross margin percentage may decrease.
We are vulnerable to product and manufacturing-related risks.
We are subject to risks associated with the development and implementation of new manufacturing technologies. Production of integrated circuits is a complex process. We are continually engaged in the development of next-generation process technologies at increasingly advanced nodes as we seek to realize the benefits of Moore's Law. Forecasting our progress and schedule for developing advanced nodes is challenging, and at times we encounter unexpected delays due to the complexity of interactions among steps in the manufacturing process, challenges in using new materials, and other issues. Diagnosing defects in our manufacturing processes often takes a long time, as manufacturing throughput times can delay our receipt of data about defects and the effectiveness of fixes.
We are not always successful or efficient in developing or implementing new process nodes and manufacturing processes. We experienced significant delays in implementing our 10nm process technology. Although we began shipping products based on our 10nm process technology in volume in 2019, our delays in transitioning to this node occurred while third-party foundries such as TSMC developed new, competitive process technologies. Competitors using third-party foundries are able to benefit from the improvements such process technologies have made in performance, energy efficiency, and other features, which has helped increase the competitiveness of their products. In 2020, we encountered a defect mode in the development of our 7nm process technology that resulted in yield degradation, which was the primary driver for a delay in our expectations for our 7nm-based CPU product timing. These delays can allow competitors to benefit from advancements in manufacturing processes introduced ahead of us by third-party foundries and could adversely affect the competitiveness of our products. Because of the delays in our 10nm and 7nm process technologies, we may experience greater adverse competitive impacts in the event of delays in the development of future manufacturing process technologies and products. To increase our manufacturing and design flexibility, we have developed a disaggregated design approach for certain products, which enables us to manufacture processors and components on different process technologies, including third-party foundry processes, and connect them in a single package with advanced packaging technologies. This approach introduces additional risks as described in the risk factor “We face supply chain risks.”
Our efforts to innovate involve significant expense and carry inherent risks, including difficulties in designing and developing next-generation process technologies, and investments in manufacturing assets and facilities that are made years in advance of the process node introduction. We cannot guarantee that we will realize the expected benefits of next-generation process technologies, including the expected cost and density advantages, or that we will achieve an adequate return on our capital and R&D investments, particularly as development of new nodes has grown increasingly expensive. In such circumstances, we may be required to write down the value of some of our manufacturing assets and facilities, increasing our expenses.
Risks inherent in the development of next-generation process technologies include production timing delays, lower-than-anticipated manufacturing yields, longer manufacturing throughput times, and product defects and errata. Production timing delays have at times caused us to miss customer product design windows, which can result in lost revenue opportunities and damage to our customer relationships. Furthermore, when the introduction of next-generation process nodes is delayed, including additional cores or other competitive features in our products can result in larger die size products, manufacturing supply constraints, and increased product costs. Lower manufacturing yields and longer manufacturing throughput times, compared to previous process nodes, can increase our product costs and adversely affect our gross margins, and can contribute to manufacturing supply constraints. When we introduce a new process node, it typically has higher costs compared to a mature node due to factors that include higher depreciation costs and lower yields. For example, our increased 10nm product mix in 2020 had a negative impact on our overall unit cost and gross margins, and yields on our 10nm manufacturing process remain below our mature 14nm process. In addition, the improvements we expect to make in 10nm costs and yields may not proceed at the same rate as the improvements we made on 14nm. As the die size of our products has increased and our manufacturing process nodes have shrunk, our products and manufacturing processes have grown increasingly complex and more susceptible to product defects and errata, which at times also contribute to production timing delays and lower yields.
From time to time, disruptions in the production process result from errors, defects in materials, delays in obtaining or revising operating permits and licenses, interruptions in our supply of materials or resources, and disruptions at our fabrication and assembly and test facilities due to accidents, maintenance issues, power interruptions, equipment malfunctions, or unsafe working conditions—all of which could affect the timing of production ramps and yields.
Production issues periodically lead to increased costs and affect our ability to meet product demand, which can adversely impact our business and the results of operations. In addition, delays in our product introductions can cause us to become less competitive and lose revenue opportunities, and our gross margin could be adversely affected because we incur significant costs up front in the product development stage and earn revenue to offset these costs over time.
We face supply chain risks. Thousands of suppliers provide materials and equipment that we use in production and other aspects of our business. Where possible, we seek to have several sources of supply. However, for certain materials and equipment, including certain photolithography tools, we rely on a single or a limited number of suppliers, or upon suppliers in a single location. In addition, supplier consolidation or business failures can impact the nature, quality, availability, and pricing of the products and services available to us. Finding and qualifying alternate or additional suppliers is often a lengthy process and can lead to production delays or additional costs, and such alternatives are sometimes not available at all. The inability of suppliers to deliver necessary production materials or equipment can disrupt our production processes and make it more difficult for us to implement our business strategy. Suppliers periodically extend lead times, face capacity constraints, limit supplies, increase prices, experience quality issues, or encounter cybersecurity or other issues that can interrupt or increase the cost of our supply. Our production can be disrupted by the unavailability of resources, such as water, silicon, electricity, gases, and other materials. The unavailability or reduced availability of materials or resources at times requires us to reduce production or incur additional costs, which could harm our business and results of operations. Our manufacturing operations and ability to meet product demand may also be impacted by IP or other litigation between our suppliers, where an injunction against Intel or a supplier could interrupt the availability of goods or services supplied to Intel by others.
We also rely on third-party providers to manufacture, assemble and test, and supply certain components and products, including for areas such as networking, communications, programmable semiconductor solutions, and memory. We may utilize third-party providers for these and other components and products in the future. From time to time, these third parties are unable to perform these services on a timely or cost-effective basis, in sufficient volumes, or at all. In some cases there are limited or no readily available satisfactory alternate providers. In any of these circumstances, we can encounter supply delays or disruptions or incur additional costs that could prevent us from meeting customer demand and/or adversely affect our business and financial results. For example, while we have a supply agreement with Micron providing for the supply of Intel 3D XPoint memory, we may need to fund and develop internal manufacturing options to continue 3D XPoint memory supply in the longer term. We typically have less control over delivery schedules, design and manufacturing co-optimization, manufacturing yields, quality, product quantities, and costs for components and products that are manufactured or supplied by third parties.
Our disaggregated design strategy poses increased logistical risks and challenges, particularly where we decide to manufacture different components on different process technologies, including third-party foundries' process technologies. To combine components in a single package, they need to be manufactured on a timely basis and in sufficient quantities, while the manufacturing processes we utilize may have differing yields, throughput times, and capacity constraints. We may be required to safely store some components pending the manufacture of others. Delays or quality issues with one component could limit our ability to manufacture the entire completed product. In addition, the packaging technologies used to combine these components can increase our costs and may introduce additional complexity and quality issues. To the extent we are unable to manage these risks, our ability to timely supply competitive products can be harmed, our costs could increase, and our business and results of operation could be adversely affected.
Increased regulation or stakeholder expectations regarding responsible sourcing practices could cause our compliance costs to increase or result in publicity that negatively affects our reputation. Moreover, given that we use many materials in the manufacturing of our products and rely on many suppliers to provide these materials, but do not directly control the procurement or employment practices of such suppliers, we could be subject to similar financial or reputational risks as a result of our suppliers' conduct.
We are subject to the risks of product defects, errata, or other product issues. From time to time, we identify product defects, errata (deviations from published specifications), and other product issues, which can result from problems in our product design or our manufacturing and assembly and test processes. Components and products we purchase or license from third-party suppliers, or attain through acquisitions, can also contain defects. Product issues can lead to product failures, unpredictable system behavior, system instability, and other issues, and sometimes result from the interaction between our products and third-party products and software. We also face risks if products that we design, manufacture, or sell, or that include our technology, cause personal injury or property damage, even where the cause is unrelated to product defects or errata. These risks may increase as our products are introduced into new devices, market segments, technologies, or applications, including transportation, autonomous driving, healthcare, communications, financial services, and other industrial, critical infrastructure, and consumer uses.
Costs from defects, errata, or other product issues could include:
▪writing off some or all of the value of inventory;
▪recalling products that have been shipped;
▪providing product replacements or modifications;
▪providing consideration to customers, including reimbursement for certain costs they incur;
▪defending against litigation and/or paying resulting damages; and
▪paying fines imposed by regulatory agencies.
These costs could be large and may increase expenses and lower gross margin, and/or result in delay or loss of revenue. Mitigation techniques designed to address product issues, including software and firmware updates, are not always available on a timely basis—or at all—and do not always operate as intended or effectively resolve such issues for all applications, and can result in adverse performance or power effects. We and third parties, such as hardware and software vendors, may make prioritization decisions about which product issues to address, which can delay, limit, or prevent development or deployment of a mitigation and harm our reputation and result in costs. Product defects, errata, or other issues can damage our reputation, negatively affect product demand, delay product releases, result in legal liability, or make our products less competitive, which could harm our business and financial results. In addition, our liability insurance coverage has certain exclusions or may not adequately cover liabilities incurred. Our insurance providers may be unable or unwilling to pay a claim, and losses not covered by insurance could be large, which could harm our financial condition.
We face risks related to security vulnerabilities in our products. We or third parties regularly identify security vulnerabilities with respect to our processors and other products, as well as the operating systems and workloads that run on them and the components that interact with them. Components and IP we purchase or license from third parties for use in our products, as well as industry-standard specifications we implement in our products, are also regularly subject to security vulnerabilities. As we have become a more data-centric company, our processors and other products are being used in additional and new critical application areas that create new or increased cybersecurity and privacy risks, including applications that gather and process large amounts of data, such as the cloud or Internet of Things, and critical infrastructure and automotive applications. The security vulnerabilities identified in our processors include a category known as side-channel vulnerabilities, such as the variants referred to as "Spectre" and "Meltdown." Additional categories and variants have been identified and are expected to continue to be identified. Publicity about these and other security vulnerabilities has resulted in, and is expected to continue to result in, increased attempts by third parties to identify additional vulnerabilities, including with respect to security and manageability features in our products. Vulnerabilities are not always mitigated before they become known. We, our customers, and the users of our products do not always promptly learn of or have the ability to fully assess the magnitude or effects of a vulnerability, including the extent, if any, to which a vulnerability has been exploited. Subsequent events or new information can develop that changes our assessment of the impact of a security vulnerability, including additional information learned as we develop and deploy mitigations or updates, become aware of additional variants, evaluate the competitiveness of existing and new products, and address future warranty or other claims or customer satisfaction considerations, as well as developments in the course of any litigation or regulatory inquiries or actions over these matters.
Mitigation techniques designed to address security vulnerabilities, including software and firmware updates or other preventative measures, are not always available on a timely basis—or at all—and at times do not operate as intended or effectively resolve vulnerabilities for all applications. In addition, we are often required to rely on third parties, including hardware, software, and services vendors, as well as our customers and end users, to develop and/or deploy mitigation techniques, and the availability, effectiveness, and performance impact of mitigation techniques can depend solely or in part on the actions of these third parties in determining whether and how to develop and deploy mitigations. We and such third parties may make prioritization decisions about which vulnerabilities to address, which can delay, limit, or prevent development or deployment of a mitigation and harm our reputation. Security vulnerabilities and/or mitigation techniques can result in adverse performance or power effects, reboots, system instability or unavailability, loss of functionality, data loss or corruption, unpredictable system behavior, decisions by customers and end users to limit or change the applications in which they use our products or product features, and/or the misappropriation of data by third parties.
Security vulnerabilities and any limitations of, or adverse effects resulting from, mitigation techniques can adversely affect our results of operations, financial condition, customer relationships, prospects, and reputation in a number of ways, any of which may be material. For example, whether or not vulnerabilities involve attempted or successful exploits, they may result in our incurring significant costs related to developing and deploying updates and mitigations, writing down inventory value, defending against product claims and litigation, responding to regulatory inquiries or actions, paying damages, addressing customer satisfaction considerations, providing product replacements or modifications, or taking other remedial steps with respect to third parties. Adverse publicity about security vulnerabilities or mitigations could damage our reputation with customers or users and reduce demand for our products and services. These effects may be greater to the extent that competing products are not susceptible to the same vulnerabilities or if vulnerabilities can be more effectively mitigated in competing products. Moreover, third parties can release information regarding potential vulnerabilities of our products before mitigations are available, which, in turn, could lead to attempted or successful exploits, adversely affect our ability to introduce mitigations, or otherwise harm our business and reputation.
We are subject to risks associated with environmental, health, and safety regulations. The manufacturing and assembly and test of our products require the use of hazardous materials that are subject to a broad array of environmental, health, and safety laws and regulations. Our failure to comply with these laws or regulations can result in regulatory penalties, fines, and legal liabilities; suspension of production; alteration of our manufacturing and assembly and test processes; damage to our reputation; and restrictions on our operations or sales.
Our failure to manage the use, transportation, emissions, discharge, storage, recycling, or disposal of hazardous materials can lead to increased costs or future liabilities. Our ability to expand or modify our manufacturing capability in the future may be impeded by environmental regulations, such as air quality and wastewater requirements. Environmental laws and regulations sometimes require us to acquire additional pollution abatement or remediation equipment, modify product designs, or incur other expenses. Regulations in response to climate change could result in increased manufacturing costs associated with air pollution requirements and increased compliance and energy costs. Many new materials that we are evaluating for use in our operations are subject to regulation under environmental laws and regulations. These restrictions could harm our business and results of operations by increasing our expenses or requiring us to alter manufacturing and assembly and test processes.
The COVID-19 pandemic could materially adversely affect our financial condition and results of operations.
The COVID-19 pandemic has adversely affected significant portions of our business and could have a material adverse effect on our financial condition and results of operations. We are subject to numerous pandemic-related risks, including those described below. The degree to which COVID-19 impacts our results will depend on future developments, which are highly uncertain and cannot be predicted, including, but not limited to, the duration and severity of the pandemic, the actions taken to contain the virus or treat its impact, other actions taken by governments, businesses, and individuals in response to the virus and resulting economic disruption, and how quickly and to what extent normal economic and operating conditions can resume. We are similarly unable to predict the extent of the impact of the pandemic on our customers, suppliers, vendors, and other partners, and their financial conditions, but a material effect on these parties could also materially adversely affect us.
Operational risks. The pandemic has resulted in authorities imposing, and businesses and individuals implementing, numerous measures to try to contain the virus, such as travel bans and restrictions, quarantines, shelter-in-place/stay-at-home and social distancing orders, and shutdowns. These measures have impacted and may further impact our workforce and operations, the operations of our customers, and those of our respective vendors, suppliers, and partners. We have significant manufacturing operations in the U.S., Ireland, Israel, China, Malaysia, and Vietnam, and each of these countries has been affected by the pandemic and is taking measures to try to contain it.
There is considerable uncertainty regarding the business impacts from such measures and potential future measures. Shelter-in-place orders and other measures, including work-from-home and social distancing policies implemented to protect employees, have resulted in reduced workforce availability at some of our sites, construction delays, and reduced capacity at some of our vendors and suppliers. Restrictions on our manufacturing or support operations or workforce, or similar limitations for our vendors and suppliers, can impact our ability to meet customer demand and could have a material adverse effect on our financial condition and results of operations, particularly if prolonged. Similarly, current and future restrictions or disruptions of transportation can also impact our ability to meet demand and could materially adversely affect us. Our customers have experienced, and may in the future experience, disruptions in their operations and supply chains, which can result in delayed, reduced, or cancelled orders, or collection risks, and which may adversely affect our results of operations. We previously paused new construction projects at several of our manufacturing sites due to local government restrictions. While these restrictions were subsequently lifted, similar restrictions affecting construction could be imposed again in the future.
The pandemic has caused us to modify our business practices, including with respect to employee travel; employee work locations; cancellation of physical participation in meetings, events, and conferences; and social distancing measures. We may take further actions as required by government authorities or others, or that we determine are in the best interests of our employees, customers, suppliers, vendors, and partners. Work-from-home and other measures introduce additional operational risks, including cybersecurity risks, and have affected the way we conduct our product development, validation, and qualification, customer support, and other activities, which could have a material adverse effect on our operations. There is no certainty that such measures will be sufficient to mitigate the risks posed by the virus, and illness and workforce disruptions could lead to unavailability of key personnel and harm our ability to perform critical functions.
Demand and macroeconomic risks. The pandemic has significantly increased economic and demand uncertainty. It has caused a significant contraction in the global economy, and there is considerable uncertainty as to the severity and duration of the contraction. Risks related to adverse changes in global economic conditions are described in our risk factor titled “Global or regional conditions can harm our financial results,” and include the risk that demand for our products will be significantly harmed. During the second half of 2020 in particular, we saw negative COVID-related demand trends in several areas of our data-centric businesses, as well as COVID-related changes in product mix that drove lower ASPs in our PC-centric business, as discussed in MD&A. Given the continued and substantial economic uncertainty and volatility created by the pandemic, it is difficult to predict the nature and extent of impacts on demand for our products. For example, the increased demand for notebook products as a result of work- and learn-from-home dynamics may not continue as the pandemic progresses, or demand mix shifts that have been pronounced during the pandemic and have negatively impacted our ASPs could continue, such as the mix shift from desktop to notebook products in our CCG business and the mix shift from the enterprise and government market segment to the cloud service provider market segment in DCG.
Liquidity risks. The pandemic has led to increased disruption and volatility in capital markets and credit markets. Unanticipated consequences of the pandemic and resulting economic uncertainty could adversely affect our liquidity and capital resources in the future.
Other risks. The impact of COVID-19 can also exacerbate other risks discussed in this Risk Factors section and throughout this report, which could in turn have a material adverse effect on us. Developments related to COVID-19 have been unpredictable, and additional impacts and risks may arise that we are not aware of or able to respond to appropriately.
We operate globally and are subject to significant risks in many jurisdictions.
Global or regional conditions can harm our financial results. We have manufacturing, assembly and test, R&D, sales, and other operations in many countries, and some of our business activities are concentrated in one or more geographic areas. Moreover, sales outside the U.S. accounted for 79% of our revenue for the fiscal year ended December 26, 2020, with revenue from billings to China, including Hong Kong, contributing 26% of our total revenue. As a result, our operations and our financial results, including our ability to manufacture, assemble and test, design, develop, or sell products, and the demand for our products, are at times adversely affected by a number of global and regional factors outside of our control.
Adverse changes in global or regional economic conditions periodically occur, including recession or slowing growth, changes or uncertainty in fiscal, monetary, or trade policy, higher interest rates, tighter credit, inflation, lower capital expenditures by businesses including on IT infrastructure, increases in unemployment, and lower consumer confidence and spending. The COVID-19 pandemic has
caused a significant contraction in the global economy, and there is considerable uncertainty as to its severity and duration. Adverse changes in economic conditions, including those related to the pandemic, can significantly harm demand for our products and make it more challenging to forecast our operating results and make business decisions, including regarding prioritization of investments in our business. An economic downturn or increased uncertainty may also lead to increased credit and collectability risks, higher borrowing costs or reduced availability of capital markets, reduced liquidity, adverse impacts on our suppliers, failures of counterparties including financial institutions and insurers, asset impairments, and declines in the value of our financial instruments.
We can be adversely affected by other global and regional factors that periodically occur, including:
▪geopolitical and security issues, such as armed conflict and civil or military unrest, political instability, human rights concerns, and terrorist activity, including, for example, geopolitical tensions and conflict affecting Israel, where our Mobileye business headquarters and certain of our fabrication facilities are located;
▪natural disasters, public health issues (including the COVID-19 pandemic), and other catastrophic events;
▪inefficient infrastructure and other disruptions, such as supply chain interruptions and large-scale outages or unreliable provision of services from utilities, transportation, data hosting, or telecommunications providers;
▪formal or informal imposition of new or revised export, import, or doing-business regulations, including trade sanctions, tariffs, and changes in the ability to obtain export licenses, which could be changed without notice;
▪government restrictions on, or nationalization of, our operations in any country, or restrictions on our ability to repatriate earnings from a particular country;
▪adverse changes relating to government grants, tax credits, or other government incentives, including more favorable incentives provided to competitors;
▪differing employment practices and labor issues;
▪ineffective legal protection of our IP rights in certain countries;
▪local business and cultural factors that differ from our current standards and practices;
▪continuing uncertainty regarding social, political, immigration, and tax and trade policies in the U.S. and abroad, including as a result of the United Kingdom's withdrawal from the European Union; and
▪fluctuations in the market values of our domestic and international investments, which can be negatively affected by liquidity, credit deterioration or losses, interest rate changes, financial results, political risk, sovereign risk, or other factors.
We are also subject to risks related to uncertainty regarding LIBOR. Certain of our interest rate derivatives and investments are based on LIBOR, and a portion of our indebtedness bears interest at variable interest rates, primarily based on LIBOR. LIBOR is the subject of recent national, international, and other regulatory guidance and proposals for reform, which may cause LIBOR to disappear entirely after 2021 or to perform differently than in the past. While we expect that reasonable alternatives to LIBOR will be implemented prior to the 2021 target date or that the 2021 cessation date may be extended, we cannot predict the consequences and timing of these developments, and they could include an increase in our interest expense and/or a reduction in our interest income.
We are subject to risks related to trade policies and regulations. Trade policies and disputes at times result in increased tariffs, trade barriers, and other protectionist measures, which can increase our manufacturing costs, make our products less competitive, reduce demand for our products, limit our ability to sell to certain customers, limit our ability to procure components or raw materials, or impede or slow the movement of our goods across borders. Increasing protectionism and economic nationalism may lead to further changes in trade policies and regulations, domestic sourcing initiatives, or other formal and informal measures that could make it more difficult to sell our products in, or restrict our access to, some markets.
In particular, trade tensions between the U.S. and China have led to increased tariffs and trade restrictions, including tariffs applicable to some of our products, and have affected customer ordering patterns. The U.S. has imposed restrictions on the export of U.S.-regulated products and technology to certain Chinese technology companies, including certain of our customers. These restrictions have reduced our sales, and continuing or future restrictions could adversely affect our financial performance, result in reputational harm to us due to our relationship with such companies, or lead such companies to develop or adopt technologies that compete with our products. It is difficult to predict what further trade-related actions governments may take, which may include trade restrictions and additional or increased tariffs and export controls imposed on short notice, and we may be unable to quickly and effectively react to or mitigate such actions.
Trade disputes and protectionist measures, or continued uncertainty about such matters, could result in declining consumer confidence and slowing economic growth or recession, and could cause our customers to reduce, cancel, or alter the timing of their purchases with us. Sustained geopolitical tensions could lead to long-term changes in global trade and technology supply chains, and decoupling of global trade networks, which could have a material adverse effect on our business and growth prospects.
Laws and regulations can have a negative impact on our business. We are subject to laws and regulations worldwide that differ among jurisdictions, affecting our operations in areas including, but not limited to: IP ownership and infringement; tax; import and export requirements; anti-corruption; foreign exchange controls and cash repatriation restrictions; data privacy requirements; competition; advertising; employment; product regulations; environment, health, and safety requirements; and consumer laws. Compliance with such requirements can be onerous and expensive, and may otherwise impact our business operations negatively. For example, unfavorable developments with evolving laws and regulations worldwide related to 5G or autonomous driving technology may limit global adoption, impede our strategy, or negatively impact our long-term expectations for our investments in these areas. Expanding privacy legislation and compliance costs of privacy-related and data protection measures could adversely affect our customers and their products and services, particularly in cloud, Internet of Things, and AI applications, which could in turn reduce demand for our products used for those workloads.
Although we have policies, controls, and procedures designed to help ensure compliance with applicable laws, there can be no assurance that our employees, contractors, suppliers, or agents will not violate such laws or our policies. Violations of these laws and regulations can result in fines; criminal sanctions against us, our officers, or our employees; prohibitions on the conduct of our business; and damage to our reputation. The technology industry is subject to intense media, political, and regulatory scrutiny, which can increase our exposure to government investigations, legal actions, and penalties.
We are affected by fluctuations in currency exchange rates. We are exposed to adverse as well as beneficial movements in currency exchange rates. Although most of our sales occur in U.S. dollars, expenses may be paid in local currencies. An increase in the value of the dollar can increase the real cost to our customers of our products in those markets outside the U.S. where we sell in dollars, and a weakened dollar can increase the cost of expenses such as payroll, utilities, tax, and marketing expenses, as well as overseas capital expenditures. We also conduct certain investing and financing activities in local currencies. Our hedging programs may not be effective to offset any, or more than a portion, of the adverse impact of currency exchange rate movements; therefore, changes in exchange rates can harm our results of operations and financial condition.
Catastrophic events can have a material adverse effect on our operations and financial results. Our operations and business, and those of our customers and suppliers, can be disrupted by natural disasters; industrial accidents; public health issues (including the COVID-19 pandemic); cybersecurity incidents; interruptions of service from utilities, transportation, telecommunications, or IT systems providers; manufacturing equipment failures; or other catastrophic events. For example, we have at times experienced disruptions in our manufacturing processes as a result of power outages, improperly functioning equipment, and disruptions in supply of raw materials or components, including due to cybersecurity incidents affecting our suppliers. Our headquarters and many of our operations and facilities are in locations that are prone to earthquakes and other natural disasters. Global climate change can result in certain natural disasters occurring more frequently or with greater intensity, such as drought, wildfires, storms, sea-level rise, and flooding, and could disrupt the availability of water necessary for the operation of our fabrication facilities located in semi-arid regions. During 2020, the west coast of the U.S. experienced historic wildfires, including in Oregon, where we have major manufacturing facilities. The long-term effects of climate change on the global economy and the IT industry in particular are unclear, but could be severe.
Catastrophic events could make it difficult or impossible to manufacture or deliver products to our customers, receive production materials from our suppliers, or perform critical functions, which could adversely affect our revenue and require significant recovery time and expenditures to resume operations. While we maintain business recovery plans, some of our systems are not fully redundant and we cannot be sure that our plans will fully protect us from such disruptions. Furthermore, even if our operations are unaffected or recover quickly, if our customers or suppliers cannot timely resume their own operations due to a catastrophic event, we may experience reduced or cancelled orders or disruptions to our supply chain that may adversely affect our results of operations.
We maintain a program of insurance coverage for a variety of property, casualty, and other risks. The types and amounts of insurance we obtain vary depending on availability, cost, and decisions with respect to risk retention. Some of our policies have large deductibles and broad exclusions. In addition, one or more of our insurance providers may be unable or unwilling to pay a claim. Losses not covered by insurance may be large, which could harm our results of operations and financial condition.
Damage to our reputation can damage our business. Our reputation is a critical factor in our relationships with customers, employees, governments, suppliers, and other stakeholders. Our failure to address, or the appearance of our failure to address, issues that give rise to reputational risk, including those described throughout this Risk Factors section, could significantly harm our reputation and our brands. Our reputation can be impacted by catastrophic events (including our response to the COVID-19 pandemic); incidents involving unethical behavior or misconduct; product quality, security, or safety issues; allegations of legal noncompliance; internal control failures; corporate governance issues; data breaches; workplace safety incidents; environmental incidents; the use of our products for illegal or objectionable applications, including AI and machine learning applications that present ethical, regulatory, or other issues; marketing practices; media statements; the conduct of our suppliers or representatives; and other issues or incidents that, whether actual or perceived, result in adverse publicity. To the extent we fail to respond quickly and effectively to address corporate crises, the ensuing negative public reaction could significantly harm our reputation and our brands and could lead to increases in litigation claims and asserted damages or subject us to regulatory actions or restrictions.
Damage to our reputation could reduce demand for our products and adversely affect our business and operating environment. It could reduce investor confidence in us, adversely affecting our stock price. It may also limit our ability to be seen as an employer of choice when competing for highly skilled employees. Moreover, repairing our reputation and brands may be difficult, time-consuming, and expensive.
We are subject to cybersecurity and privacy risks.
We face risks related to cybersecurity threats and incidents. We regularly face attempts by others to gain unauthorized access through the Internet, or to introduce malicious software, to our IT systems. Individuals or organizations, including malicious hackers, state-sponsored organizations, insider threats including employees and third-party service providers, or intruders into our physical facilities, at times attempt to gain unauthorized access and/or corrupt the processes used to design and manufacture our hardware products and our associated software and services. Due to the widespread use of our products, we are a frequent target of computer hackers and organizations that intend to sabotage, take control of, or otherwise corrupt our manufacturing or other processes, products, and services. We are also a target of malicious attackers who attempt to gain access to our network or data centers or those of our suppliers, customers, or end users; steal proprietary information related to our business, products, employees, suppliers, and customers; interrupt our systems and services or those of our suppliers, customers, or others; or demand ransom to return control of such systems and services. Such attempts are increasing in number and in technical sophistication, and if successful, expose us and the affected parties to risk of loss or misuse of proprietary or confidential information or disruptions of our business operations, including our manufacturing operations. Our IT infrastructure also includes products and services provided by third parties, and these providers can experience breaches of their systems and products that impact the security of our systems and our proprietary or confidential information.
From time to time, we encounter intrusions or unauthorized access to our network, products, services, or infrastructure, as well as those of third parties who provide products and services to us. For example, in the fourth quarter of 2020, our Habana Labs subsidiary’s network was breached, resulting in unauthorized third-party access of certain confidential information, in connection with a suspected unsuccessful ransomware attack. The breach was confined to our subsidiary’s network and is not expected to have a material impact on Habana Labs’ business. We are also subject to risks associated with attacks involving our supply chain. In the fourth quarter of 2020, we became aware of reports that an update to widely used IT infrastructure management software provided by one of our vendors, SolarWinds Corporation, had been compromised by attackers, and we are investigating these reports. To date, cybersecurity incidents have not resulted in a material adverse impact to our business or operations, but there can be no guarantee we will not experience such an impact. Such incidents, whether or not successful, could result in our incurring significant costs related to, for example, rebuilding internal systems, writing down inventory value, implementing additional threat protection measures, providing modifications to our products and services, defending against litigation, responding to regulatory inquiries or actions, paying damages, providing customers with incentives to maintain the business relationship, or taking other remedial steps with respect to third parties, as well as reputational harm. In addition, these threats are constantly evolving, thereby increasing the difficulty of successfully defending against them or implementing adequate preventative measures. As a result of the COVID-19 pandemic, remote work and remote access to our systems has increased significantly, which also increases our cybersecurity attack surface. We have also seen an increase in cyberattack volume, frequency, and sophistication driven by the global enablement of remote workforces. We seek to detect and investigate unauthorized attempts and attacks against our network, products, and services, and to prevent their recurrence where practicable through changes to our internal processes and tools and changes or updates to our products and services; however, we remain potentially vulnerable to additional known or unknown threats. In some instances, we, our suppliers, our customers, and the users of our products and services can be unaware of an incident or its magnitude and effects.
Theft, loss, or misuse of personal data about our employees, customers, or other third parties could increase our expenses, damage our reputation, or result in legal or regulatory proceedings. The theft, loss, or misuse of personal data collected, used, stored, or transferred by us to run our business could result in significantly increased business and security costs or costs related to defending legal claims. We anticipate that our collection of such personal data will increase as we enter into the MaaS market in our Mobileye business, and it may increase as we enter into other new or adjacent businesses. Global privacy legislation, enforcement, and policy activity in this area are rapidly expanding and creating a complex regulatory compliance environment. Costs to comply with and implement these privacy-related and data protection measures could be significant, and noncompliance could expose us to significant monetary penalties, damage to our reputation, suspension of online services or sites in certain countries, and even criminal sanctions. Even our inadvertent failure to comply with federal, state, or international privacy-related or data-protection laws and regulations could result in audits, regulatory inquiries, or proceedings against us by governmental entities or other third parties.
We are subject to IP risks and risks associated with litigation and regulatory proceedings.
We cannot always enforce or protect our IP rights. We regard our patents, copyrights, trade secrets, and other IP rights as important to the success of our business. We rely on IP law—as well as confidentiality and licensing agreements with our customers, employees, technology development partners, and others—to protect our IP rights. Our ability to enforce these rights is subject to general litigation risks, as well as uncertainty as to the enforceability of our IP rights in various countries. We are not always able to enforce or protect our IP rights. Enforcement is costly and time-consuming and can divert management attention. When we seek to enforce our rights, we may be subject to claims that our IP rights are invalid, not enforceable, or licensed to an opposing party. Our assertion of IP rights may result in another party seeking to assert claims against us, which could harm our business. From time to time, governments adopt regulations—and governments or courts render decisions—requiring compulsory licensing of IP rights, or governments require products to meet standards that favor local companies. Our inability to enforce our IP rights under any of these circumstances can harm our competitive position and business. In some cases, our IP rights can offer inadequate protection for our innovations. In addition, the theft or unauthorized use or publication of our trade secrets and other confidential business information could harm our competitive position and reduce acceptance of our products; as a result, the value of our investment in R&D, product development, and marketing could be reduced. This risk is heightened as competitors for technical talent increasingly seek to hire our employees.
Our licenses with other companies and participation in industry initiatives at times allow competitors to use some of our patent rights. Technology companies often bilaterally license patents between each other to settle disputes or as part of business agreements. Some of our competitors have in the past had, and may in the future have, licenses to some of our patents, and under current case law, some of the licenses can exhaust our patent rights as to licensed product sales under some circumstances. Our participation in industry standards organizations or with other industry initiatives at times requires us to offer to license our patents to companies that adopt industry-standard specifications. Depending on the rules of the organization, government regulations, or court decisions, we sometimes have to grant licenses to some of our patents for little or no cost, and as a result, we may be unable to enforce certain patents against others, and the value of our IP rights may be impaired.
Third parties assert claims based on IP rights against us and our products, which could harm our business. We face claims based on IP rights from individuals and companies, including claims from those who have aggregated patents acquired from multiple sources to form a new, larger portfolio to assert claims against us and other companies. Some of these claimants are funded by investment firms and have substantial resources, which can increase our defense costs. Additionally, large patent portfolio owners sometimes divest portions of their portfolios to more than one individual or company, increasing the number of parties who own IP rights previously all held by a single party. We are typically engaged in a number of disputes involving IP rights. Claims that our products or processes infringe the IP rights of others, regardless of their merits, cause us to incur large costs to respond to, defend, and resolve the claims, and they divert the efforts and attention of our management and technical personnel from our business and operations. In addition, we may face claims based on the alleged theft or unauthorized use or disclosure of third-party trade secrets, confidential information, or end-user data that we obtain in conducting our business. Any such incidents and claims could severely disrupt our business, and we could suffer losses, including the cost of product recalls and returns, and reputational harm. Furthermore, we have agreed to indemnify customers for certain IP rights claims against them. IP rights claims against our customers could also limit demand for our products or disrupt our customers' businesses, which could in turn adversely affect our results of operations.
As a result of IP rights claims, we could:
▪pay monetary damages, including payments to satisfy indemnification obligations, or royalties;
▪stop manufacturing, using, selling, offering to sell, or importing products or technology subject to claims;
▪need to develop other products or technology not subject to claims, which could be time-consuming or costly; and/or
▪enter into settlement or license agreements, which agreements may not be available on commercially reasonable terms.
These IP rights claims could harm our competitive position, result in expenses, or require us to impair our assets. If we alter or stop production of affected items, our revenue could be harmed.
We rely on access to third-party IP, which may not be available to us on commercially reasonable terms or at all. Many of our products include third-party technology or implement industry standards and may require licenses from third parties. Based on past experience and industry practice, we believe such licenses generally can be obtained on commercially reasonable terms. However, there is no assurance that the necessary licenses can be obtained on acceptable terms or at all. Failure to obtain the right to use third-party technology, or to license IP on commercially reasonable terms, could preclude us from selling certain products or otherwise have a material adverse impact on our financial condition and operating results. To the extent our products include software that contains or is derived from open-source software, we may be required to make the software's source code publicly available and/or license the software under open-source licensing terms.
We are subject to risks associated with litigation and regulatory matters. From time to time, we face legal claims or regulatory matters involving stockholder, consumer, competition, commercial, IP, and other issues on a global basis. As described in "Note 19: Commitments and Contingencies" within the Consolidated Financial Statements, we are engaged in a number of litigation and regulatory matters. Litigation and regulatory proceedings are inherently uncertain, and adverse rulings could occur, including monetary damages, or an injunction stopping us from manufacturing or selling certain products, engaging in certain business practices, or requiring other remedies, such as compulsory licensing of patents. An unfavorable outcome can result in a material adverse impact on our business, financial condition, and results of operations. In addition, regardless of the outcome, litigation and regulatory proceedings can be costly, time-consuming, disruptive to our operations, harmful to our reputation, and distracting to management.
We must attract, retain, and motivate key employees.
Hiring and retaining qualified executives, scientists, engineers, technical staff, and sales representatives are critical to our business. The competition for highly skilled employees in our industry is increasingly intense. Competitors for technical talent increasingly seek to hire our employees. In addition, changes in immigration policies may further limit the pool of available talent and impair our ability to recruit and hire technical and professional talent. Changes in the interpretation and application of employment-related laws to our workforce practices may also result in increased operating costs and less flexibility in how we meet our changing workforce needs. To help attract, retain, and motivate qualified employees, we use share-based awards, such as RSUs, and performance-based cash incentive awards. Our employee hiring and retention also depend on our ability to build and maintain a diverse and inclusive workplace culture and be viewed as an employer of choice. If our share-based or other compensation programs and workplace culture cease to be viewed as competitive, our ability to attract, retain, and motivate employees would be weakened, which could harm our results of operations. Moreover, sustained declines in our stock price can reduce the retention value of our share-based awards. Changes in our management team can also disrupt our business. For example, we underwent several significant changes to our technical leadership during 2020 and announced the appointment of a new CEO in January 2021. The failure to successfully transition and assimilate key employees, including in connection with these changes, could adversely affect our results of operations. To the extent we do not effectively hire, onboard, retain, and motivate key employees, our business can be harmed.
We are subject to risks associated with our strategic transactions.
Our acquisitions, divestitures, and other strategic transactions could fail to achieve our financial or strategic objectives, disrupt our ongoing business, and adversely impact our results of operations. Strategic transactions are an important component of our financial capital allocation strategy. We routinely evaluate opportunities and enter into agreements for possible acquisitions, divestitures, and other strategic transactions. These transactions involve numerous risks, including:
▪our inability to identify opportunities in a timely manner or on terms acceptable to us;
▪failure of the transaction to advance our business strategy and of its anticipated benefits to materialize;
▪disruption of our ongoing operations and diversion of our management's attention;
▪failure to complete a transaction in a timely manner, if at all, due to our inability to obtain required government or other approvals at all or without materially burdensome conditions, IP disputes or other litigation, difficulty in obtaining financing on terms acceptable to us, or other unforeseen factors;
▪our failure to realize a satisfactory return on our investment, potentially resulting in an impairment of goodwill and other assets, and restructuring charges;
▪our inability to effectively enter new market segments through our strategic transactions or retain customers and partners of acquired businesses;
▪our inability to retain key personnel of acquired businesses or our difficulty in integrating employees, business systems, and technology;
▪controls, processes, and procedures of acquired businesses that do not adequately ensure compliance with laws and regulations, and our failure to identify compliance issues or liabilities;
▪our failure to identify, or our underestimation of, commitments, liabilities, and other risks associated with acquired businesses or assets; and
▪the potential for our acquisitions to result in dilutive issuances of our equity securities or significant additional debt.
Any of these risks could have a material adverse effect on our business, results of operations, financial condition, or cash flows, particularly in the case of a large acquisition or several concurrent acquisitions. Moreover, our resources are limited and our decision to pursue a transaction has opportunity costs; accordingly, if we pursue a particular transaction, we at times need to forgo the prospect of entering into other transactions that could help us achieve our financial or strategic objectives.
Where an existing investment does not meet our criteria for success, we routinely evaluate opportunities for possible divestitures and other options. We may not realize the anticipated benefits of divestitures, such as the pending divestiture of our NAND memory business to SK hynix, due to risks that include unfavorable prices and terms; changes in market conditions or geopolitical conditions affecting the regions or industries in which we or counterparties operate; failure to receive regulatory or governmental approvals; limitations or restrictions due to regulatory or governmental approvals, litigation, contractual terms, or other conditions; delays in closing; lack of support by third parties; actions by competitors; adverse effects on our business relationships, operating results, or business due to the announcement and pendency of such transactions; and continued financial obligations, unanticipated liabilities, or transition costs associated with such transactions. In some cases, we are not able to divest investments on acceptable terms or at all.
We invest in public and private companies and do not always realize a return on our investments. We make investments in public and private companies around the world to further our strategic and financial objectives and to support certain key business initiatives. Companies in which we invest range from early-stage companies still defining their strategic direction to mature companies with established revenue streams and business models. Many of the instruments in which we invest are non-marketable and illiquid at the time of our initial investment, and we are not always able to achieve a return in a timely fashion, if at all. Our ability to realize a return on our investment in a private company, if any, is typically dependent on the company participating in a liquidity event, such as a public offering or acquisition. To the extent any of the companies in which we invest are not successful, which can include failures to achieve business objectives as well as bankruptcy, we could recognize an impairment and/or lose all or part of our investment.
We are subject to sales-related risks.
We face risks related to sales through distributors and other third parties. We sell a significant portion of our products through third parties such as distributors, value-added resellers, and channel partners (collectively referred to as distributors), as well as OEMs and ODMs. We depend on many distributors to help us create end-customer demand, provide technical support and other value-added services to customers, fill customer orders, and stock our products. At times, we rely on one or more key distributors for a product, and a material change in our relationship with one or more of these distributors or their failure to perform as expected could reduce our revenue. Our ability to add or replace distributors for some of our products is limited. In addition, our distributors' expertise in the determination and stocking of acceptable inventory levels for some of our products is not always easily transferable to a new distributor; as a result, end customers may be hesitant to accept the addition or replacement of a distributor. Using third parties for distribution exposes us to many risks, including competitive pressure and concentration, credit, and compliance risks. Distributors and other third parties sell products that compete with our products, and we sometimes need to provide financial and other incentives to focus them on the sale of our products. From time to time, they face financial difficulties, including bankruptcy, which could harm our collection of accounts receivable and financial results. Violations of the Foreign Corrupt Practices Act or similar laws by distributors or other third-party intermediaries could have a material impact on our business. Failure to manage risks related to our use of distributors and other third parties may reduce sales, increase expenses, and weaken our competitive position.
From time to time, our products are resold by third parties in an unauthorized "gray market." Gray market products can distort demand and pricing dynamics in our distribution channel and certain geographies, which at times adversely affects our revenue opportunities. Gray market activity is difficult to monitor and can make forecasting demand more challenging. Gray market products also sometimes include parts that have been altered or damaged, and our reputation may be harmed when these products fail or are found to be substandard.
We receive a significant portion of our revenue from a limited number of customers. Collectively, our three largest customers accounted for 39% of our net revenue in 2020 and 41% of our net revenue in 2019. We expect a small number of customers will continue to account for a significant portion of our revenue in the foreseeable future.
Industry trends, such as the increasing shift of data center workloads to the public cloud, have increased the significance and purchasing power of certain customers, particularly cloud service providers, in some of our data-centric businesses. The cloud and cloud applications represent a new and increasingly demanding computing environment. The further consolidation of computing workloads in the cloud, and consolidation among cloud service providers, can heighten the competitive importance of factors such as collaboration and customization with cloud service provider customers to optimize products for their environments; optimization for cloud services and applications; product performance; energy efficiency; feature differentiation; product quality, reliability, and factors affecting server uptime; and product security and security features. We are operating in an increasingly competitive environment, and to the extent we do not execute effectively across these factors, our competitive position and market segment share may be adversely affected.
Some cloud service provider customers have also internally developed, and may continue to develop, their own semiconductors, including designs customized for their specific computing workloads. The shift of data center workloads to the cloud has also adversely affected, and may continue to affect, sales to enterprise and government market segment customers when end users have elected to migrate workloads. During the second half of 2020, the mix shift in sales from enterprise and government market segment customers to cloud service providers contributed to lower ASPs in DCG. To the extent we differentiate our products through customization to meet cloud customer specifications, order changes, delays, or cancellations may result in non-recoverable costs.
The loss of, or substantial reduction in sales to, one of our key customers, or their delays in orders for our products, can lead to a reduction in our revenue and harm our results of operations and financial condition. For more information about our customers, including customers who accounted for greater than 10% of our net consolidated revenue, see "Note 3: Operating Segments" within the Consolidated Financial Statements.
We face risks related to transactions with government entities. We receive proceeds from U.S. federal, state, local, and foreign government entities associated with grants, incentives, and sales of our products and services. Government demand and payment are often affected by public sector budgetary cycles and funding authorizations, including, with respect to U.S. government contracts, congressional approval of appropriations. Government contracts are subject to procurement laws and regulations relating to the award, administration, and performance of those contracts, as well as oversight and penalties for violations. For example, U.S. government contracts are subject to special rules on accounting, IP rights, expenses, reviews, information handling, and security, and failure to comply with these rules could result in civil and criminal penalties and sanctions, including termination of contracts, fines, and suspension or debarment from future business with the U.S. government.
Changes in our effective tax rate may reduce our net income.
A number of factors can increase our effective tax rates, which could reduce our net income, including:
▪changes in the volume and mix of profits earned and location of assets across jurisdictions with varying tax rates;
▪the resolution of issues arising from tax audits, including payment of interest and penalties;
▪changes in the valuation of our deferred tax assets and liabilities, and in deferred tax valuation allowances;
▪adjustments to income taxes upon finalization of tax returns;
▪increases in expenses not deductible for tax purposes, including impairments of goodwill;
▪changes in available tax credits;
▪changes in our ability to secure new, or renew existing, tax holidays and incentives;
▪changes in U.S. federal, state, or foreign tax laws or their interpretation, including changes in the U.S. to the taxation of manufacturing enterprises and of non-U.S. income and expenses and changes resulting from the adoption by countries of OECD recommendations or other legislative actions;
▪changes in accounting standards; and
▪our decision to repatriate non-U.S. earnings for which we have not previously provided for local country withholding taxes incurred upon repatriation.
We have fluctuations in the amount and frequency of our stock repurchases.
We are not obligated to make repurchases under our stock repurchase program, and the amount, timing, and execution of our repurchases fluctuate based on our priorities for the use of cash for other purposes—such as investing in our business, including operational spending, capital spending, and acquisitions, and returning cash to our stockholders as dividend payments. Changes in cash flows, tax laws and other laws, and the market price of our common stock can also limit or alter the amount and frequency of our stock repurchases. Our stock repurchase program may be suspended or terminated at any time. For example, we suspended stock repurchases during a portion of 2020 due to uncertainty surrounding the COVID-19 pandemic. Moreover, we cannot guarantee that our stock repurchase program will enhance long-term stockholder value.
Properties
As of December 26, 2020, our major facilities consisted of:
| | | | | | | | | | | | | | | | | | | | |
| (Square Feet in Millions) | | United
States | | Other
Countries | | Total |
| Owned facilities | | 31 | | | 23 | | | 54 | |
| Leased facilities | | 1 | | | 5 | | | 6 | |
| Total facilities | | 32 | | | 28 | | | 60 | |
Our principal executive offices are located in the U.S. For more information on our wafer fabrication and our assembly and test facilities, see "Manufacturing Capital" within Fundamentals of Our Business.
The facilities described above are suitable for our present purposes, and the productive capacity in our facilities is being utilized or being prepared for utilization as we continue to make investments to expand our manufacturing capacity.
We do not identify or allocate assets by operating segment, as they are interchangeable in nature and used by multiple operating segments. For information on net property, plant and equipment by country, see "Note 6: Other Financial Statement Details" within the Financial Statements and Supplemental Details.
Market for Our Common Stock
The principal U.S. market on which Intel's common stock (symbol INTC) is traded is the Nasdaq Global Select Market. For dividend information, see "Financial Information by Quarter (Unaudited)" within Financial Statements and Supplemental Details.
As of January 15, 2021, there were approximately 107,222 registered holders of record of Intel's common stock. A substantially greater number of holders of Intel common stock are "street name" or beneficial holders, whose shares of record are held by banks, brokers, and other financial institutions.
Stock Performance Graph
The graph and table that follow compare the cumulative TSR of Intel's common stock with the cumulative total return of the S&P 100 Index*, the S&P 500 Index*, the S&P 500 IT Index*, and the SOX Index*1 for the five years ended December 26, 2020. The cumulative returns shown on the graph are based on Intel's fiscal year.
Comparison of Five-Year Cumulative Return for
Intel, S&P 100 Index, S&P 500 Index, S&P 500 IT Index, and SOX Index
| | | | | | | | | | | | | | | | | | | | | | | | | | | | | | | | | | | | | | |
| Years Ended | | Dec 26, 2015 | | Dec 31, 2016 | | Dec 30, 2017 | | Dec 29, 2018 | | Dec 28, 2019 | | Dec 26, 2020 |
| Intel Corporation | | $ | 100 | | | $ | 107 | | | $ | 140 | | | $ | 145 | | | $ | 192 | | | $ | 154 | |
| | | | | | | | | | | | |
| S&P 100 Index | | $ | 100 | | | $ | 110 | | | $ | 135 | | | $ | 128 | | | $ | 172 | | | $ | 205 | |
| S&P 500 Index | | $ | 100 | | | $ | 111 | | | $ | 135 | | | $ | 128 | | | $ | 171 | | | $ | 199 | |
| S&P 500 IT Index | | $ | 100 | | | $ | 113 | | | $ | 157 | | | $ | 155 | | | $ | 235 | | | $ | 335 | |
| SOX Index | | $ | 100 | | | $ | 137 | | | $ | 193 | | | $ | 180 | | | $ | 297 | | | $ | 447 | |
1 The graph and table assume that $100 was invested on the last day of trading for the fiscal year ended December 26, 2015 in Intel's common stock, the S&P 100 Index, S&P 500 Index, S&P 500 IT Index, and PHLX Semiconductor Sector Index (SOX), and that all dividends were reinvested.
Issuer Purchases of Equity Securities
We have an ongoing authorization, originally approved by our Board of Directors in 2005, and subsequently amended, to repurchase shares of our common stock in open market or negotiated transactions. In March 2020, we suspended stock repurchases in light of the COVID-19 pandemic. In August 2020, we entered into ASR agreements to repurchase $10.0 billion of our common stock and these agreements were settled in December 2020. As of December 26, 2020, we were authorized to repurchase up to $110.0 billion, of which $9.7 billion remained available.
Common stock repurchase activity under our publicly announced stock repurchase program during each quarter of 2020 was as follows:
| | | | | | | | | | | | | | | | | | | | |
| Period | | Total Number of
Shares Purchased
(In Millions) | | Average Price
Paid Per Share | | Dollar Value of
Shares That May
Yet Be Purchased Under the Program
(In Millions) |
| December 29, 2019 - March 28, 2020 | | 71.4 | | | $ | 57.60 | | | $ | 19,658 | |
| March 29, 2020 - June 27, 2020 | | — | | | $ | — | | | $ | 19,658 | |
| June 28, 2020 - September 26, 2020 | | | | | | |
Accelerated Share Repurchases1 | | 165.5 | | | $ | 49.20 | | | $ | 9,658 | |
| September 27, 2020 - December 26, 2020 | | | | | | |
Accelerated Share Repurchases1 | | 37.7 | | | $ | 49.20 | | | $ | 9,658 | |
| Total | | 274.6 | | | | | |
Common stock repurchase activity under our stock repurchase program during Q4 2020 was as follows:
| | | | | | | | | | | | | | | | | | | | |
| Period | | Total Number of
Shares Purchased
(In Millions) | | Average Price
Paid Per Share | | Dollar Value of
Shares That May
Yet Be Purchased Under the Program
(In Millions) |
| September 27, 2020 - October 24, 2020 | | — | | | $ | — | | | $ | 9,658 | |
| October 25, 2020 - November 21, 2020 | | — | | | $ | — | | | $ | 9,658 | |
| November 22, 2020 - December 26, 2020 | | | | | | |
Accelerated Share Repurchases1 | | 37.7 | | | $ | 49.20 | | | $ | 9,658 | |
| Total | | 37.7 | | | | | |
1 In August 2020, we entered into ASR agreements with financial institutions under which we paid an aggregate of $10.0 billion and received an aggregate initial share delivery of 165.5 million shares of our common stock, which were immediately retired. We received and immediately retired an additional 37.7 million shares upon settlement of the ASR agreements in December 2020. In total, 203.2 million shares were repurchased under the ASR agreements at an average repurchase price per share of $49.20.
We issue RSUs as part of our equity incentive plans. In our Consolidated Financial Statements, we treat shares of common stock withheld for tax purposes on behalf of our employees in connection with the vesting of RSUs as common stock repurchases because they reduce the number of shares that would have been issued upon vesting. These withheld shares of common stock are not considered common stock repurchases under our authorized common stock repurchase program and are excluded from the preceding table.
Information About Our Executive Officers
| | | | | | | | | | | | | | |
Name Current Title | | Age | | Experience |
| Gregory M. Bryant | | 52 | | Mr. Bryant is our Executive Vice President and General Manager of the Client Computing Group, leading strategy and product development for client computing end-user solutions, including notebooks, desktops, and client adjacencies. Mr. Bryant served as Senior Vice President and General Manager of CCG from June 2017 to September 2019. From January 2015 to June 2017, he served as Corporate Vice President and General Manager of the Connected Home and Commercial Client Group within CCG. Prior to that, he was Vice President and General Manager for the Asia Pacific and Japan region, based in Hong Kong from 2012 to 2015. From 2010 to 2012, he was a Vice President in the Sales and Marketing Group located in Beijing, China, and from 2007 to 2010, he was a Vice President in the Digital Enterprise Group. Mr. Bryant joined Intel in 1992 and has also held engineering, operations, and director roles in Intel's information technology organization. |
| Executive Vice President and General Manager, Client Computing Group | | | |
| | | |
| | | |
| | | | |
| George S. Davis | | 63 | | Mr. Davis joined Intel in April 2019 as our Executive Vice President and Chief Financial Officer. He oversees Intel's global finance and information technology organizations, as well as its M&A function. Prior to joining Intel, Mr. Davis was Executive Vice President and Chief Financial Officer of Qualcomm, a global provider of wireless technologies, from March 2013 to April 2019, where he led the finance, information technology, and investor relations organizations. Mr. Davis was Chief Financial Officer of Applied Materials, Inc. from November 2006 to March 2013. He held several other leadership positions at Applied Materials from November 1999 to November 2006. Prior to joining Applied Materials, Mr. Davis served for 19 years with Atlantic Richfield Company in a number of finance and other corporate positions. Mr. Davis serves on the board of trustees of the Old Globe Theatre. He is also a member of the Wall Street Journal CFO Council and a member of the USA Chapter of The Prince's Accounting for Sustainability Project CFO Leadership Network. |
| Chief Financial Officer | | | |
| | | |
| | | |
| | | | |
| Steven R. Rodgers | | 55 | | Mr. Rodgers has been our Executive Vice President and General Counsel since January 2017 and oversees our legal, government, and China groups. He previously led our legal and government groups as Senior Vice President and General Counsel from January 2015 to January 2017 and as Corporate Vice President and General Counsel from June 2014 to January 2015. Mr. Rodgers joined Intel in 2000 and has held a number of roles in our legal department, including Corporate Vice President and Deputy General Counsel from January 2014 until his appointment as Intel's fifth General Counsel in June 2014. Prior to joining Intel, he was a litigation partner at the firm of Brown & Bain, P.A. |
| Executive Vice President and General Counsel | | | |
| | | |
| | | |
| | | | |
| Navin Shenoy | | 47 | | Mr. Shenoy oversees our DCG, IOTG, and PSG businesses and leads strategy and product development for most of our data-centric offerings, including server, network, storage, AI, Internet of Things, and FPGA products, across a range of use cases that include cloud computing, virtualization of network infrastructure, and AI adoption. Mr. Shenoy has served in this role since May 2017, and his organization was renamed the Data Platforms Group, from the Data Center Group, in November 2019. From May 2016 to May 2017, Mr. Shenoy was Senior Vice President and General Manager of CCG. From April 2012 to April 2016, he served as General Manager of the Mobility Client Platform Division, as Vice President from April 2012 until December 2014 and Corporate Vice President from January 2015 to May 2016. From October 2007 to April 2012, Mr. Shenoy served as Vice President and General Manager of our Asia-Pacific business. He joined Intel in 1995. |
| Executive Vice President and General Manager, Data Platforms Group | | | |
| | | |
| | | |
| | | | |
| Robert ("Bob") H. Swan | | 60 | | Mr. Swan has served as our Chief Executive Officer and a member of our Board of Directors since January 2019. Prior to his current role, Mr. Swan served as our Executive Vice President, Chief Financial Officer from October 2016 until January 2019, and as our interim Chief Executive Officer from June 2018 until January 2019. Prior to joining Intel, Mr. Swan served as an Operating Partner at General Atlantic LLC, a private equity firm, from September 2015 to September 2016. He served as Senior Vice President, Finance and Chief Financial Officer of eBay Inc. from March 2006 to July 2015. Previously, Mr. Swan served as Executive Vice President, Chief Financial Officer of Electronic Data Systems Corporation, Executive Vice President, Chief Financial Officer of TRW Inc., as well as Chief Financial Officer, Chief Operating Officer, and Chief Executive Officer of Webvan Group, Inc. Mr. Swan began his career in 1985 at General Electric, serving for 15 years in numerous senior finance roles. Mr. Swan also serves on the board of directors of eBay. In January 2021, we announced that Mr. Swan would depart from the company and our Board of Directors effective as of February 15, 2021 and that Patrick ("Pat") Gelsinger would be appointed Chief Executive Officer and a member of our Board effective as of that date. |
| Chief Executive Officer | | | |
| | | |
| | | |
Availability of Company Information
Our Internet address is www.intel.com. We publish voluntary reports on our website that outline our performance with respect to corporate responsibility, including environmental, health, and safety compliance.
We use our Investor Relations website, www.intc.com, as a routine channel for distribution of important information, including news releases, information about upcoming webcasts, analyst presentations, financial information, corporate governance practices, and corporate responsibility information. We post our filings at www.intc.com the same day they are electronically filed with, or furnished to, the SEC, including our annual and quarterly reports on Forms 10-K and 10-Q and current reports on Form 8-K; our proxy statements; and any amendments to those reports or statements. We post our quarterly and annual earnings results at www.intc.com, and do not distribute our financial results via a news wire service. All such postings and filings are available on our Investor Relations website free of charge. In addition, our Investor Relations website allows interested persons to sign up to automatically receive e-mail alerts when we post financial information and issue press releases, and to receive information about upcoming events.
The content on any website referred to in this Form 10-K is not incorporated by reference in this Form 10-K unless expressly noted.
Financial Statements and Supplemental Details
We have defined certain terms and abbreviations used throughout our Form 10-K in "Key Terms" within this section.
| | | | | |
| Index to Consolidated Financial Statements | Page |
| Reports of Independent Registered Public Accounting Firm | |
| |
| Consolidated Statements of Income | |
| Consolidated Statements of Comprehensive Income | |
| Consolidated Balance Sheets | |
| Consolidated Statements of Cash Flows | |
| Consolidated Statements of Stockholders' Equity | |
| |
| Notes to Consolidated Financial Statements | |
| |
| Basis | |
| Note 1: Basis of Presentation | |
| Note 2: Accounting Policies | |
| |
| Performance and Operations | |
| Note 3: Operating Segments | |
| Note 4: Earnings Per Share | |
| Note 5: Contract Liabilities | |
| Note 6: Other Financial Statement Details | |
| Note 7: Restructuring and Other Charges | |
| Note 8: Income Taxes | |
| Investments, Long-term Assets, and Debt | |
| Note 9: Investments | |
| Note 10: Acquisitions and Divestitures | |
| Note 11: Goodwill | |
| Note 12: Identified Intangible Assets | |
| |
| Note 13: Borrowings | |
| Note 14: Fair Value | |
| Risk Management and Other | |
| Note 15: Other Comprehensive Income (Loss) | |
| Note 16: Derivative Financial Instruments | |
| Note 17: Retirement Benefit Plans | |
| Note 18: Employee Equity Incentive Plans | |
| Note 19: Commitments and Contingencies | |
| Key Terms | |
| |
| Index to Supplemental Details | |
| Financial Information by Quarter | |
| Controls and Procedures | |
| Exhibits | |
| Form 10-K Cross-Reference Index | |
| | | | | |
| Report of Independent Registered Public Accounting Firm | |
| |
To the Stockholders and the Board of Directors of Intel Corporation
Opinion on the Financial Statements
We have audited the accompanying Consolidated Balance Sheets of Intel Corporation (the Company) as of December 26, 2020 and December 28, 2019, the related Consolidated Statements of Income, Comprehensive Income, Cash Flows and Stockholders' Equity for each of the three years in the period ended December 26, 2020, and the related notes (collectively referred to as the "Consolidated Financial Statements"). In our opinion, the Consolidated Financial Statements present fairly, in all material respects, the financial position of the Company at December 26, 2020 and December 28, 2019, and the results of its operations and its cash flows for each of the three years in the period ended December 26, 2020, in conformity with U.S. generally accepted accounting principles.
We also have audited, in accordance with the standards of the Public Company Accounting Oversight Board (United States) (PCAOB), the Company's internal control over financial reporting as of December 26, 2020, based on criteria established in Internal Control—Integrated Framework issued by the Committee of Sponsoring Organizations of the Treadway Commission (2013 framework) and our report dated January 21, 2021 expressed an unqualified opinion thereon.
Basis for Opinion
These financial statements are the responsibility of the Company's management. Our responsibility is to express an opinion on the Company's financial statements based on our audits. We are a public accounting firm registered with the PCAOB and are required to be independent with respect to the Company in accordance with the U.S. federal securities laws and the applicable rules and regulations of the Securities and Exchange Commission and the PCAOB.
We conducted our audits in accordance with the standards of the PCAOB. Those standards require that we plan and perform the audit to obtain reasonable assurance about whether the financial statements are free of material misstatement, whether due to error or fraud. Our audits included performing procedures to assess the risks of material misstatement of the financial statements, whether due to error or fraud, and performing procedures that respond to those risks. Such procedures included examining, on a test basis, evidence regarding the amounts and disclosures in the financial statements. Our audits also included evaluating the accounting principles used and significant estimates made by management, as well as evaluating the overall presentation of the financial statements. We believe that our audits provide a reasonable basis for our opinion.
Critical Audit Matter
The critical audit matter communicated below is a matter arising from the current period audit of the financial statements that was communicated or required to be communicated to the audit committee and that: (1) relates to accounts or disclosures that are material to the financial statements and (2) involved our especially challenging, subjective or complex judgments. The communication of the critical audit matter does not alter in any way our opinion on the Consolidated Financial Statements, taken as a whole, and we are not, by communicating the critical audit matter below, providing a separate opinion on the critical audit matter or on the accounts or disclosures to which it relates.
| | | | | | | | |
| | Inventory Valuation |
| | |
| Description of the Matter | | The Company's net inventory totaled $8.4 billion as of December 26, 2020, representing 5.5% of total assets. As explained in "Note 2: Accounting Policies" within the Consolidated Financial Statements, the Company computes inventory cost on a first-in, first-out basis, and applies judgment in determining saleability of products and the valuation of inventories. The Company assesses inventory at each reporting date in order to assert that it is recorded at net realizable value, giving consideration to, among other factors: whether the products have achieved the substantive engineering milestones to qualify for sale to customers; the determination of normal capacity levels in its manufacturing process to determine which manufacturing overhead costs can be included in the valuation of inventory; whether the product is valued at the lower of cost or net realizable value; and the estimation of excess and obsolete inventory or that which is not of saleable quality. |
| |
| Auditing management’s assessment of net realizable value for inventory was challenging because the determination of lower of cost or net realizable value and excess and obsolete inventory reserves is judgmental and considers a number of factors that are affected by market and economic conditions, such as customer forecasts, dynamic pricing environments, and industry supply and demand. Additionally, for certain new product launches there is limited historical data with which to evaluate forecasts. |
| | |
How We Addressed
the Matter in Our Audit | | We evaluated and tested the design and operating effectiveness of the Company’s internal controls over the costing of inventory, the determination of whether inventory is of saleable quality, the calculation of lower of cost or net realizable value reserves including related estimated costs and selling prices, and the determination of demand forecasts and related application against on hand inventory. |
| |
| Our audit procedures included, among others, testing the significant assumptions (e.g., estimated product costs and selling prices, and product demand forecasts) and the underlying data used in management’s inventory valuation assessment. We compared the significant assumptions used by management to current industry and economic trends. We assessed whether there were any potential sources of contrary information, including historical forecast accuracy or history of significant revisions to previously recorded inventory valuation adjustments, and performed sensitivity analyses over significant assumptions to evaluate the changes in inventory valuation that would result from changes in the assumptions. |
/s/ Ernst & Young LLP
We have served as the Company's auditor since 1968.
San Jose, California
January 21, 2021
| | | | | |
| Report of Independent Registered Public Accounting Firm | |
| |
To the Stockholders and the Board of Directors of Intel Corporation
Opinion on Internal Control Over Financial Reporting
We have audited Intel Corporation's internal control over financial reporting as of December 26, 2020, based on criteria established in Internal Control—Integrated Framework issued by the Committee of Sponsoring Organizations of the Treadway Commission (2013 framework), (the COSO criteria). In our opinion, Intel Corporation (the Company) maintained, in all material respects, effective internal control over financial reporting as of December 26, 2020, based on the COSO criteria.
We also have audited, in accordance with the standards of the Public Company Accounting Oversight Board (United States) (PCAOB), the 2020 Consolidated Financial Statements of the Company and our report dated January 21, 2021 expressed an unqualified opinion thereon.
Basis for Opinion
The Company's management is responsible for maintaining effective internal control over financial reporting and for its assessment of the effectiveness of internal control over financial reporting included in the accompanying Management Report on Internal Control Over Financial Reporting. Our responsibility is to express an opinion on the Company's internal control over financial reporting based on our audit. We are a public accounting firm registered with the PCAOB and are required to be independent with respect to the Company in accordance with the U.S. federal securities laws and the applicable rules and regulations of the Securities and Exchange Commission and the PCAOB.
We conducted our audit in accordance with the standards of the PCAOB. Those standards require that we plan and perform the audit to obtain reasonable assurance about whether effective internal control over financial reporting was maintained in all material respects.
Our audit included obtaining an understanding of internal control over financial reporting, assessing the risk that a material weakness exists, testing and evaluating the design and operating effectiveness of internal control based on the assessed risk, and performing such other procedures as we considered necessary in the circumstances. We believe that our audit provides a reasonable basis for our opinion.
Definition and Limitations of Internal Control Over Financial Reporting
A company's internal control over financial reporting is a process designed to provide reasonable assurance regarding the reliability of financial reporting and the preparation of financial statements for external purposes in accordance with generally accepted accounting principles. A company's internal control over financial reporting includes those policies and procedures that (1) pertain to the maintenance of records that, in reasonable detail, accurately and fairly reflect the transactions and dispositions of the assets of the company; (2) provide reasonable assurance that transactions are recorded as necessary to permit preparation of financial statements in accordance with generally accepted accounting principles, and that receipts and expenditures of the company are being made only in accordance with authorizations of management and directors of the company; and (3) provide reasonable assurance regarding prevention or timely detection of unauthorized acquisition, use, or disposition of the company's assets that could have a material effect on the financial statements.
Because of its inherent limitations, internal control over financial reporting may not prevent or detect misstatements. Also, projections of any evaluation of effectiveness to future periods are subject to the risk that controls may become inadequate because of changes in conditions, or that the degree of compliance with the policies or procedures may deteriorate.
/s/ Ernst & Young LLP
San Jose, California
January 21, 2021
| | | | | |
| Consolidated Statements of Income | |
| |
| | | | | | | | | | | | | | | | | | | | |
| Years Ended (In Millions, Except Per Share Amounts) | | Dec 26, 2020 | | Dec 28, 2019 | | Dec 29, 2018 |
| Net revenue | | $ | 77,867 | | | $ | 71,965 | | | $ | 70,848 | |
| Cost of sales | | 34,255 | | | 29,825 | | | 27,111 | |
| Gross margin | | 43,612 | | | 42,140 | | | 43,737 | |
| Research and development | | 13,556 | | | 13,362 | | | 13,543 | |
| Marketing, general and administrative | | 6,180 | | | 6,350 | | | 6,950 | |
| Restructuring and other charges | | 198 | | | 393 | | | (72) | |
| | | | | | |
| Operating expenses | | 19,934 | | | 20,105 | | | 20,421 | |
| Operating income | | 23,678 | | | 22,035 | | | 23,316 | |
| Gains (losses) on equity investments, net | | 1,904 | | | 1,539 | | | (125) | |
| Interest and other, net | | (504) | | | 484 | | | 126 | |
| Income before taxes | | 25,078 | | | 24,058 | | | 23,317 | |
| Provision for taxes | | 4,179 | | | 3,010 | | | 2,264 | |
| Net income | | $ | 20,899 | | | $ | 21,048 | | | $ | 21,053 | |
| Earnings per share—basic | | $ | 4.98 | | | $ | 4.77 | | | $ | 4.57 | |
| Earnings per share—diluted | | $ | 4.94 | | | $ | 4.71 | | | $ | 4.48 | |
| | | | | | |
| Weighted average shares of common stock outstanding: | | | | | | |
| Basic | | 4,199 | | | 4,417 | | | 4,611 | |
| Diluted | | 4,232 | | | 4,473 | | | 4,701 | |
See accompanying notes.
| | | | | | | | | | | |
| Financial Statements | Consolidated Statements of Income | 74 |
| | | | | |
| Consolidated Statements of Comprehensive Income | |
| |
| | | | | | | | | | | | | | | | | | | | |
| Years Ended (In Millions) | | Dec 26, 2020 | | Dec 28, 2019 | | Dec 29, 2018 |
| Net income | | $ | 20,899 | | | $ | 21,048 | | | $ | 21,053 | |
| Changes in other comprehensive income, net of tax: | | | | | | |
| | | | | | |
| | | | | | |
| Net unrealized holding gains (losses) on derivatives | | 677 | | | 177 | | | (253) | |
| Actuarial valuation and other pension benefits (expenses), net | | (183) | | | (564) | | | 210 | |
| Translation adjustments and other | | 35 | | | 81 | | | (3) | |
| Other comprehensive income (loss) | | 529 | | | (306) | | | (46) | |
| Total comprehensive income | | $ | 21,428 | | | $ | 20,742 | | | $ | 21,007 | |
See accompanying notes.
| | | | | | | | | | | |
| Financial Statements | Consolidated Statements of Comprehensive Income | 75 |
| | | | | |
| Consolidated Balance Sheets | |
| |
| | | | | | | | | | | | | | |
| (In Millions, Except Par Value) | | Dec 26, 2020 | | Dec 28, 2019 |
| Assets | | | | |
| Current assets: | | | | |
| Cash and cash equivalents | | $ | 5,865 | | | $ | 4,194 | |
| Short-term investments | | 2,292 | | | 1,082 | |
| Trading assets | | 15,738 | | | 7,847 | |
| Accounts receivable, net of allowance for doubtful accounts | | 6,782 | | | 7,659 | |
| Inventories | | 8,427 | | | 8,744 | |
| | | | |
| Assets held for sale | | 5,400 | | | — | |
| Other current assets | | 2,745 | | | 1,713 | |
| Total current assets | | 47,249 | | | 31,239 | |
| | | | |
| Property, plant and equipment, net | | 56,584 | | | 55,386 | |
| Equity investments | | 5,152 | | | 3,967 | |
| Other long-term investments | | 2,192 | | | 3,276 | |
| Goodwill | | 26,971 | | | 26,276 | |
| Identified intangible assets, net | | 9,026 | | | 10,827 | |
| Other long-term assets | | 5,917 | | | 5,553 | |
| Total assets | | $ | 153,091 | | | $ | 136,524 | |
| | | | |
| Liabilities, temporary equity, and stockholders' equity | | | | |
| Current liabilities: | | | | |
| Short-term debt | | $ | 2,504 | | | $ | 3,693 | |
| Accounts payable | | 5,581 | | | 4,128 | |
| Accrued compensation and benefits | | 3,999 | | | 3,853 | |
| | | | |
| | | | |
| | | | |
| Other accrued liabilities | | 12,670 | | | 10,636 | |
| Total current liabilities | | 24,754 | | | 22,310 | |
| | | | |
| Debt | | 33,897 | | | 25,308 | |
| Contract liabilities | | 1,367 | | | 1,368 | |
| Income taxes payable | | 4,578 | | | 4,919 | |
| Deferred income taxes | | 3,843 | | | 2,044 | |
| Other long-term liabilities | | 3,614 | | | 2,916 | |
| Commitments and Contingencies (Note 19) | | | | |
| Temporary equity | | — | | | 155 | |
| Stockholders' equity: | | | | |
| Preferred stock, $0.001 par value, 50 shares authorized; none issued | | — | | | — | |
| Common stock, $0.001 par value, 10,000 shares authorized; 4,062 shares issued and outstanding (4,290 issued and outstanding in 2019) and capital in excess of par value | | 25,556 | | | 25,261 | |
| Accumulated other comprehensive income (loss) | | (751) | | | (1,280) | |
| Retained earnings | | 56,233 | | | 53,523 | |
| Total stockholders' equity | | 81,038 | | | 77,504 | |
| Total liabilities, temporary equity, and stockholders' equity | | $ | 153,091 | | | $ | 136,524 | |
See accompanying notes.
| | | | | | | | | | | |
| Financial Statements | Consolidated Balance Sheets | 76 |
| | | | | |
| Consolidated Statements of Cash Flows | |
| |
| | | | | | | | | | | | | | | | | | | | |
| Years Ended (In Millions) | | Dec 26, 2020 | | Dec 28, 2019 | | Dec 29, 2018 |
| Cash and cash equivalents, beginning of period | | $ | 4,194 | | | $ | 3,019 | | | $ | 3,433 | |
| Cash flows provided by (used for) operating activities: | | | | | | |
| Net income | | 20,899 | | | 21,048 | | | 21,053 | |
| Adjustments to reconcile net income to net cash provided by operating activities: | | | | | | |
| Depreciation | | 10,482 | | | 9,204 | | | 7,520 | |
| Share-based compensation | | 1,854 | | | 1,705 | | | 1,546 | |
| | | | | | |
| | | | | | |
| Amortization of intangibles | | 1,757 | | | 1,622 | | | 1,565 | |
| (Gains) losses on equity investments, net | | (1,757) | | | (892) | | | 155 | |
| | | | | | |
| (Gains) losses on divestitures | | (30) | | | (690) | | | (497) | |
| | | | | | |
| Changes in assets and liabilities: | | | | | | |
| Accounts receivable | | 883 | | | (935) | | | (1,714) | |
| Inventories | | (687) | | | (1,481) | | | (214) | |
| Accounts payable | | 412 | | | 696 | | | 211 | |
| Accrued compensation and benefits | | 463 | | | 91 | | | (260) | |
| Prepaid supply agreements | | (181) | | | (782) | | | 1,367 | |
| Income taxes | | 1,620 | | | 885 | | | (1,601) | |
| Other assets and liabilities | | (331) | | | 2,674 | | | 301 | |
| Total adjustments | | 14,485 | | | 12,097 | | | 8,379 | |
| Net cash provided by operating activities | | 35,384 | | | 33,145 | | | 29,432 | |
| Cash flows provided by (used for) investing activities: | | | | | | |
| Additions to property, plant and equipment | | (14,259) | | | (16,213) | | | (15,181) | |
| Additions to held for sale NAND property, plant and equipment | | (194) | | | — | | | — | |
| Acquisitions, net of cash acquired | | (837) | | | (1,958) | | | (190) | |
| Purchases of available-for-sale debt investments | | (6,862) | | | (2,268) | | | (3,843) | |
| | | | | | |
| Maturities and sales of available-for-sale debt investments | | 6,781 | | | 4,226 | | | 3,163 | |
| Purchases of trading assets | | (22,377) | | | (9,162) | | | (9,503) | |
| Maturities and sales of trading assets | | 15,377 | | | 7,178 | | | 12,111 | |
| | | | | | |
| | | | | | |
| Purchases of equity investments | | (720) | | | (522) | | | (874) | |
| Sales of equity investments | | 910 | | | 2,688 | | | 2,802 | |
| | | | | | |
| Proceeds from divestitures | | 123 | | | 911 | | | 548 | |
| Other investing | | 1,262 | | | 715 | | | (272) | |
| Net cash used for investing activities | | (20,796) | | | (14,405) | | | (11,239) | |
| Cash flows provided by (used for) financing activities: | | | | | | |
| | | | | | |
| | | | | | |
| | | | | | |
| Issuance of term debt, net of issuance costs | | 10,247 | | | 3,392 | | | 423 | |
| Repayment of term debt and debt conversions | | (4,525) | | | (2,627) | | | (3,026) | |
| Proceeds from sales of common stock through employee equity incentive plans | | 897 | | | 750 | | | 555 | |
| Repurchase of common stock | | (14,229) | | | (13,576) | | | (10,730) | |
| | | | | | |
| | | | | | |
| Payment of dividends to stockholders | | (5,568) | | | (5,576) | | | (5,541) | |
| | | | | | |
| | | | | | |
| | | | | | |
| Other financing | | 261 | | | 72 | | | (288) | |
| Net cash provided by (used for) financing activities | | (12,917) | | | (17,565) | | | (18,607) | |
| | | | | | |
| Net increase (decrease) in cash and cash equivalents | | 1,671 | | | 1,175 | | | (414) | |
| Cash and cash equivalents, end of period | | $ | 5,865 | | | $ | 4,194 | | | $ | 3,019 | |
| Supplemental disclosures: | | | | | | |
| Acquisition of property, plant and equipment included in accounts payable and accrued liabilities | | 2,973 | | | $ | 1,761 | | | $ | 2,340 | |
| | | | | | |
| | | | | | |
| Cash paid during the year for: | | | | | | |
| Interest, net of capitalized interest | | 594 | | | $ | 469 | | | $ | 448 | |
| Income taxes, net of refunds | | 2,436 | | | $ | 2,110 | | | $ | 3,813 | |
See accompanying notes.
| | | | | | | | | | | |
| Financial Statements | Consolidated Statements of Cash Flows | 77 |
| | | | | |
| Consolidated Statements of Stockholders' Equity | |
| |
| | | | | | | | | | | | | | | | | | | | | | | | | | | | | | | | |
| | Common Stock and Capital
in Excess of Par Value | | Accumulated
Other
Comprehensive
Income (Loss) | | Retained
Earnings | | Total |
| (In Millions, Except Per Share Amounts) | | Number of
Shares | | Amount | |
| | | | | | | | | | |
| | | | | | | | | | |
Balance as of December 31, 20171 | | 4,687 | | | $ | 26,074 | | | $ | (928) | | | $ | 44,507 | | | $ | 69,653 | |
| Components of comprehensive income, net of tax: | | | | | | | | | | |
| Net income | | — | | | — | | — | | 21,053 | | | 21,053 | |
| Other comprehensive income (loss) | | — | | | — | | (46) | | | — | | (46) | |
| Total comprehensive income | | | | | | | | | | 21,007 | |
Employee equity incentive plans and other2 | | 56 | | | 424 | | | — | | — | | 424 | |
| Share-based compensation | | — | | | 1,548 | | | — | | — | | 1,548 | |
| Temporary equity reduction | | — | | | 447 | | | — | | — | | 447 | |
| Convertible debt | | — | | | (1,591) | | | — | | — | | (1,591) | |
| Repurchase of common stock | | (217) | | | (1,208) | | | — | | (9,650) | | | (10,858) | |
| Restricted stock unit withholdings | | (10) | | | (329) | | | — | | (197) | | | (526) | |
| Cash dividends declared ($1.20 per share of common stock) | | — | | | — | | — | | (5,541) | | | (5,541) | |
| Balance as of December 29, 2018 | | 4,516 | | | 25,365 | | | (974) | | | 50,172 | | | 74,563 | |
| Components of comprehensive income, net of tax: | | | | | | | | | | |
| Net income | | — | | | — | | — | | 21,048 | | | 21,048 | |
| Other comprehensive income (loss) | | — | | | — | | (306) | | | — | | (306) | |
| Total comprehensive income | | | | | | | | | | 20,742 | |
| Employee equity incentive plans and other | | 55 | | | 892 | | | — | | — | | | 892 | |
| Share-based compensation | | — | | | 1,705 | | | — | | — | | 1,705 | |
| Temporary equity reduction | | — | | | 265 | | | — | | | — | | 265 | |
| Convertible debt | | — | | | (1,032) | | | — | | — | | (1,032) | |
| Repurchase of common stock | | (272) | | | (1,592) | | | — | | (11,973) | | | (13,565) | |
| Restricted stock unit withholdings | | (9) | | | (342) | | | — | | (146) | | | (488) | |
| Cash dividends declared ($1.26 per share of common stock) | | — | | | — | | — | | (5,578) | | | (5,578) | |
| Balance as of December 28, 2019 | | 4,290 | | | 25,261 | | | (1,280) | | | 53,523 | | | 77,504 | |
| | | | | | | | | | |
| | | | | | | | | | |
| Components of comprehensive income, net of tax: | | | | | | | | | | |
| Net income | | — | | | — | | — | | 20,899 | | | 20,899 | |
| Other comprehensive income (loss) | | — | | | — | | 529 | | | — | | 529 | |
| Total comprehensive income | | | | | | | | | | 21,428 | |
| Employee equity incentive plans and other | | 55 | | | 1,018 | | | — | | — | | | 1,018 | |
| Share-based compensation | | — | | | 1,854 | | | — | | — | | 1,854 | |
| Temporary equity reduction | | — | | | 155 | | | — | | — | | 155 | |
| Convertible debt | | — | | | (750) | | | — | | — | | (750) | |
| Repurchase of common stock | | (275) | | | (1,628) | | | — | | (12,481) | | | (14,109) | |
| Restricted stock unit withholdings | | (8) | | | (354) | | | — | | (140) | | | (494) | |
| Cash dividends declared ($1.32 per share of common stock) | | — | | | — | | — | | (5,568) | | | (5,568) | |
| Balance as of December 26, 2020 | | 4,062 | | | $ | 25,556 | | | $ | (751) | | | $ | 56,233 | | | $ | 81,038 | |
1Balances as of December 31, 2017 include opening balance adjustments made as a result of changes in accounting principle due to the adoption of new accounting standards in 2018.
2Includes approximately $375 million of non-controlling interest activity due to our acquisition of Mobileye in 2017, which was eliminated in 2018 due to purchase of remaining shares.
See accompanying notes.
| | | | | | | | | | | |
| Financial Statements | Consolidated Statements of Stockholders' Equity | 78 |
| | | | | |
| Notes to Consolidated Financial Statements | |
| |
| | | | | |
| Note 1 : | Basis of Presentation |
We have a 52- or 53-week fiscal year that ends on the last Saturday in December. Fiscal years 2020, 2019, and 2018 were 52-week fiscal years. Our Consolidated Financial Statements include the accounts of Intel and our subsidiaries. We have eliminated intercompany accounts and transactions. We have reclassified certain prior period amounts to conform to current period presentation.
Use of Estimates
The preparation of Consolidated Financial Statements in conformity with U.S. GAAP requires us to make estimates and judgments that affect the amounts reported in our Consolidated Financial Statements and the accompanying notes. The inputs into our judgments and estimates consider the economic implications of COVID-19 on our critical and significant accounting estimates. The actual results that we experience may differ materially from our estimates.
| | | | | |
| Note 2 : | Accounting Policies |
Revenue Recognition
We recognize net product revenue when we satisfy performance obligations as evidenced by the transfer of control of our products or services to customers. Substantially all of our revenue is derived from product sales. In accordance with contract terms, revenue for product sales is recognized at the time of product shipment from our facilities or delivery to the customer location, as determined by the agreed upon shipping terms.
We measure revenue based on the amount of consideration we expect to be entitled to in exchange for products or services. Variable consideration is estimated and reflected as an adjustment to the transaction price. We determine variable consideration, which consists primarily of various sales price concessions, by estimating the most likely amount of consideration we expect to receive from the customer based on historical analysis of customer purchase volumes. Sales rebates earned by customers are offset against their receivable balances. Rebates earned by customers when they do not have outstanding receivable balances are recorded within other accrued liabilities.
We make payments to our customers through cooperative advertising programs for marketing activities for some of our products. We generally record the payment as a reduction in revenue in the period that the revenue is earned, unless the payment is for a distinct service, which we record as expense when the marketing activities occur.
Inventories
We compute inventory cost on a first-in, first-out basis. Our process and product development life cycle corresponds with substantive engineering milestones. These engineering milestones are regularly and consistently applied in assessing the point at which our activities and associated costs change in nature from R&D to cost of sales, and when cost of sales can be capitalized as inventory.
For a product to be manufactured in high volumes and sold to our customers under our standard warranty, it must meet our rigorous technical quality specifications. This milestone is known as PRQ. We have identified PRQ as the point at which the costs incurred to manufacture our products are included in the valuation of inventory. A single PRQ has previously valued inventory up to $870 million in the quarter the PRQ milestone was achieved. Prior to PRQ, costs that do not meet the criteria for R&D are included in cost of sales in the period incurred.
The valuation of inventory includes determining which fixed production overhead costs can be included in inventory based on the normal capacity of our manufacturing and assembly and test facilities. We apply our historical loadings compared to our total available capacity in a statistical model to determine our normal capacity level. If the factory loadings are below the established normal capacity level, a portion of our fixed production overhead costs would not be included in the cost of inventory; instead, it would be recognized as cost of sales in that period. We refer to these costs as excess capacity charges. Excess capacity charges are insignificant in the years presented. Charges in years prior to those presented have ranged up to $1.1 billion taken in connection with the 2009 economic recession.
Inventory is valued at the lower of cost or net realizable value, based upon assumptions about future demand and market conditions. Product-specific facts and circumstances reviewed in the inventory valuation process include a review of our customer base, the stage of the product life cycle, variations in market pricing, and an assessment of selling price in relation to product cost. Lower of cost or net realizable value inventory reserves fluctuate as we ramp new process technologies with costs improving over time due to scale and improved yields. Additionally, inventory valuation is impacted by cyclical changes in market conditions and the associated pricing environment.
| | | | | | | | | | | |
| Financial Statements | Notes to Consolidated Financial Statements | 79 |
The valuation of inventory also requires us to estimate obsolete and excess inventory, as well as inventory that is not of salable quality. We use the demand forecast to develop our short-term manufacturing plans to enable consistency between inventory valuations and build decisions. For certain new products, we have limited historical data when developing these demand forecasts. We compare the estimate of future demand to work in process and finished goods inventory levels to determine the amount, if any, of obsolete or excess inventory. When our demand forecast for specific products is greater than actual demand and we fail to reduce manufacturing output accordingly, we write off amounts considered to be excess inventory.
Property, Plant and Equipment
We compute depreciation using the straight-line method over the estimated useful life of assets. We also capitalize interest on borrowings related to eligible capital expenditures. Capitalized interest is added to the cost of qualified assets and depreciated together with that asset cost. We record capital-related government grants earned as a reduction to property, plant and equipment.
We evaluate the period over which we expect to recover the economic value of our property, plant and equipment, considering factors such as the process technology cadence between node transitions, changes in machinery and equipment technology, and re-use of machinery and tools across each generation of process technology. As we make manufacturing process conversions and other factory planning decisions, we use assumptions involving the use of management judgments regarding the remaining useful lives of assets, primarily process-specific semiconductor manufacturing tools and building improvements. When we determine that the useful lives of assets are shorter or longer than we had originally estimated, we adjust the rate of depreciation to reflect the assets' revised useful lives.
Assets are "grouped" and evaluated for impairment at the lowest level of identifiable cash flows. Factors that we consider in deciding when to perform an impairment review include significant under-performance of a business or product line in relation to expectations, significant negative industry or economic trends, and significant changes or planned changes in our use and fungibility of the assets. If an asset grouping carrying value is not recoverable through the related undiscounted cash flows, the asset grouping is considered to be impaired.
Fair Value
When determining fair value, we consider the principal or most advantageous market in which we would transact, as well as assumptions that market participants would use when pricing the asset or liability. Our financial assets are measured and recorded at fair value on a recurring basis, except for equity securities measured using the measurement alternative, equity method investments, grants receivable, and reverse repurchase agreements with original maturities greater than three months. We assess fair value hierarchy levels for our issued debt and fixed-income investment portfolio based on the underlying instrument type.
The three levels of inputs that may be used to measure fair value are:
▪Level 1. Quoted prices in active markets for identical assets or liabilities. We evaluate security-specific market data when determining whether a market is active.
▪Level 2. Observable inputs other than Level 1 prices, such as quoted prices for similar assets or liabilities, quoted prices in less active markets, or model-derived valuations. All significant inputs used in our valuations, such as discounted cash flows, are observable or can be derived principally from or corroborated with observable market data for substantially the full term of the assets or liabilities. We use LIBOR-based yield curves, overnight indexed swap curves, currency spot and forward rates, and credit ratings as significant inputs in our valuations. Level 2 inputs also include non-binding market consensus prices, as well as quoted prices that were adjusted for security-specific restrictions. When we use non-binding market consensus prices, we corroborate them with quoted market prices for similar instruments or compare them to output from internally developed pricing models such as discounted cash flow models.
▪Level 3. Unobservable inputs to the valuation methodology that are significant to the measurement of the fair value of assets or liabilities. We monitor and review the inputs and results of these valuation models to help ensure the fair value measurements are reasonable and consistent with market experience in similar asset classes. Level 3 inputs also include non-binding market consensus prices or non-binding broker quotes that we were unable to corroborate with observable market data.
Debt Investments
We consider all highly liquid debt investments with original maturities from the date of purchase of three months or less as cash equivalents. Cash equivalents can include investments such as corporate debt, financial institution instruments, government debt, and reverse repurchase agreements.
Marketable debt investments are generally designated as trading assets when a market risk is economically hedged at inception with a related derivative instrument, or when the marketable debt investment itself is used to economically hedge currency exchange rate risk from remeasurement. Investments designated as trading assets are reported at fair value. Gains or losses on these investments arising from changes in fair value due to interest rate and currency market fluctuations and credit market volatility, largely offset by losses or gains on the related derivative instruments and balance sheet remeasurement, are recorded in interest and other, net.
| | | | | | | | | | | |
| Financial Statements | Notes to Consolidated Financial Statements | 80 |
Marketable debt investments are considered available-for-sale investments when the interest rate and foreign currency risks are not hedged at the inception of the investment or when our criteria for designation as trading assets are not met. Available-for-sale debt investments with original maturities of approximately three months or less from the date of purchase are classified within cash and cash equivalents. Available-for-sale debt investments with original maturities at the date of purchase greater than approximately three months and remaining maturities of less than one year are classified as short-term investments. Available-for-sale debt investments with remaining maturities beyond one year are classified as other long-term investments. Available-for-sale debt investments are reported at fair value, with unrealized gains or losses, net of tax, recorded in accumulated other comprehensive income (loss). We determine the cost of the investment sold based on an average cost basis at the individual security level, and record the interest income and realized gains or losses on the sale of these investments in interest and other, net.
Our available-for-sale debt investments are subject to periodic impairment reviews. For investments in an unrealized loss position, we determine whether a credit loss exists by considering information about the collectability of the instrument, current market conditions, and reasonable and supportable forecasts of economic conditions. We recognize an allowance for credit losses, up to the amount of the unrealized loss when appropriate, and write down the amortized cost basis of the investment if it is more likely than not we will be required or we intend to sell the investment before recovery of its amortized cost basis. Allowances for credit losses and write-downs are recognized in interest and other, net, and unrealized losses not related to credit losses are recognized in other comprehensive income (loss).
Equity Investments
We regularly invest in equity securities of public and private companies to promote business and strategic objectives. Equity investments are measured and recorded as follows:
▪Marketable equity securities are equity securities with RDFV that are measured and recorded at fair value on a recurring basis with changes in fair value, whether realized or unrealized, recorded through the income statement.
▪Non-marketable equity securities are equity securities without RDFV that are measured and recorded using a measurement alternative that measures the securities at cost minus impairment, if any, plus or minus changes resulting from qualifying observable price changes.
▪Equity method investments are equity securities in investees we do not control but over which we have the ability to exercise significant influence. Equity method investments are measured at cost minus impairment, if any, plus or minus our share of equity method investee income or loss. Our proportionate share of the income or loss from equity method investments is recognized on a one-quarter lag.
Realized and unrealized gains and losses resulting from changes in fair value or the sale of our equity investments are recorded in gains (losses) on equity investments, net. The carrying value of our non-marketable equity securities is adjusted for qualifying observable price changes resulting from the issuance of similar or identical securities in an orderly transaction by the same issuer. Determining whether an observed transaction is similar to a security within our portfolio requires judgment based on the rights and preferences of the securities. Recording upward and downward adjustments to the carrying value of our equity securities as a result of observable price changes requires quantitative assessments of the fair value of our securities using various valuation methodologies and involves the use of estimates.
Non-marketable equity securities and equity method investments (collectively referred to as non-marketable equity investments) are also subject to periodic impairment reviews. Our quarterly impairment analysis considers both qualitative and quantitative factors that may have a significant impact on the investee's fair value. Qualitative factors considered include the investee's financial condition and business outlook, industry and sector performance, market for technology, operational and financing cash flow activities, and other relevant events and factors affecting the investee. When indicators of impairment exist, we prepare quantitative assessments of the fair value of our non-marketable equity investments using both the market and income approaches, which require judgment and the use of estimates, including discount rates, investee revenue and costs, and comparable market data of private and public companies, among others.
▪Non-marketable equity securities are tested for impairment using a qualitative model similar to the model used for goodwill and long-lived assets. Upon determining that an impairment may exist, the security's fair value is calculated and compared to its carrying value and an impairment is recognized immediately if the carrying value exceeds the fair value.
▪Equity method investments are subject to periodic impairment reviews using the other-than-temporary impairment model, which considers the severity and duration of a decline in fair value below cost and our ability and intent to hold the investment for a sufficient period of time to allow for recovery.
Impairments of equity investments are recorded in gains (losses) on equity investments, net.
| | | | | | | | | | | |
| Financial Statements | Notes to Consolidated Financial Statements | 81 |
Derivative Financial Instruments
Our primary objective for holding derivative financial instruments is to manage currency exchange rate risk and interest rate risk, and, to a lesser extent, equity market risk, commodity price risk, and credit risk. We enter into master netting arrangements to mitigate credit risk in derivative transactions by permitting net settlement of transactions with the same counterparty. We also enter into collateral security arrangements with certain of our counterparties to exchange cash collateral when the net fair value of certain derivative instruments fluctuates from contractually established thresholds. For presentation on our Consolidated Balance Sheets, we do not offset fair value amounts recognized for derivative instruments under master netting arrangements. Our derivative financial instruments, including related collateral amounts, are presented at fair value on a gross basis and are included in other current assets, other long-term assets, other accrued liabilities, or other long-term liabilities.
Cash flow hedges use foreign currency contracts, such as currency forwards and currency interest rate swaps, to hedge exposures for variability in the U.S.-dollar equivalent of non-U.S.-dollar-denominated cash flows associated with our forecasted operating and capital purchases spending.
The after-tax gains or losses from the effective portion of a cash flow hedge is reported as a component of accumulated other comprehensive income (loss) and reclassified into earnings in the same period or periods in which the hedged transaction affects earnings, and in the same line item on the Consolidated Statements of Income as the impact of the hedge transaction. For foreign currency contracts hedging our capital purchases, forward points are excluded from the hedge effectiveness assessment, and are recognized in earnings in the same income statement line item used to present the earnings effect of the hedged item. If the cash flow hedge transactions become improbable, the corresponding amounts deferred in accumulated other comprehensive income (loss) would be immediately reclassified to interest and other, net. These derivatives are classified in the Consolidated Statements of Cash Flows in the same section as the underlying item.
Fair value hedges use interest rate contracts, such as interest rate swaps, to hedge against changes in the fair value on certain of our fixed-rate indebtedness attributable to changes in the benchmark interest rate. The gains or losses on these hedges, as well as the offsetting losses or gains related to the changes in the fair value of the underlying hedged item attributable to the hedged risk, are recognized in earnings in the current period, primarily in interest and other, net. These derivatives are classified in the Consolidated Statements of Cash Flows in the same section as the underlying item, primarily within cash flows from financing activities.
Non-designated hedges use foreign currency contracts to economically hedge the functional currency equivalent cash flows of recognized monetary assets and liabilities, non-U.S.-dollar-denominated debt instruments classified as trading assets, and non-U.S.-dollar-denominated loans receivables recognized at fair value. We also use interest rate contracts to hedge interest rate risk related to our U.S.-dollar-denominated fixed-rate debt instruments classified as trading assets. The change in fair value of these derivatives is recorded through earnings in the line item on the Consolidated Statements of Income to which the derivatives most closely relate, primarily in interest and other, net. Changes in the fair value of the underlying assets and liabilities associated with the hedged risk are generally offset by the changes in the fair value of the related derivatives.
Loans Receivable
We elect the fair value option when the interest rate or foreign currency exchange rate risk is economically hedged at the inception of the loan with a related derivative instrument. When the fair value option is not elected, the loans are carried at amortized cost. We measure interest income for all loans receivable using the interest method, which is based on the effective yield of the loans rather than the stated coupon rate. We classify our loans within other current and long-term assets.
Credit Risk
Financial instruments that potentially subject us to concentrations of credit risk consist principally of investments in debt instruments, derivative financial instruments, loans receivable, reverse repurchase agreements, and trade receivables. We generally place investments with high-credit-quality counterparties and, by policy, we limit the amount of credit exposure to any one counterparty based on our analysis of that counterparty's relative credit standing. As required per our investment policy, substantially all of our investments in debt instruments and financing receivables are in investment-grade instruments. Credit-rating criteria for derivative instruments are similar to those for other investments.
We enter into master netting arrangements to mitigate credit risk in derivative transactions by permitting net settlement of transactions with the same counterparty. Due to master netting arrangements, the amounts subject to credit risk related to derivative instruments are generally limited to the amounts, if any, by which the counterparty's obligations exceed our obligations with that counterparty. As of December 26, 2020, our total credit exposure to any single counterparty, excluding money market funds invested in U.S. treasury and U.S. agency securities and reverse repurchase agreements collateralized by treasury and agency securities, did not exceed $2.0 billion. To further reduce credit risk, we enter into collateral security arrangements with certain of our derivative counterparties and obtain and secure collateral from counterparties against obligations, including securities lending transactions when we deem it appropriate. Cash collateral exchanged under our collateral security arrangements are included in other current assets, other long-term assets, other accrued liabilities, or other long-term liabilities. For reverse repurchase agreements collateralized by other securities, we do not record the collateral as an asset or a liability unless the collateral is repledged.
| | | | | | | | | | | |
| Financial Statements | Notes to Consolidated Financial Statements | 82 |
A substantial majority of our trade receivables are derived from sales to OEMs and ODMs. We also have accounts receivable derived from sales to industrial and communications equipment manufacturers in the computing and communications industries. We believe the net accounts receivable balances from our three largest customers (43% as of December 26, 2020) do not represent a significant credit risk, based on cash flow forecasts, balance sheet analysis, and past collection experience.
We have adopted credit policies and standards intended to accommodate industry growth and inherent risk. We believe credit risks are moderated by the financial stability of our major customers. We assess credit risk through quantitative and qualitative analysis. From this analysis, we establish shipping and credit limits, and determine whether we will seek to use one or more credit support protection devices, such as obtaining a parent guarantee, standby letter of credit, or credit insurance.
Business Combinations
We allocate the purchase price paid for assets acquired and liabilities assumed in connection with our acquisitions based on their estimated fair values at the time of acquisition. This allocation involves a number of assumptions, estimates, and judgments in determining the fair value of the following:
▪intangible assets, including the valuation methodology, estimations of future cash flows, discount rates, market segment growth rates, and our assumed market segment share, as well as the estimated useful life of intangible assets;
▪deferred tax assets and liabilities, uncertain tax positions, and tax-related valuation allowances, which are initially estimated as of the acquisition date;
▪inventory; property, plant and equipment; pre-existing liabilities or legal claims; deferred revenue; and contingent consideration, each as may be applicable; and
▪goodwill as measured as the excess of consideration transferred over the net of the acquisition date fair values of the assets acquired and the liabilities assumed.
Our assumptions and estimates are based upon comparable market data and information obtained from our management and the management of the acquired companies. We allocate goodwill to the reporting units of the business that are expected to benefit from the business combination.
Goodwill
We perform an annual impairment assessment of goodwill at the reporting unit level in the fourth quarter of each year, or more frequently if indicators of potential impairment exist. The analysis may include both qualitative and quantitative factors to assess the likelihood of an impairment. The reporting unit's carrying value used in an impairment test represents the assignment of various assets and liabilities, excluding certain corporate assets and liabilities, such as cash, investments, and debt.
Qualitative factors include industry and market considerations, overall financial performance, and other relevant events and factors affecting the reporting unit. Additionally, as part of this assessment, we may perform a quantitative analysis to support the qualitative factors above by applying sensitivities to assumptions and inputs used in measuring a reporting unit's fair value.
Our quantitative impairment test considers both the income approach and the market approach to estimate a reporting unit's fair value. Significant estimates include market segment growth rates, our assumed market segment share, estimated costs, and discount rates based on a reporting unit's weighted average cost of capital.
We test the reasonableness of the inputs and outcomes of our discounted cash flow analysis against available market data. In the current year, the fair value for all of our reporting units substantially exceeds their carrying value, and our annual qualitative assessment did not indicate that a more detailed quantitative analysis was necessary.
Identified Intangible Assets
We amortize acquisition-related intangible assets that are subject to amortization over their estimated useful life. Acquisition-related in-process R&D assets represent the fair value of incomplete R&D projects that had not reached technological feasibility as of the date of acquisition; initially, these are classified as in-process R&D and are not subject to amortization. Once these R&D projects are completed, the asset balances are transferred from in-process R&D to acquisition-related developed technology and are subject to amortization from this point forward. The asset balances relating to projects that are abandoned after acquisition are impaired and expensed to R&D.
We perform a quarterly review of significant finite-lived identified intangible assets to determine whether facts and circumstances indicate that the carrying amount may not be recoverable. These reviews can be affected by various factors, including external factors such as industry and economic trends, and internal factors such as changes in our business strategy and our forecasts for specific product lines.
Employee Equity Incentive Plans
We use the straight-line amortization method to recognize share-based compensation expense over the service period of the award, net of estimated forfeitures. Upon exercise, cancellation, forfeiture, or expiration of stock options, or upon vesting or forfeiture of RSUs, we eliminate deferred tax assets for options and RSUs with multiple vesting dates for each vesting period on a first-in, first-out basis as if each vesting period were a separate award.
| | | | | | | | | | | |
| Financial Statements | Notes to Consolidated Financial Statements | 83 |
Income Taxes
We compute the provision for income taxes using the asset and liability method, under which deferred tax assets and liabilities are recognized for the expected future tax consequences of temporary differences between the financial reporting and tax bases of assets and liabilities, and for operating losses and tax credit carryforwards. We measure deferred tax assets and liabilities using the currently enacted tax rates that apply to taxable income in effect for the years in which those tax assets are expected to be realized or settled.
We assess the likelihood that we will be able to recover our deferred tax assets. If recovery is not likely, we must increase our provision for taxes by recording a valuation allowance against the deferred tax assets that we estimate will not ultimately be recoverable. We believe that we will ultimately recover the deferred tax assets recorded on our Consolidated Balance Sheets. Recovery of a portion of our deferred tax assets is affected by management's plans with respect to holding or disposing of certain investments; therefore, such changes could also affect our future provision for taxes.
We recognize tax benefits from uncertain tax positions only if (based on the technical merits of the position) it is more likely than not that the tax positions will be sustained on examination by the tax authority. The tax benefits recognized in the financial statements from such positions are measured based on the largest amount that is more than 50% likely to be realized upon ultimate settlement. We recognize interest and penalties related to unrecognized tax benefits within the provision for taxes on the Consolidated Statements of Income.
We recognize the tax impact of including certain foreign earnings in U.S. taxable income as a period cost. We have recognized deferred income taxes for local country income and withholding taxes that could be incurred on distributions of certain non-U.S. earnings or for outside basis differences in our subsidiaries, because we do not plan to indefinitely reinvest such earnings and basis differences. Remittances of non-U.S. earnings are based on estimates and judgments of projected cash flow needs, as well as the working capital and investment requirements of our non-U.S. and U.S. operations. Material changes in our estimates of cash, working capital, and investment needs in various jurisdictions could require repatriation of indefinitely reinvested non-U.S. earnings, which could be subject to applicable non-U.S. income and withholding taxes.
Leases
Leases primarily consist of real property, and, to a lesser extent, certain machinery and equipment. Our lease terms may include options to extend when it is reasonably certain that we will exercise that option. We have lease agreements with lease and non-lease components, and the non-lease components are accounted for separately and not included in our leased assets and corresponding liabilities. Payments on leases may be fixed or variable, and variable lease payments are based on output of the underlying leased assets.
Loss Contingencies
We are subject to loss contingencies, including various legal and regulatory proceedings, asserted and potential claims, liabilities related to repair or replacement of parts in connection with product defects, as well as product warranties and potential asset impairments that arise in the ordinary course of business. An estimated loss from such contingencies is recognized as a charge to income if it is probable that a liability has been incurred and the amount of the loss can be reasonably estimated.
| | | | | |
| Note 3 : | Operating Segments |
We manage our business through the following operating segments:
▪DCG
▪IOTG
▪Mobileye
▪NSG
▪PSG
▪CCG
We derive a substantial majority of our revenue from platform products, which are our principal products and considered as one class of product. We offer platform products that incorporate various components and technologies, including a microprocessor and chipset, a stand-alone SoC, or a multichip package, based on Intel architecture. Platform products are used in various form factors across our DCG, IOTG, and CCG operating segments. Our non-platform, or adjacent, products can be combined with platform products to form comprehensive platform solutions to meet customer needs.
DCG and CCG are our reportable operating segments. IOTG, Mobileye, NSG, and PSG do not meet the quantitative thresholds to qualify as reportable operating segments; however, we have elected to disclose the results of these non-reportable operating segments. Our Internet of Things portfolio, presented as Internet of Things, is comprised of the IOTG and Mobileye operating segments. Beginning with the first quarter of 2021, we expect our DCG operating segment to include the results of our Intel Optane memory business, and our NSG segment will be composed of our NAND memory business.
We have sales and marketing, manufacturing, engineering, finance, and administration groups. Expenses for these groups are generally allocated to the operating segments.
| | | | | | | | | | | |
| Financial Statements | Notes to Consolidated Financial Statements | 84 |
We have an "all other" category that includes revenue, expenses, and charges such as:
▪results of operations from non-reportable segments not otherwise presented;
▪historical results of operations from divested businesses;
▪results of operations of start-up businesses that support our initiatives, including our foundry business;
▪amounts included within restructuring and other charges;
▪a portion of employee benefits, compensation, and other expenses not allocated to the operating segments; and
▪acquisition-related costs, including amortization and any impairment of acquisition-related intangibles and goodwill.
The CODM, who is our CEO, allocates resources to and assesses the performance of each operating segment using information about the operating segment's revenue and operating income (loss). The CODM does not evaluate operating segments using discrete asset information and we do not identify or allocate assets by operating segments. Based on the interchangeable nature of our manufacturing and assembly and test assets, most of the related depreciation expense is not directly identifiable within our operating segments, as it is included in overhead cost pools and subsequently absorbed into inventory as each product passes through our manufacturing process. Because our products are then sold across multiple operating segments, it is impracticable to determine the total depreciation expense included as a component of each operating segment's operating income (loss) results. Operating segments do not record inter-segment revenue. We do not allocate gains and losses from equity investments, interest and other income, or taxes to operating segments. Although the CODM uses operating income to evaluate the segments, operating costs included in one segment may benefit other segments. The accounting policies for segment reporting are the same as for Intel as a whole.
Net revenue and operating income (loss) for each period were as follows:
| | | | | | | | | | | | | | | | | | | | |
| Years Ended (In Millions) | | Dec 26, 2020 | | Dec 28, 2019 | | Dec 29, 2018 |
| Net revenue: | | | | | | |
| Data Center Group | | | | | | |
| Platform | | $ | 23,056 | | | $ | 21,441 | | | $ | 21,155 | |
| Adjacent | | 3,047 | | | 2,040 | | | 1,836 | |
| | 26,103 | | | 23,481 | | | 22,991 | |
| Internet of Things | | | | | | |
| IOTG | | 3,007 | | | 3,821 | | | 3,455 | |
| Mobileye | | 967 | | | 879 | | | 698 | |
| | 3,974 | | | 4,700 | | | 4,153 | |
| | | | | | |
| Non-Volatile Memory Solutions Group | | 5,358 | | | 4,362 | | | 4,307 | |
| Programmable Solutions Group | | 1,853 | | | 1,987 | | | 2,123 | |
| Client Computing Group | | | | | | |
| Platform | | 35,642 | | | 32,681 | | | 33,234 | |
| Adjacent | | 4,415 | | | 4,465 | | | 3,770 | |
| | 40,057 | | | 37,146 | | | 37,004 | |
| All other | | 522 | | | 289 | | | 270 | |
| Total net revenue | | $ | 77,867 | | | $ | 71,965 | | | $ | 70,848 | |
| | | | | | |
| Operating income (loss): | | | | | | |
| Data Center Group | | $ | 10,571 | | | $ | 10,227 | | | $ | 11,476 | |
| | | | | | |
| Internet of Things | | | | | | |
| IOTG | | 497 | | | 1,097 | | | 980 | |
| Mobileye | | 241 | | | 245 | | | 143 | |
| | 738 | | | 1,342 | | | 1,123 | |
| | | | | | |
| Non-Volatile Memory Solutions Group | | 361 | | | (1,176) | | | (5) | |
| Programmable Solutions Group | | 260 | | | 318 | | | 466 | |
| Client Computing Group | | 15,129 | | | 15,202 | | | 14,222 | |
| All other | | (3,381) | | | (3,878) | | | (3,966) | |
| Total operating income | | $ | 23,678 | | | $ | 22,035 | | | $ | 23,316 | |
| | | | | | | | | | | |
| Financial Statements | Notes to Consolidated Financial Statements | 85 |
Disaggregated net revenue for each period was as follows:
| | | | | | | | | | | | | | | | | | | | |
| Years Ended (In Millions) | | Dec 26, 2020 | | Dec 28, 2019 | | Dec 29, 2018 |
| Platform revenue | | | | | | |
| DCG platform | | $ | 23,056 | | | $ | 21,441 | | | $ | 21,155 | |
| IOTG platform | | 2,705 | | | 3,440 | | | 3,065 | |
| CCG desktop platform | | 10,692 | | | 11,822 | | | 12,220 | |
| CCG notebook platform | | 24,903 | | | 20,779 | | | 20,930 | |
CCG other platform1 | | 47 | | | 80 | | | 84 | |
| | 61,403 | | | 57,562 | | | 57,454 | |
| | | | | | |
Adjacent revenue2 | | 16,464 | | | 14,403 | | | 13,394 | |
| | | | | | |
| Total revenue | | $ | 77,867 | | | $ | 71,965 | | | $ | 70,848 | |
1 Includes our tablet and service provider revenue.
2 Includes all of our non-platform products for DCG, IOTG, and CCG, such as modem, Ethernet, and silicon photonics, as well as Mobileye, NSG, and PSG products.
In 2020, our three largest customers accounted for 39% of our net revenue (41% in 2019 and 39% in 2018), with Dell Inc. accounting for 17% (17% in 2019 and 16% in 2018), Lenovo Group Limited accounting for 12% (13% in 2019 and 12% in 2018), and HP Inc. accounting for 10% (11% in 2019 and 11% in 2018). These three customers accounted for 43% of our accounts receivable as of December 26, 2020 (39% as of December 28, 2019). Substantially all of the revenue from these customers was from the sale of platforms and other components by the CCG and DCG operating segments.
Net revenue by country, based on the billing location of the customer, was as follows:
| | | | | | | | | | | | | | | | | | | | |
| Years Ended (In Millions) | | Dec 26, 2020 | | Dec 28, 2019 | | Dec 29, 2018 |
| China (including Hong Kong) | | $ | 20,257 | | | $ | 20,026 | | | $ | 18,824 | |
| Singapore | | 17,845 | | | 15,650 | | | 15,409 | |
| United States | | 16,573 | | | 15,617 | | | 14,303 | |
| Taiwan | | 11,605 | | | 10,058 | | | 10,646 | |
| Other countries | | 11,587 | | | 10,614 | | | 11,666 | |
| Total net revenue | | $ | 77,867 | | | $ | 71,965 | | | $ | 70,848 | |
| | | | | |
| Note 4 : | Earnings Per Share |
| | | | | | | | | | | | | | | | | | | | |
| Years Ended (In Millions, Except Per Share Amounts) | | Dec 26, 2020 | | Dec 28, 2019 | | Dec 29, 2018 |
| Net income available to common stockholders | | $ | 20,899 | | | $ | 21,048 | | | $ | 21,053 | |
| Weighted average shares of common stock outstanding—basic | | 4,199 | | | 4,417 | | | 4,611 | |
| Dilutive effect of employee incentive plans | | 33 | | | 41 | | | 50 | |
| Dilutive effect of convertible debt | | — | | | 15 | | | 40 | |
| Weighted average shares of common stock outstanding—diluted | | 4,232 | | | 4,473 | | | 4,701 | |
| Earnings per share—basic | | $ | 4.98 | | | $ | 4.77 | | | $ | 4.57 | |
| Earnings per share—diluted | | $ | 4.94 | | | $ | 4.71 | | | $ | 4.48 | |
We computed diluted earnings per share of common stock based on the weighted average number of shares of common stock outstanding plus potentially dilutive shares of common stock outstanding during the period. Potentially dilutive shares of common stock from employee incentive plans are determined by applying the treasury stock method to the assumed exercise of outstanding stock options, the assumed vesting of outstanding RSUs, and the assumed issuance of common stock under the 2006 ESPP. In January 2020, we fully redeemed the remaining principal of our 2009 Debentures. We included our 2009 Debentures in the calculation of diluted earnings per share of common stock in 2019 and 2018 by applying the treasury stock method because the average market price was above the conversion price.
Securities that would have been anti-dilutive are insignificant and are excluded from the computation of diluted earnings per share in all periods presented.
| | | | | | | | | | | |
| Financial Statements | Notes to Consolidated Financial Statements | 86 |
| | | | | |
| Note 5 : | Contract Liabilities |
| | | | | | | | | | | | | | |
| (In Millions) | | Dec 26, 2020 | | Dec 28, 2019 |
Prepaid supply agreements
| | $ | 1,625 | | | $ | 1,805 | |
| | | | |
| Other | | 250 | | | 236 | |
| Total contract liabilities | | $ | 1,875 | | | $ | 2,041 | |
| | | | |
| | | | |
Contract liabilities are primarily related to prepayments received from customers on long-term prepaid supply agreements toward future NSG product delivery. The short-term portion of contract liabilities ($508 million as of December 26, 2020 and $673 million as of December 28, 2019) is reported on the Consolidated Balance Sheets within other accrued liabilities.
The following table shows the changes in contract liability balances relating to long-term prepaid supply agreements during 2020:
| | | | | | | | |
| (In Millions) | | |
| Prepaid supply agreements balance as of December 28, 2019 | | $ | 1,805 | |
| Additions | | 70 | |
| Prepaids utilized | | (250) | |
| Prepaid supply agreements balance as of December 26, 2020 | | $ | 1,625 | |
During the second quarter of 2020, we issued a contract termination notification for breach to our largest prepaid supply customer with a $1.6 billion contract liability balance. The timing and amount of future anticipated revenue or reversal of any contract liability balance resulting from contract termination may vary due to ongoing customer negotiations.
| | | | | |
| Note 6 : | Other Financial Statement Details |
Inventories
| | | | | | | | | | | | | | |
(In Millions) | | Dec 26, 2020 | | Dec 28, 2019 |
| Raw materials | | $ | 908 | | | $ | 840 | |
| Work in process | | 6,007 | | | 6,225 | |
| Finished goods | | 1,512 | | | 1,679 | |
| Total inventories | | $ | 8,427 | | | $ | 8,744 | |
Property, Plant and Equipment
| | | | | | | | | | | | | | |
| (In Millions) | | Dec 26, 2020 | | Dec 28, 2019 |
| Land and buildings | | $ | 37,536 | | | $ | 37,743 | |
| Machinery and equipment | | 79,384 | | | 74,901 | |
| Construction in progress | | 17,309 | | | 16,063 | |
| Total property, plant and equipment, gross | | 134,229 | | | 128,707 | |
Less: accumulated depreciation | | (77,645) | | | (73,321) | |
| Total property, plant and equipment, net | | $ | 56,584 | | | $ | 55,386 | |
Our depreciable property, plant and equipment assets are depreciated over the following estimated useful lives: machinery and equipment, 2 to 5 years, and buildings, 10 to 25 years.
Net property, plant and equipment by country at the end of each period was as follows:
| | | | | | | | | | | | | | | | |
| (In Millions) | | Dec 26, 2020 | | Dec 28, 2019 | | |
| United States | | $ | 38,829 | | | $ | 35,262 | | | |
| Israel | | 7,837 | | | 8,463 | | | |
| China | | 851 | | | 5,315 | | | |
| Ireland | | 5,828 | | | 3,854 | | | |
| Other countries | | 3,239 | | | 2,492 | | | |
| Total property, plant and equipment, net | | $ | 56,584 | | | $ | 55,386 | | | |
| | | | | | | | | | | |
| Financial Statements | Notes to Consolidated Financial Statements | 87 |
Other Long-term Assets
| | | | | | | | | | | | | | |
| (In Millions) | | Dec 26, 2020 | | Dec 28, 2019 |
| Derivative assets | | $ | 1,550 | | | $ | 706 | |
| Deferred tax assets | | 1,232 | | | 1,209 | |
| Pre-payments for property, plant and equipment | | 1,502 | | | 1,641 | |
| | | | |
| Other | | 1,633 | | | 1,997 | |
| Total other long-term assets | | $ | 5,917 | | | $ | 5,553 | |
Other Accrued Liabilities
Other accrued liabilities include deferred compensation of $2.5 billion as of December 26, 2020 ($2.1 billion as of December 28, 2019) and collateral received for derivatives under credit support annex agreements of $2.0 billion as of December 26, 2020 ($846 million as of December 28, 2019).
Advertising
Advertising costs, including direct marketing, are expensed as incurred and recorded within MG&A expenses. Advertising costs were $763 million in 2020 ($832 million in 2019 and $1.2 billion in 2018).
Interest and Other, Net
| | | | | | | | | | | | | | | | | | | | |
| Years Ended (In Millions) | | Dec 26, 2020 | | Dec 28, 2019 | | Dec 29, 2018 |
| Interest income | | $ | 272 | | | $ | 483 | | | $ | 438 | |
| Interest expense | | (629) | | | (489) | | | (468) | |
| Other, net | | (147) | | | 490 | | | 156 | |
| Total interest and other, net | | $ | (504) | | | $ | 484 | | | $ | 126 | |
Interest expense in the preceding table is net of $338 million of interest capitalized in 2020 ($472 million in 2019 and $496 million in 2018).
Accelerated Share Repurchases
In August 2020, we entered into ASR agreements with financial institutions under which we paid an aggregate of $10.0 billion and received an aggregate initial share delivery of 165.5 million shares of our common stock, which were immediately retired. We received and immediately retired an additional 37.7 million shares upon settlement of the ASR agreements in December 2020. In total, 203.2 million shares were repurchased under the ASR agreements at an average repurchase price per share of $49.20. The ASR agreements were entered into pursuant to our existing share repurchase program.
| | | | | |
| Note 7 : | Restructuring and Other Charges |
| | | | | | | | | | | | | | | | | | | | |
| Years Ended (In Millions) | | Dec 26, 2020 | | Dec 28, 2019 | | Dec 29, 2018 |
| 2020 Restructuring Program | | $ | 198 | | | $ | — | | | $ | — | |
| 2019 Restructuring Program | | — | | | 393 | | | — | |
| 2016 Restructuring Program | | — | | | — | | | (72) | |
| | | | | | |
| Total restructuring and other charges | | $ | 198 | | | $ | 393 | | | $ | (72) | |
2020 and 2019 Restructuring Programs
A restructuring program, which is ongoing, was approved in the first quarter of 2020 to further align our workforce with our continuing investments in the business and to execute the planned divestiture of Home Gateway Platform, a division of CCG. These actions are expected to be substantially completed in 2021.
A restructuring program was approved in the second quarter of 2019 to align our workforce with our exit of the 5G smartphone modem business. This action was substantially completed in the third quarter of 2020.
| | | | | | | | | | | |
| Financial Statements | Notes to Consolidated Financial Statements | 88 |
Restructuring and other charges (benefits) by type for the 2020 and 2019 Restructuring Programs were as follows:
| | | | | | | | | | | | | | | | |
| Years Ended (In Millions) | | Dec 26, 2020 | | Dec 28, 2019 | | |
| Employee severance and benefit arrangements | | $ | 124 | | | $ | 280 | | | |
| Asset impairment and other charges | | 74 | | | 113 | | | |
| Total restructuring and other charges | | $ | 198 | | | $ | 393 | | | |
Income Tax Provision
| | | | | | | | | | | | | | | | | | | | |
| Years Ended (In Millions) | | Dec 26, 2020 | | Dec 28, 2019 | | Dec 29, 2018 |
| Income before taxes: | | | | | | |
| U.S. | | $ | 15,452 | | | $ | 13,729 | | | $ | 14,753 | |
| Non-U.S. | | 9,626 | | | 10,329 | | | 8,564 | |
| Total income before taxes | | 25,078 | | | 24,058 | | | 23,317 | |
| Provision for taxes: | | | | | | |
| Current: | | | | | | |
| Federal | | 1,120 | | | 1,391 | | | 2,786 | |
| State | | 46 | | | 37 | | | (11) | |
| Non-U.S. | | 1,244 | | | 1,060 | | | 1,097 | |
| Total current provision for taxes | | 2,410 | | | 2,488 | | | 3,872 | |
| Deferred: | | | | | | |
| Federal | | 1,369 | | | 597 | | | (1,389) | |
| State | | 25 | | | 1 | | | 11 | |
| Non-U.S. | | 375 | | | (76) | | | (230) | |
| Total deferred provision for taxes | | 1,769 | | | 522 | | | (1,608) | |
| Total provision for taxes | | $ | 4,179 | | | $ | 3,010 | | | $ | 2,264 | |
| Effective tax rate | | 16.7 | % | | 12.5 | % | | 9.7 | % |
The difference between the tax provision at the statutory federal income tax rate and the tax provision as a percentage of income before income taxes (effective tax rate) for each period was as follows:
| | | | | | | | | | | | | | | | | | | | |
Years Ended | | Dec 26, 2020 | | Dec 28, 2019 | | Dec 29, 2018 |
| Statutory federal income tax rate | | 21.0 | % | | 21.0 | % | | 21.0 | % |
| Increase (reduction) in rate resulting from: | | | | | | |
| Non-U.S. income taxed at different rates | | (3.7) | | | (3.7) | | | (3.6) | |
| Research and development tax credits | | (2.1) | | | (2.3) | | | (2.7) | |
| | | | | | |
| Foreign derived intangible income benefit | | (1.9) | | | (3.2) | | | (3.7) | |
| Change in permanent reinvestment assertion | | 1.6 | | | — | | | 0.2 | |
| Tax Reform | | — | | | — | | | (1.3) | |
| Other | | 1.8 | | | 0.7 | | | (0.2) | |
| Effective tax rate | | 16.7 | % | | 12.5 | % | | 9.7 | % |
Our effective tax rate increased in 2020 compared to 2019, primarily driven by a change in our permanent reinvestment assertion with respect to undistributed earnings in China, as a result of our planned divestiture of the NAND memory business. It also increased due to the reduction in our foreign derived intangible income benefit in 2020.
Our effective tax rate increased in 2019 compared to 2018, primarily driven by one-time benefits that occurred in 2018.
We derive the effective tax rate benefit attributed to non-U.S. income taxed at different rates primarily from our operations in China, Hong Kong, Ireland, and Israel. The statutory tax rates in these jurisdictions range from 12.5% to 25.0%. In addition, we are subject to reduced tax rates in China and Israel as long as we conduct certain eligible activities and make certain capital investments. These conditional reduced tax rates expire at various dates through 2035 and we expect to apply for renewals upon expiration.
| | | | | | | | | | | |
| Financial Statements | Notes to Consolidated Financial Statements | 89 |
Deferred and Current Income Taxes
Deferred income taxes reflect the net tax effects of temporary differences between the carrying amounts of assets and liabilities for financial reporting purposes and the amounts for income tax purposes. Significant components of our deferred tax assets and liabilities at the end of each period were as follows:
| | | | | | | | | | | | | | |
(In Millions) | | Dec 26, 2020 | | Dec 28, 2019 |
| Deferred tax assets: | | | | |
| Accrued compensation and other benefits | | $ | 865 | | | $ | 740 | |
| Share-based compensation | | 324 | | | 294 | |
| | | | |
| Inventory | | 835 | | | 760 | |
| | | | |
| State credits and net operating losses | | 1,829 | | | 1,511 | |
| Other, net | | 617 | | | 515 | |
| Gross deferred tax assets | | 4,470 | | | 3,820 | |
| Valuation allowance | | (1,963) | | | (1,534) | |
| Total deferred tax assets | | 2,507 | | | 2,286 | |
| Deferred tax liabilities: | | | | |
| Property, plant and equipment | | (3,109) | | | (1,807) | |
| Licenses and intangibles | | (725) | | | (720) | |
| Convertible debt | | — | | | (88) | |
| Unrealized gains on investments and derivatives | | (735) | | | (292) | |
| Unremitted earnings of non-U.S. subsidiaries | | (403) | | | (28) | |
| Other, net | | (146) | | | (186) | |
| Total deferred tax liabilities | | (5,118) | | | (3,121) | |
| Net deferred tax assets (liabilities) | | $ | (2,611) | | | $ | (835) | |
| | | | |
| Reported as: | | | | |
| Deferred tax assets | | 1,232 | | | 1,209 | |
| Deferred tax liabilities | | (3,843) | | | (2,044) | |
| Net deferred tax assets (liabilities) | | $ | (2,611) | | | $ | (835) | |
Change in valuation allowance for deferred tax assets were as follows:
| | | | | | | | | | | | | | | | | | | | | | | | | | |
| Years Ended (In Millions) | | Balance at Beginning of Year | | Additions Charged to Expenses/
Other Accounts | | Net
(Deductions)
Recoveries | | Balance at
End of Year |
| | | | | | | | |
| | | | | | | | |
| | | | | | | | |
| | | | | | | | |
| Valuation allowance for deferred tax assets | | | | | | | | |
| December 26, 2020 | | $ | 1,534 | | | $ | 378 | | | $ | 51 | | | $ | 1,963 | |
| December 28, 2019 | | $ | 1,302 | | | $ | 239 | | | $ | (7) | | | $ | 1,534 | |
| December 29, 2018 | | $ | 1,171 | | | $ | 185 | | | $ | (54) | | | $ | 1,302 | |
Deferred tax assets are included within other long-term assets on the Consolidated Balance Sheets.
The valuation allowance as of December 26, 2020 included allowances primarily related to unrealized state credit carryforwards of $1.8 billion.
As of December 26, 2020, our federal and non-U.S. net operating loss carryforwards for income tax purposes were $345 million and $826 million, respectively. Most of the non-U.S. net operating loss carryforwards have no expiration date. The remaining non-U.S. and U.S. federal net operating loss carryforwards expire at various dates through 2040. A significant amount of the net operating loss carryforwards in the U.S. relates to acquisitions and, as a result, is limited in the amount that can be recognized in any one year. The non-U.S. net operating loss carryforwards include $772 million that is not likely to be recovered and has been reduced by a valuation allowance.
At December 26, 2020, we have undistributed earnings of certain foreign subsidiaries of approximately $19.0 billion that we have indefinitely invested, and on which we have not recognized deferred taxes. Estimating the amount of potential tax is not practicable because of the complexity and variety of assumptions necessary to compute the tax.
Current income taxes receivable of $131 million as of December 26, 2020 ($76 million as of December 28, 2019) are included in other current assets. Current income taxes payable of $756 million as of December 26, 2020 ($575 million as of December 28, 2019) are included in other accrued liabilities.
| | | | | | | | | | | |
| Financial Statements | Notes to Consolidated Financial Statements | 90 |
Long-term income taxes payable of $4.6 billion as of December 26, 2020 ($4.9 billion as of December 28, 2019) is primarily comprised of the transition tax from Tax Reform, which is payable over eight years beginning in 2018, as well as amounts for uncertain tax positions, reduced by the associated deduction for state taxes and non-U.S. tax credits.
Uncertain Tax Positions
| | | | | | | | | | | | | | | | | | | | |
| (In Millions) | | Dec 26, 2020 | | Dec 28, 2019 | | Dec 29, 2018 |
| Beginning gross unrecognized tax benefits | | $ | 548 | | | $ | 283 | | | $ | 211 | |
| Settlements and effective settlements with tax authorities | | (142) | | | (4) | | | (7) | |
| | | | | | |
| Changes in balances related to tax position taken during prior periods | | 165 | | 122 | | (11) | |
| | | | | | |
| Changes in balances related to tax position taken during current period | | 257 | | 147 | | 90 |
| Ending gross unrecognized tax benefits | | $ | 828 | | | $ | 548 | | | $ | 283 | |
If the remaining balance of unrecognized tax benefits were recognized in a future period, it would result in a tax benefit of $550 million as of December 26, 2020 ($454 million as of December 28, 2019) and a reduction in the effective tax rate. Interest, penalties, and accrued interest related to unrecognized tax benefits were insignificant in the periods presented.
We comply with the tax laws, regulations, and filing requirements of all jurisdictions in which we conduct business. We regularly engage in discussions and negotiations with tax authorities regarding tax matters in various jurisdictions. Although the timing of the resolutions and/or closures of audits is highly uncertain, it is reasonably possible that certain U.S. federal and non-U.S. tax audits may be concluded within the next 12 months, which could increase or decrease the balance of our gross unrecognized tax benefits. We estimate that the unrecognized tax benefits as of December 26, 2020 could decrease by as much as $430 million in the next 12 months.
We file federal, state, and non-U.S. tax returns. Excluding pre-acquisition Altera tax years, we are no longer subject to U.S. federal and non-U.S. tax examinations for years prior to 2010. For U.S. state tax returns, we are no longer subject to tax examination for years prior to 2012.
Debt Investments
Trading Assets
Net gains related to trading assets still held at the reporting date were $694 million in 2020 (net gains of $26 million in 2019 and net losses of $188 million in 2018). Net losses on the related derivatives were $667 million in 2020 (net gains of $22 million in 2019 and net gains of $163 million in 2018).
Available-for-Sale Debt Investments
Available-for-sale investments include corporate debt, government debt, and financial institution instruments. Government debt includes instruments such as non-U.S. government bonds and U.S. agency securities. Financial institution instruments include instruments issued or managed by financial institutions in various forms, such as commercial paper, fixed- and floating-rate bonds, money market fund deposits, and time deposits. As of December 26, 2020 and December 28, 2019, substantially all time deposits were issued by institutions outside the U.S. The adjusted cost of our available-for-sale investments was $7.8 billion as of December 26, 2020 and $6.5 billion as of December 28, 2019. The adjusted cost of our available-for-sale investments approximated the fair value for these periods.
The fair values of available-for-sale debt investments by contractual maturity as of December 26, 2020 were as follows:
| | | | | | | | |
| (In Millions) | | Fair Value |
| Due in 1 year or less | | $ | 2,978 | |
| Due in 1–2 years | | 1,093 | |
| Due in 2–5 years | | 1,099 | |
| Due after 5 years | | — | |
| Instruments not due at a single maturity date | | 2,781 | |
| Total | | $ | 7,951 | |
| | | | | | | | | | | |
| Financial Statements | Notes to Consolidated Financial Statements | 91 |
Equity Investments
| | | | | | | | | | | | | | |
(In Millions) | | Dec 26, 2020 | | Dec 28, 2019 |
Marketable equity securities | | $ | 1,830 | | | $ | 450 | |
Non-marketable equity securities | | 3,304 | | | 3,480 | |
Equity method investments | | 18 | | | 37 | |
| Total | | $ | 5,152 | | | $ | 3,967 | |
The components of gains (losses) on equity investments, net for each period were as follows:
| | | | | | | | | | | | | | | | | | | | |
| Years Ended (In Millions) | | Dec 26, 2020 | | Dec 28, 2019 | | Dec 29, 2018 |
Ongoing mark-to-market adjustments on marketable equity securities | | $ | (133) | | | $ | 277 | | | $ | (129) | |
| Observable price adjustments on non-marketable equity securities | | 176 | | | 293 | | | 202 | |
| Impairment charges | | (303) | | | (122) | | | (424) | |
Sale of equity investments and other 1 | | 2,164 | | | 1,091 | | | 226 | |
| Total gains (losses) on equity investments, net | | $ | 1,904 | | | $ | 1,539 | | | $ | (125) | |
1 Sale of equity investments and other includes initial fair value adjustments recorded upon a security becoming marketable, realized gains (losses) on sales of non-marketable equity investments, and our share of equity method investee gains (losses) and distributions.
In 2020, we recognized higher than historically experienced impairment charges on our non-marketable portfolio based on our assessment of the impact of recent public and private market volatility and tightening of liquidity. We recognized impairments of $290 million on non-marketable equity securities in 2020 ($122 million in 2019 and $132 million in 2018).
Gains and losses for our marketable and non-marketable equity securities during each period were as follows:
| | | | | | | | | | | | | | | | | | | | | |
| | | | | | | |
| (In Millions) | | | Dec 26, 2020 | | Dec 28, 2019 | | Dec 29, 2018 |
| Net gains (losses) recognized during the period on equity securities | | | $ | 1,679 | | | $ | 734 | | | $ | 298 | |
| Less: Net (gains) losses recognized during the period on equity securities sold during the period | | | (254) | | | (424) | | | (445) | |
| Net unrealized gains (losses) recognized during the period on equity securities still held at the reporting date | | | $ | 1,425 | | | $ | 310 | | | $ | (147) | |
As of December 28, 2019, Intel owned $307 million of shares in Cloudera, all of which we sold in 2020. As of December 29, 2018, Intel owned $1.1 billion of shares in ASML, all of which we sold in 2019.
IMFT
IMFT was formed in 2006 by Micron Technology, Inc. (Micron) and Intel to jointly develop NAND and 3D XPoint technology products. We owned a 49% interest in the entity.
Upon Micron's notice of intent to exercise its right to call our interest in IMFT, we recognized an impairment charge of $290 million related to our investment in the third quarter of 2018. In 2019, Micron exercised its right and we sold our non-controlling interest in IMFT to Micron. We received $1.7 billion in sales proceeds and certain other repayments from Micron during 2019 and reported a gain of $107 million. We continue to purchase products manufactured by Micron at the IMFT facility under our supply agreement, which includes the next generation of 3D XPoint technology.
McAfee
McAfee completed its initial public offering in October 2020. Due to our 40% ownership and significant influence as of December 26, 2020, we account for it as an equity method investment. We had no accounting carrying value as of December 26, 2020 and as of December 28, 2019. During 2020, we received $126 million in dividends ($632 million in 2019).
| | | | | |
| Note 10 : | Acquisitions and Divestitures |
Acquisitions
We completed six acquisitions in 2020 and five acquisitions in 2019, all of which qualified as business combinations. The consideration for the acquisitions in 2020 and 2019 primarily consisted of cash and was allocated to goodwill and identified intangible assets. For information on the assignment of goodwill to our operating segments, see "Note 11: Goodwill," and for information on the classification of intangible assets, see "Note 12: Identified Intangible Assets."
| | | | | | | | | | | |
| Financial Statements | Notes to Consolidated Financial Statements | 92 |
Moovit
On May 4, 2020, we acquired Moovit, a MaaS solutions company, for total consideration of $915 million. The fair values of the assets acquired relate to goodwill of $638 million and intangible assets of $331 million. The goodwill arising from the acquisition is attributed to the expected synergies and other benefits that will be generated from the combination of Intel and Moovit. We expect substantially all of the goodwill will not be deductible for local tax purposes. The acquisition-related intangible assets are primarily related to Moovit's monthly active user base and application platform. The goodwill and operating results of Moovit are included in our Mobileye operating segment.
Habana Labs
On December 12, 2019, we acquired Habana Labs, an Israel-based developer of programmable deep learning accelerators targeting AI workloads in the data center, for total consideration of $1.7 billion. Habana Labs strengthens our AI portfolio and accelerates our efforts to capitalize on the nascent, fast-growing AI silicon market opportunity. The fair values of the assets acquired relate to goodwill of $1.5 billion and acquisition-related intangible assets of $250 million. The goodwill arising from the acquisition is attributed to the expected synergies and other benefits that will be generated from the combination of Intel and Habana Labs. We expect substantially all of the goodwill will not be deductible for tax purposes. The acquisition-related intangible assets are primarily related to in-process R&D. The goodwill and operating results of Habana Labs are included in our DCG operating segment.
Divestitures
NAND Memory Business
On October 19, 2020, we signed an agreement with SK hynix Inc. (SK hynix) to divest our NAND memory business, including our NAND memory fabrication facility in Dalian, China and certain related equipment and tangible assets (the Fab Assets), our NAND SSD business (the NAND SSD Business), and our NAND memory technology and manufacturing business (the NAND OpCo Business). Our Intel Optane memory business is expressly excluded from the transaction. The transaction will occur over two closings for total consideration of $9.0 billion in cash, of which $7.0 billion will be received upon initial closing, not to occur prior to November 1, 2021, and the remaining $2.0 billion will be received no earlier than March 2025. The consummations of the first closing and the second closing are subject to customary conditions, including the receipt of certain governmental approvals.
At the first closing, Intel will sell to SK hynix the Fab Assets and the NAND SSD Business, and SK hynix will assume from Intel certain liabilities related to the Fab Assets and the NAND SSD Business. In connection with the first closing, we and certain affiliates of SK hynix will also enter into a NAND wafer manufacturing and sale agreement pursuant to which we will manufacture and sell to SK hynix NAND memory wafers to be manufactured using the Fab Assets in Dalian, China, until the second closing.
We will transfer certain employees, IP, and other assets related to the NAND OpCo Business to separately created, wholly owned subsidiaries of Intel at the first closing. The equity interest of these wholly owned subsidiaries will transfer to SK hynix at the second closing. We have concluded based on the terms of the transaction agreements that the subsidiaries will be variable interest entities for which we are not the primary beneficiary, and accordingly will deconsolidate at the first closing.
The carrying amounts of the major classes of NAND assets held for sale included the following:
| | | | | | | | |
| (In Millions) | | Dec 26, 2020 |
| Inventories | | $ | 962 | |
| Property, plant and equipment, net | | 4,363 | |
| Total assets held for sale | | $ | 5,325 | |
We ceased recording depreciation on property, plant and equipment as of the date the assets triggered held for sale accounting. Additional capital purchases of approximately $1.8 billion expected prior to first close will be classified as assets held for sale in the Consolidated Balance Sheet and within additions to held for sale NAND property, plant and equipment on the Consolidated Statement of Cash Flows.
Home Gateway Platform Division
On July 31, 2020, we completed the divestiture of the majority of Home Gateway Platform, a division of CCG, for proceeds of $150 million. The divestiture included the transfer of certain employees, equipment, and an ongoing supply agreement for future units.
Smartphone Modem Business
On December 2, 2019, we completed the divestiture of the majority of our smartphone modem business, including certain employees, IP, equipment, and leases. Net assets sold were $267 million. We recognized a pre-tax gain of $690 million on the divestiture.
Wind River
During the second quarter of 2018, we completed the divestiture of Wind River and recognized a pre-tax gain of $494 million.
| | | | | | | | | | | |
| Financial Statements | Notes to Consolidated Financial Statements | 93 |
| | | | | | | | | | | | | | | | | | | | | | | | | | | | |
(In Millions)
| | Dec 28, 2019 | | Acquisitions | | | | Other | | Dec 26, 2020 |
| Data Center Group | | $ | 7,182 | | | $ | 50 | | | | | $ | — | | | $ | 7,232 | |
| Internet of Things Group | | 1,579 | | | 12 | | | | | — | | | 1,591 | |
| Mobileye | | 10,290 | | | 638 | | | | | — | | | 10,928 | |
| Programmable Solutions Group | | 2,654 | | | 2 | | | | | (34) | | | 2,622 | |
| Client Computing Group | | 4,333 | | | 27 | | | | | — | | | 4,360 | |
| All other | | 238 | | | — | | | | | — | | | 238 | |
| Total | | $ | 26,276 | | | $ | 729 | | | | | $ | (34) | | | $ | 26,971 | |
| | | | | | | | | | | | | | | | | | | | | | | | | | | | |
| (In Millions) | | Dec 29, 2018 | | Acquisitions | | | | Other | | Dec 28, 2019 |
| Data Center Group | | $ | 5,424 | | | $ | 1,758 | | | | | $ | — | | | $ | 7,182 | |
| Internet of Things Group | | 1,579 | | | — | | | | — | | | 1,579 |
| Mobileye | | 10,290 | | | — | | | | — | | | 10,290 |
| Programmable Solutions Group | | 2,579 | | | 67 | | | | 8 | | | 2,654 |
| Client Computing Group | | 4,403 | | | — | | | | (70) | | | 4,333 |
| All other | | 238 | | | — | | | | | — | | | 238 |
| Total | | $ | 24,513 | | | $ | 1,825 | | | | | $ | (62) | | | $ | 26,276 | |
During the fourth quarters of 2020 and 2019, we completed our annual impairment assessments and we concluded that goodwill was not impaired in either of these years. The accumulated impairment loss as of December 26, 2020 was $719 million: $365 million associated with CCG, $275 million associated with DCG, and $79 million associated with IOTG.
| | | | | |
| Note 12 : | Identified Intangible Assets |
| | | | | | | | | | | | | | | | | | | | | | | | | | | | | | | | | | | | | | |
| | December 26, 2020 | | December 28, 2019 |
| (In Millions) | | Gross Assets | | Accumulated Amortization | | Net | | Gross Assets | | Accumulated Amortization | | Net |
| Developed technology | | $ | 10,188 | | | $ | (4,880) | | | $ | 5,308 | | | $ | 9,407 | | | $ | (3,801) | | | $ | 5,606 | |
| Customer relationships and brands | | 2,110 | | | (854) | | | 1,256 | | | 2,160 | | | (708) | | | 1,452 | |
| Licensed technology and patents | | 2,836 | | | (1,629) | | | 1,207 | | | 2,975 | | | (1,455) | | | 1,520 | |
| In-process R&D | | 954 | | | — | | | 954 | | | 1,664 | | | — | | | 1,664 | |
| Other non-amortizing intangibles | | 301 | | | — | | | 301 | | | 585 | | | — | | | 585 | |
| Total identified intangible assets | | $ | 16,389 | | | $ | (7,363) | | | $ | 9,026 | | | $ | 16,791 | | | $ | (5,964) | | | $ | 10,827 | |
Amortization expenses recorded for identified intangible assets in the Consolidated Statements of Income for each period and the weighted average useful life were as follows:
| | | | | | | | | | | | | | | | | | | | | | | | | | | | | | | | |
| Years Ended (In Millions) | | Location | | Dec 26, 2020 | | Dec 28, 2019 | | Dec 29, 2018 | | Weighted Average Useful Life1 |
| Developed technology | | Cost of sales | | $ | 1,211 | | | $ | 1,124 | | | $ | 1,105 | | | 9 years |
| Customer relationships and brands | | Marketing, general and administrative | | 205 | | | 200 | | | 200 | | | 11 years |
| Licensed technology and patents | | Cost of sales | | 341 | | | 298 | | | 260 | | | 13 years |
| Total amortization expenses | | | | $ | 1,757 | | | $ | 1,622 | | | $ | 1,565 | | | |
1 Represents weighted average useful life in years of intangible assets during 2020.
We expect future amortization expense for the next five years and thereafter to be as follows:
| | | | | | | | | | | | | | | | | | | | | | | | | | | | | | | | | | | | | | | | | | | | |
| (In Millions) | | 2021 | | 2022 | | 2023 | | 2024 | | 2025 | | Thereafter | | Total |
| Future amortization expenses | | $ | 1,749 | | | $ | 1,618 | | | $ | 1,453 | | | $ | 1,076 | | | $ | 672 | | | $ | 1,203 | | | $ | 7,771 | |
| | | | | | | | | | | |
| Financial Statements | Notes to Consolidated Financial Statements | 94 |
Short-Term Debt
Short-term debt, which primarily includes the current portion of long-term debt, was $2.5 billion as of December 26, 2020 and $3.7 billion as of December 28, 2019.
The current portion of long-term debt includes debt classified as short-term based on time remaining until maturity and, in 2019, also included amounts outstanding under our 2009 Debentures.
We have an ongoing authorization from our Board of Directors to borrow up to $10.0 billion under our commercial paper program.
| | | | | | | | | | | |
| Financial Statements | Notes to Consolidated Financial Statements | 95 |
Long-Term Debt
| | | | | | | | | | | | | | | | | | | | | | | | | | |
| | Dec 26, 2020 | | | | Dec 28, 2019 | | | | |
(In Millions) | | Effective Interest Rate | | Amount | | | | Amount | | | | |
| Floating-rate senior notes: | | | | | | | | | | | | |
| Three-month LIBOR plus 0.08%, due May 2020 | | —% | | $ | — | | | | | $ | 700 | | | | | |
| Three-month LIBOR plus 0.35%, due May 2022 | | 1.25% | | 800 | | | | | 800 | | | | | |
| Fixed-rate senior notes: | | | | | | | | | | | | |
| 1.85%, due May 2020 | | —% | | — | | | | | 1,000 | | | | | |
| 2.45%, due July 2020 | | —% | | — | | | | | 1,750 | | | | | |
| 1.70%, due May 2021 | | 1.79% | | 500 | | | | | 500 | | | | | |
| 3.30%, due October 2021 | | 2.99% | | 2,000 | | | | | 2,000 | | | | | |
| 2.35%, due May 2022 | | 1.96% | | 750 | | | | | 750 | | | | | |
| 3.10%, due July 2022 | | 2.70% | | 1,000 | | | | | 1,000 | | | | | |
4.00%, due December 20221 | | 2.83% | | 417 | | | | | 382 | | | | | |
| 2.70%, due December 2022 | | 2.28% | | 1,500 | | | | | 1,500 | | | | | |
| 4.10%, due November 2023 | | 3.22% | | 400 | | | | | 400 | | | | | |
| 2.88%, due May 2024 | | 2.31% | | 1,250 | | | | | 1,250 | | | | | |
| 2.70%, due June 2024 | | 2.14% | | 600 | | | | | 600 | | | | | |
| 3.40%, due March 2025 | | 3.46% | | 1,500 | | | | | — | | | | | |
| 3.70%, due July 2025 | | 2.93% | | 2,250 | | | | | 2,250 | | | | | |
| 2.60%, due May 2026 | | 1.36% | | 1,000 | | | | | 1,000 | | | | | |
| 3.75%, due March 2027 | | 3.80% | | 1,000 | | | | | — | | | | | |
| 3.15%, due May 2027 | | 1.91% | | 1,000 | | | | | 1,000 | | | | | |
| 2.45%, due November 2029 | | 2.39% | | 2,000 | | | | | 1,250 | | | | | |
| 3.90%, due March 2030 | | 3.94% | | 1,500 | | | | | — | | | | | |
| 4.00%, due December 2032 | | 1.84% | | 750 | | | | | 750 | | | | | |
| 4.60%, due March 2040 | | 4.62% | | 750 | | | | | — | | | | | |
| 4.80%, due October 2041 | | 2.82% | | 802 | | | | | 802 | | | | | |
| 4.25%, due December 2042 | | 2.01% | | 567 | | | | | 567 | | | | | |
| 4.90%, due July 2045 | | 2.90% | | 772 | | | | | 772 | | | | | |
| 4.10%, due May 2046 | | 2.13% | | 1,250 | | | | | 1,250 | | | | | |
| 4.10%, due May 2047 | | 2.07% | | 1,000 | | | | | 1,000 | | | | | |
| 4.10%, due August 2047 | | 1.64% | | 640 | | | | | 640 | | | | | |
| 3.73%, due December 2047 | | 2.39% | | 1,967 | | | | | 1,967 | | | | | |
| 3.25%, due November 2049 | | 3.20% | | 2,000 | | | | | 1,500 | | | | | |
| 4.75%, due March 2050 | | 4.76% | | 2,250 | | | | | — | | | | | |
| 3.10%, due February 2060 | | 3.12% | | 1,000 | | | | | — | | | | | |
| 4.95%, due March 2060 | | 5.00% | | 1,000 | | | | | — | | | | | |
| Oregon and Arizona bonds: | | | | | | | | | | | | |
| 2.40% - 2.70%, due December 2035 - 2040 | | 2.49% | | 423 | | | | | 423 | | | | | |
| 5.00%, due March 2049 | | 2.13% | | 138 | | | | | 138 | | | | | |
| 5.00%, due June 2049 | | 2.15% | | 438 | | | | | 438 | | | | | |
| Junior subordinated convertible debentures: | | | | | | | | | | | | |
| 3.25%, due August 2039 | | —% | | — | | | | | 372 | | | | | |
| Total senior notes and other borrowings | | | | 35,214 | | | | | 28,751 | | | | | |
| Unamortized premium/discount and issuance costs | | | | (378) | | | | | (529) | | | | | |
| Hedge accounting fair value adjustments | | | | 1,565 | | | | | 781 | | | | | |
| Long-term debt | | | | 36,401 | | | | | 29,003 | | | | | |
| Current portion of long-term debt | | | | (2,504) | | | | | (3,695) | | | | | |
| Total long-term debt | | | | $ | 33,897 | | | | | $ | 25,308 | | | | | |
1To manage foreign currency risk associated with the Australian-dollar-denominated notes issued in 2015, we entered into currency interest rate swaps which had an aggregate outstanding notional amount of $396 million at December 26, 2020, which effectively converted these notes to U.S.-dollar-denominated notes. For further discussion on our currency interest rate swaps, see "Note 16: Derivative Financial Instruments." Principal and unamortized discount/issuance costs for the Australian-dollar-denominated notes in the table above were calculated using foreign currency exchange rates as of December 26, 2020 and December 28, 2019.
| | | | | | | | | | | |
| Financial Statements | Notes to Consolidated Financial Statements | 96 |
Senior Notes
In 2020, we issued a total of $10.3 billion aggregate principal amount of senior notes. Net proceeds from the offerings are being used for general corporate purposes, which may include refinancing outstanding debt, funding for working capital and capital expenditures, and repurchasing shares of our common stock. During 2020, we repaid $1.0 billion of our 1.85% senior notes that matured in May 2020 and $1.8 billion of our 2.45% senior notes that matured in July 2020. We also repaid $700 million in floating-rate senior notes that matured in May 2020.
In 2019, we issued a total of $2.8 billion aggregate principal amount of senior notes and redeemed our $915 million, 4.70% senior notes due December 2045.
Our floating-rate senior notes pay interest quarterly and our fixed-rate senior notes pay interest semiannually. We may redeem the fixed-rate notes prior to their maturity at our option at specified redemption prices and subject to certain restrictions. The obligations under the notes rank equally in right of payment with all of our other existing and future senior unsecured indebtedness and will effectively rank junior to all liabilities of our subsidiaries.
Oregon and Arizona Bonds
In 2019, we received proceeds of $648 million in aggregate from the sale of the 2019 Arizona Bonds and the 2019 Oregon Bonds. The bonds are our unsecured general obligations in accordance with loan agreements we entered into with the Industrial Development Authority of the City of Chandler, Arizona and the State of Oregon Business Development Commission. The bonds mature in 2049 and carry an interest rate of 5.00%. The 2019 Arizona Bonds and the 2019 Oregon Bonds are subject to mandatory tender in June 2024 and March 2022, respectively, at which time we can re-market the bonds as either fixed-rate bonds for a specified period or as variable-rate bonds until another fixed-rate period is selected or until their final maturity date.
Convertible Debentures
In 2009, we issued the 2009 Debentures, which were convertible, subject to certain conditions, into shares of our common stock and paid a fixed rate of interest semiannually. In 2019, we paid $1.5 billion to satisfy conversion obligations for $615 million in principal, resulting in a cumulative loss of $156 million in interest and other, net, and $1.0 billion as a reduction in stockholders' equity related to the conversion feature. In 2020, we paid $1.1 billion in cash to settle our remaining $372 million in principal, resulting in a loss of $109 million in interest and other, net and $750 million as a reduction in stockholders' equity related to the conversion feature.
Debt Maturities
Our aggregate debt maturities, excluding commercial paper and drafts payable, based on outstanding principal as of December 26, 2020, by year payable, are as follows:
| | | | | | | | | | | | | | | | | | | | | | | | | | | | | | | | | | | | | | | | | | | | |
| (In Millions) | | 2021 | | 2022 | | 2023 | | 2024 | | 2025 | | 2026 and thereafter | | Total |
| | $ | 2,500 | | | $ | 4,467 | | | $ | 400 | | | $ | 1,850 | | | $ | 3,750 | | | $ | 22,247 | | | $ | 35,214 | |
| | | | | | | | | | | |
| Financial Statements | Notes to Consolidated Financial Statements | 97 |
Assets and Liabilities Measured and Recorded at Fair Value on a Recurring Basis
| | | | | | | | | | | | | | | | | | | | | | | | | | | | | | | | | | | | | | | | | | | | | | | | | | |
| | December 26, 2020 | | December 28, 2019 |
| | Fair Value Measured and Recorded at Reporting Date Using | | Total | | Fair Value Measured and Recorded at Reporting Date Using | | Total |
(In Millions) | | Level 1 | | Level 2 | | Level 3 | | Level 1 | | Level 2 | | Level 3 | |
| Assets | | | | | | | | | | | | | | | | |
| Cash equivalents: | | | | | | | | | | | | | | | | |
| Corporate debt | | — | | $ | 50 | | | $ | — | | | $ | 50 | | | — | | $ | 713 | | | — | | $ | 713 | |
Financial institution instruments1 | | 2,781 | | | 636 | | | — | | | 3,417 | | | 1,064 | | | 408 | | | — | | 1,472 | |
| | | | | | | | | | | | | | | | |
Reverse repurchase
agreements | | — | | 1,900 | | | — | | 1,900 | | | — | | 1,500 | | | — | | 1,500 | |
| Short-term investments: | | | | | | | | | | | | | | | | |
| Corporate debt | | — | | 428 | | | — | | 428 | | | — | | 347 | | | — | | 347 | |
Financial institution instruments1 | | — | | 1,179 | | | — | | 1,179 | | | — | | 724 | | | — | | 724 | |
Government debt2 | | — | | 685 | | | — | | 685 | | | — | | 11 | | | — | | 11 | |
| Trading assets: | | | | | | | | | | | | | | | | |
| | | | | | | | | | | | | | | | |
| Corporate debt | | — | | 3,815 | | | — | | 3,815 | | | — | | 2,848 | | | — | | 2,848 | |
Financial institution instruments1 | | 131 | | | 2,847 | | | — | | 2,978 | | | 87 | | | 1,578 | | | — | | 1,665 | |
Government debt2 | | — | | | 8,945 | | | — | | 8,945 | | | — | | 3,334 | | | — | | 3,334 | |
| Other current assets: | | | | | | | | | | | | | | | | |
| Derivative assets | | 48 | | | 644 | | | — | | | 692 | | | 50 | | | 230 | | | — | | | 280 | |
Loans receivable3 | | — | | 439 | | | — | | 439 | | | — | | — | | | — | | — | |
| Marketable equity securities | | 136 | | | 1,694 | | | — | | | 1,830 | | | 450 | | | — | | | — | | | 450 | |
| Other long-term investments: | | | | | | | | | | | | | | | | |
| | | | | | | | | | | | | | | | |
| Corporate debt | | — | | 1,520 | | | — | | 1,520 | | | — | | 1,898 | | | — | | 1,898 | |
Financial institution instruments1 | | — | | 257 | | | — | | 257 | | | — | | 825 | | | — | | 825 | |
Government debt2 | | — | | 415 | | | — | | 415 | | | — | | 553 | | | — | | 553 | |
| Other long-term assets: | | | | | | | | | | | | | | | | |
| Derivative assets | | — | | | 1,520 | | | 30 | | | 1,550 | | | — | | | 690 | | | 16 | | | 706 | |
Loans receivable3 | | — | | 157 | | | — | | 157 | | | — | | 554 | | | — | | 554 | |
| Total assets measured and recorded at fair value | | $ | 3,096 | | | $ | 27,131 | | | $ | 30 | | | $ | 30,257 | | | $ | 1,651 | | | $ | 16,213 | | | $ | 16 | | | $ | 17,880 | |
| Liabilities | | | | | | | | | | | | | | | | |
| Other accrued liabilities: | | | | | | | | | | | | | | | | |
| Derivative liabilities | | $ | — | | | $ | 810 | | | $ | — | | | $ | 810 | | | $ | 3 | | | $ | 287 | | | $ | — | | | $ | 290 | |
| | | | | | | | | | | | | | | | |
| Other long-term liabilities: | | | | | | | | | | | | | | | | |
| Derivative liabilities | | — | | | 5 | | | — | | | 5 | | | — | | | 13 | | | — | | | 13 | |
| Total liabilities measured and recorded at fair value | | $ | — | | | $ | 815 | | | $ | — | | | $ | 815 | | | $ | 3 | | | $ | 300 | | | $ | — | | | $ | 303 | |
1Level 1 investments in financial institution instruments consist of money market funds. Level 2 investments consist primarily of commercial paper, certificates of deposit, time deposits, and notes and bonds issued by financial institutions.
2Level 2 investments in government debt consist primarily of U.S. agency notes and non-U.S. government debt, as well as marketable equity securities subject to security-specific restrictions.
3 The fair value of our loans receivable for which we elected the fair value option did not significantly differ from the contractual principal balance based on the contractual currency.
| | | | | | | | | | | |
| Financial Statements | Notes to Consolidated Financial Statements | 98 |
Assets Measured and Recorded at Fair Value on a Non-Recurring Basis
Our non-marketable equity securities, equity method investments, and certain non-financial assets, such as intangible assets and property, plant and equipment, are recorded at fair value only if an impairment or observable price adjustment is recognized in the current period. If an impairment or observable price adjustment is recognized on our non-marketable equity securities during the period, we classify these assets as Level 3.
We classify non-marketable equity securities and non-marketable equity method investments as Level 3. Impairments recognized on these investments held as of December 26, 2020 were $272 million ($113 million held as of December 28, 2019 and $416 million held as of December 29, 2018).
Financial Instruments Not Recorded at Fair Value on a Recurring Basis
Financial instruments not recorded at fair value on a recurring basis include non-marketable equity securities and equity method investments that have not been remeasured or impaired in the current period, grants receivable, reverse repurchase agreements with original maturities greater than three months, and issued debt.
We classify the fair value of grants receivables as Level 2. The estimated fair value of these financial instruments approximates their carrying value. The aggregate carrying value of grants receivable as of December 26, 2020 was $139 million (the aggregate carrying value of grants receivable and reverse repurchase agreements with original maturities greater than three months as of December 28, 2019 was $543 million).
We classify the fair value of issued debt (excluding commercial paper and drafts payable) as Level 2. The fair value of these instruments was $40.9 billion as of December 26, 2020 ($30.6 billion as of December 28, 2019).
| | | | | |
| Note 15 : | Other Comprehensive Income (Loss) |
The changes in accumulated other comprehensive income (loss) by component and related tax effects for each period were as follows:
| | | | | | | | | | | | | | | | | | | | | | | | | | | | |
(In Millions) | | | | Unrealized Holding Gains (Losses) on Derivatives | | Actuarial Valuation and Other Pension Expenses | | Translation Adjustments and Other | | Total |
| | | | | | | | | | |
| | | | | | | | | | |
December 31, 20171 | | | | $ | 130 | | | $ | (1,028) | | | $ | (30) | | | $ | (928) | |
| Other comprehensive income (loss) before reclassifications | | | | (310) | | | 157 | | | (16) | | | (169) | |
| Amounts reclassified out of accumulated other comprehensive income (loss) | | | | 9 | | | 109 | | | 8 | | | 126 | |
| Tax effects | | | | 48 | | | (56) | | | 5 | | | (3) | |
| Other comprehensive income (loss) | | | | (253) | | | 210 | | | (3) | | | (46) | |
| December 29, 2018 | | | | (123) | | | (818) | | | (33) | | | (974) | |
| | | | | | | | | | |
| | | | | | | | | | |
| Other comprehensive income (loss) before reclassifications | | | | (11) | | | (753) | | | 109 | | | (655) | |
| Amounts reclassified out of accumulated other comprehensive income (loss) | | | | 195 | | | 67 | | | (6) | | | 256 | |
| Tax effects | | | | (7) | | | 122 | | | (22) | | | 93 | |
| Other comprehensive income (loss) | | | | 177 | | | (564) | | | 81 | | | (306) | |
| December 28, 2019 | | | | 54 | | | (1,382) | | | 48 | | | (1,280) | |
| Other comprehensive income (loss) before reclassifications | | | | 806 | | | (323) | | | 55 | | | 538 | |
| Amounts reclassified out of accumulated other comprehensive income (loss) | | | | (8) | | | 89 | | | (11) | | | 70 | |
| Tax effects | | | | (121) | | | 51 | | | (9) | | | (79) | |
| Other comprehensive income (loss) | | | | 677 | | | (183) | | | 35 | | | 529 | |
| December 26, 2020 | | | | $ | 731 | | | $ | (1,565) | | | $ | 83 | | | $ | (751) | |
| | | | | | | | | | |
| | | | | | | | | | |
1Balances as of December 31, 2017 include opening balance adjustments made as a result of changes in accounting principle due to the adoption of new accounting standards in 2018.
We estimate that we will reclassify approximately $330 million (before taxes) of net derivative gains included in accumulated other comprehensive income (loss) into earnings within the next 12 months.
| | | | | | | | | | | |
| Financial Statements | Notes to Consolidated Financial Statements | 99 |
| | | | | |
| Note 16 : | Derivative Financial Instruments |
Volume of Derivative Activity
Total gross notional amounts for outstanding derivatives (recorded at fair value) at the end of each period were as follows:
| | | | | | | | | | | | | | | | | | | | |
(In Millions) | | Dec 26, 2020 | | Dec 28, 2019 | | Dec 29, 2018 |
| Foreign currency contracts | | $ | 31,209 | | | $ | 23,981 | | | $ | 19,223 | |
| Interest rate contracts | | 14,461 | | | 14,302 | | | 22,447 | |
| Other | | 2,026 | | | 1,753 | | | 1,356 | |
| Total | | $ | 47,696 | | | $ | 40,036 | | | $ | 43,026 | |
During 2020 and 2019, we did not enter into any new pay-variable, receive-fixed interest rate swaps to hedge against changes in the fair value attributable to benchmark interest rates related to our outstanding senior notes. In 2018, we entered into $7.1 billion of such swaps and designated them as fair value hedges. The total notional amount of these swaps was $12.0 billion as of December 26, 2020 and $12.0 billion as of December 28, 2019. In 2019, we unwound $7.1 billion of swaps, resulting in a $111 million gain to be amortized over the remaining life of the debt.
Fair Value of Derivative Instruments in the Consolidated Balance Sheets
| | | | | | | | | | | | | | | | | | | | | | | | | | |
| | December 26, 2020 | | December 28, 2019 |
| (In Millions) | | Assets1 | | Liabilities2 | | Assets1 | | Liabilities2 |
| Derivatives designated as hedging instruments | | | | | | | | |
Foreign currency contracts3 | | $ | 551 | | | $ | 2 | | | $ | 56 | | | $ | 159 | |
| Interest rate contracts | | 1,498 | | | — | | | 690 | | | 9 | |
| | | | | | | | |
| Total derivatives designated as hedging instruments | | 2,049 | | | 2 | | | 746 | | | 168 | |
| Derivatives not designated as hedging instruments | | | | | | | | |
Foreign currency contracts3 | | 142 | | | 685 | | | 179 | | | 78 | |
| Interest rate contracts | | 3 | | | 128 | | | 11 | | | 54 | |
| Equity contracts | | 48 | | | — | | | 50 | | | 3 | |
| Total derivatives not designated as hedging instruments | | 193 | | | 813 | | | 240 | | | 135 | |
| Total derivatives | | $ | 2,242 | | | $ | 815 | | | $ | 986 | | | $ | 303 | |
1Derivative assets are recorded as other assets, current and long-term.
2Derivative liabilities are recorded as other liabilities, current and long-term.
3The majority of these instruments mature within 12 months.
Amounts Offset in the Consolidated Balance Sheets
Agreements subject to master netting arrangements with various counterparties, and cash and non-cash collateral posted under such agreements at the end of each period were as follows:
| | | | | | | | | | | | | | | | | | | | | | | | | | | | | | | | | | | | | | |
| | December 26, 2020 |
| | | | | | | | Gross Amounts Not Offset in the Balance Sheet | | |
| (In Millions) | | Gross Amounts Recognized | | Gross Amounts Offset in the Balance Sheet | | Net Amounts Presented in the Balance Sheet | | Financial Instruments | | Cash and Non-Cash Collateral Received or Pledged | | Net Amount |
| Assets: | | | | | | | | | | | | |
| Derivative assets subject to master netting arrangements | | $ | 2,235 | | | $ | — | | | $ | 2,235 | | | $ | (264) | | | $ | (1,904) | | | $ | 67 | |
| Reverse repurchase agreements | | 1,900 | | | — | | | 1,900 | | | — | | | (1,900) | | | — | |
| Total assets | | 4,135 | | | — | | | 4,135 | | | (264) | | | (3,804) | | | 67 | |
| Liabilities: | | | | | | | | | | | | |
| Derivative liabilities subject to master netting arrangements | | 711 | | | — | | | 711 | | | (264) | | | (447) | | | — | |
| | | | | | | | | | | | |
| Total liabilities | | $ | 711 | | | $ | — | | | $ | 711 | | | $ | (264) | | | $ | (447) | | | $ | — | |
| | | | | | | | | | | |
| Financial Statements | Notes to Consolidated Financial Statements | 100 |
| | | | | | | | | | | | | | | | | | | | | | | | | | | | | | | | | | | | | | |
| | December 28, 2019 |
| | | | | | | | Gross Amounts Not Offset in the Balance Sheet | | |
| (In Millions) | | Gross Amounts Recognized | | Gross Amounts Offset in the Balance Sheet | | Net Amounts Presented in the Balance Sheet | | Financial Instruments | | Cash and Non-Cash Collateral Received or Pledged | | Net Amount |
| Assets: | | | | | | | | | | | | |
| Derivative assets subject to master netting arrangements | | $ | 974 | | | $ | — | | | $ | 974 | | | $ | (144) | | | $ | (808) | | | $ | 22 | |
| Reverse repurchase agreements | | 1,850 | | | — | | | 1,850 | | | — | | | (1,850) | | | — | |
| Total assets | | 2,824 | | | — | | | 2,824 | | | (144) | | | (2,658) | | | 22 | |
| Liabilities: | | | | | | | | | | | | |
| Derivative liabilities subject to master netting arrangements | | 262 | | | — | | | 262 | | | (144) | | | (72) | | | 46 | |
| | | | | | | | | | | | |
| Total liabilities | | $ | 262 | | | $ | — | | | $ | 262 | | | $ | (144) | | | $ | (72) | | | $ | 46 | |
We obtain and secure available collateral from counterparties against obligations, including securities lending transactions and reverse repurchase agreements, when we deem it appropriate.
Derivatives in Cash Flow Hedging Relationships
The before-tax net gains or losses attributed to the effective portion of cash flow hedges recognized in other comprehensive income (loss) were $806 million net gains in 2020 ($11 million net losses in 2019 and $310 million net losses in 2018). Substantially all of our cash flow hedges are foreign currency contracts for all periods presented.
Amounts excluded from effectiveness testing were insignificant during all periods presented.
For information on the unrealized holding gains (losses) on derivatives reclassified out of accumulated other comprehensive income into the Consolidated Statements of Income, see "Note 15: Other Comprehensive Income (Loss)."
Derivatives in Fair Value Hedging Relationships
The effects of derivative instruments designated as fair value hedges, recognized in interest and other, net for each period were as follows:
| | | | | | | | | | | | | | | | | | | | |
| | Gains (Losses) Recognized in Statement of Income on Derivatives |
| Years Ended (In Millions) | | Dec 26, 2020 | | Dec 28, 2019 | | Dec 29, 2018 |
| Interest rate contracts | | $ | 817 | | | $ | 1,071 | | | $ | (138) | |
| Hedged items | | (817) | | | (1,071) | | | 138 | |
| Total | | $ | — | | | $ | — | | | $ | — | |
The amounts recorded on the Consolidated Balance Sheet related to cumulative basis adjustments for fair value hedges for each period were as follows:
| | | | | | | | | | | | | | | | | | | | | | | | | | |
| Line Item in the Consolidated Balance Sheet in Which the Hedged Item Is Included | | Carrying Amount of the Hedged Item Asset/(Liabilities) | | Cumulative Amount of Fair Value Hedging Adjustment Included in the Carrying Amount Assets/(Liabilities) |
| Years Ended (In Millions) | | Dec 26, 2020 | | Dec 28, 2019 | | Dec 26, 2020 | | Dec 28, 2019 |
| Long-term debt | | $ | (13,495) | | | $ | (12,678) | | | $ | (1,498) | | | $ | (681) | |
Derivatives Not Designated as Hedging Instruments
The effects of derivative instruments not designated as hedging instruments on the Consolidated Statements of Income for each period were as follows:
| | | | | | | | | | | | | | | | | | | | | | | | | | |
| Years Ended (In Millions) | | Location of Gains (Losses)
Recognized in Income on Derivatives | | Dec 26, 2020 | | Dec 28, 2019 | | Dec 29, 2018 |
| Foreign currency contracts | | Interest and other, net | | $ | (572) | | | $ | 204 | | | $ | 372 | |
| Interest rate contracts | | Interest and other, net | | (90) | | | (32) | | | 9 | |
| Other | | Various | | 284 | | | 297 | | | (147) | |
| Total | | $ | (378) | | | $ | 469 | | | $ | 234 | |
| | | | | | | | | | | |
| Financial Statements | Notes to Consolidated Financial Statements | 101 |
| | | | | |
| Note 17 : | Retirement Benefit Plans |
Defined Contribution Plans
We provide tax-qualified defined contribution plans for the benefit of eligible employees, former employees, and retirees in the U.S. and certain other countries. The plans are designed to provide employees with an accumulation of funds for retirement on a tax-deferred basis. For the benefit of eligible U.S. employees, we also provide an unfunded non-tax-qualified supplemental deferred compensation plan for certain highly compensated employees.
We expensed $398 million for matching contributions based on the amount of employee contributions under the U.S. qualified defined contribution and non-qualified deferred compensation plans in 2020. Prior to 2020, the contributions were discretionary and we expensed $379 million in 2019 and $372 million in 2018.
U.S. Retiree Medical Plan
Upon retirement, we provide certain benefits to eligible U.S. employees who were hired prior to 2014 under the U.S. Retiree Medical Plan. The benefits can be used to pay all or a portion of the cost to purchase eligible coverage in a medical plan.
As of December 26, 2020 and December 28, 2019, the projected benefit obligation was $741 million and $633 million, which used the discount rate of 2.4% and 3.3%. The December 26, 2020 and December 28, 2019 corresponding fair value of plan assets was $600 million and $553 million.
The investment strategy for U.S. Retiree Medical Plan assets is to invest primarily in liquid assets, due to the level of expected future benefit payments. The assets are invested solely in a tax-aware global equity portfolio, which is actively managed by an external investment manager. The tax-aware global equity portfolio is composed of a diversified mix of equities in developed countries. As of December 26, 2020, substantially all of the U.S. Retiree Medical Plan assets were invested in exchange-traded equity securities and were measured at fair value using Level 1 inputs.
The estimated benefit payments for this plan over the next 10 years are as follows:
| | | | | | | | | | | | | | | | | | | | | | | | | | | | | | | | | | | | | | |
| (In Millions) | | 2021 | | 2022 | | 2023 | | 2024 | | 2025 | | 2026-2030 |
| Postretirement Medical Benefits | | $ | 37 | | | $ | 38 | | | $ | 39 | | | $ | 40 | | | $ | 41 | | | $ | 218 | |
Pension Benefit Plans
We provide defined-benefit pension plans in certain countries, most significantly the U.S., Ireland, Israel, and Germany. A substantial majority of the plans' benefits have been frozen.
| | | | | | | | | | | |
| Financial Statements | Notes to Consolidated Financial Statements | 102 |
Benefit Obligation and Plan Assets for Pension Benefit Plans
The vested benefit obligation for a defined-benefit pension plan is the actuarial present value of the vested benefits to which the employee is currently entitled based on the employee's expected date of separation or retirement.
| | | | | | | | | | | | | | |
(In Millions) | | Dec 26, 2020 | | Dec 28, 2019 |
| Changes in projected benefit obligation: | | | | |
| Beginning projected benefit obligation | | $ | 4,284 | | | $ | 3,433 | |
| Service cost | | 49 | | | 54 | |
| Interest cost | | 97 | | | 113 | |
| Actuarial (gain) loss | | 373 | | | 829 | |
| Currency exchange rate changes | | 261 | | | (2) | |
| | | | |
| Plan settlements | | (79) | | | (57) | |
| Other | | (56) | | | (86) | |
Ending projected benefit obligation1 | | 4,929 | | | 4,284 | |
| | | | |
| Changes in fair value of plan assets: | | | | |
| Beginning fair value of plan assets | | 2,654 | | | 2,551 | |
| Actual return on plan assets | | 203 | | | 193 | |
| Currency exchange rate changes | | 113 | | 3 |
| | | | |
| Other | | (92) | | | (93) | |
Ending fair value of plan assets2 | | 2,878 | | | 2,654 | |
| | | | |
| Net unfunded status | | $ | 2,051 | | | $ | 1,630 | |
| | | | |
| Amounts recognized in the Consolidated Balance Sheets | | | | |
| | | | |
| Other long-term liabilities | | $ | 2,051 | | | $ | 1,630 | |
Accumulated other comprehensive loss (income), before tax3 | | $ | 1,911 | | | $ | 1,730 | |
| | | | |
Accumulated benefit obligation4 | | $ | 4,429 | | | $ | 3,862 | |
1 The projected benefit obligation was approximately 35% in the U.S. and 65% outside of the U.S. as of December 26, 2020 and December 28, 2019.
2 The fair value of plan assets was approximately 55% in the U.S. and 45% outside of the U.S. as of December 26, 2020 and December 28, 2019.
3 The accumulated other comprehensive loss (income), before tax, was approximately 35% in the U.S. and 65% outside of the U.S. as of December 26, 2020 and December 28, 2019.
4 All plans had accumulated benefit obligations and projected benefit obligations in excess of plan assets for all periods presented.
Changes in actuarial gains and losses in the projected benefit obligation are generally driven by discount rate movement. We use the corridor approach to amortize actuarial gains and losses. Under this approach, net actuarial gains or losses in excess of 10% of the larger of the projected benefit obligation or the fair value of plan assets are amortized on a straight-line basis.
Assumptions for Pension Benefit Plans
| | | | | | | | | | | | | | |
| | Dec 26, 2020 | | Dec 28, 2019 |
| Weighted average actuarial assumptions used to determine benefit obligations | | | | |
| Discount rate | | 1.9 | % | | 2.3 | % |
| Rate of compensation increase | | 3.2 | % | | 3.5 | % |
| | | | | | | | | | | | | | | | | | | | |
| | 2020 | | 2019 | | 2018 |
| Weighted average actuarial assumptions used to determine costs | | | | | | |
| Discount rate | | 2.3 | % | | 3.4 | % | | 3.0 | % |
| Expected long-term rate of return on plan assets | | 3.3 | % | | 4.7 | % | | 4.7 | % |
| Rate of compensation increase | | 3.2 | % | | 3.5 | % | | 3.3 | % |
We establish the discount rate for each pension plan by analyzing current market long-term bond rates and matching the bond maturity with the average duration of the pension liabilities.
We establish the long-term expected rate of return by developing a forward-looking, long-term return assumption for each pension fund asset class, taking into account factors such as the expected real return for the specific asset class and inflation. A single, long-term rate of return is then calculated as the weighted average of the target asset allocation percentages and the long-term return assumption for each asset class.
| | | | | | | | | | | |
| Financial Statements | Notes to Consolidated Financial Statements | 103 |
Funding
Our practice is to fund the various pension plans in amounts sufficient to meet the minimum requirements of applicable local laws and regulations. Additional funding may be provided as deemed appropriate. Funding for the U.S. Retiree Medical Plan is discretionary under applicable laws and regulations; additional funding may be provided as deemed appropriate.
On a worldwide basis, our pension and retiree medical plans were 61% funded as of December 26, 2020. The U.S. Pension Plan, which accounts for 31% of the worldwide pension and retiree medical benefit obligations, was 89% funded. Funded status is not indicative of our ability to pay ongoing pension benefits or of our obligation to fund retirement trusts. Required pension funding for U.S. retirement plans is determined in accordance with ERISA, which sets required minimum contributions. Cumulative company funding to the U.S. Pension Plan currently exceeds the minimum ERISA funding requirements.
Net Periodic Benefit Cost
The net periodic benefit cost for pension and U.S. retiree medical benefits was $164 million in 2020 ($135 million in 2019 and $197 million in 2018).
Pension Plan Assets
| | | | | | | | | | | | | | | | | | | | | | | | | | | | | | | | |
| | December 26, 2020 | | Dec 28, 2019 |
| | Fair Value Measured at Reporting Date Using | | | | |
(In Millions) | | Level 1 | | Level 2 | | Level 3 | | Total | | Total |
| Equity securities | | $ | — | | | $ | 320 | | | $ | — | | | $ | 320 | | | $ | 278 | |
| Fixed income | | — | | | 114 | | | 21 | | | 135 | | | 119 | |
| Assets measured by fair value hierarchy | | $ | — | | | $ | 434 | | | $ | 21 | | | $ | 455 | | | $ | 397 | |
| Assets measured at net asset value | | | | | | | | 2,401 | | | 2,236 | |
| Cash and cash equivalents | | | | | | | | 22 | | | 21 | |
| Total pension plan assets at fair value | | | | | | | | $ | 2,878 | | | $ | 2,654 | |
U.S. Plan Assets
The investment strategy for U.S. Pension Plan assets is to manage the funded status volatility, taking into consideration the investment horizon and expected volatility to help ensure that sufficient assets are available to pay pension benefits as they come due. The allocation to each asset class will fluctuate with market conditions, such as volatility and liquidity concerns, and will typically be rebalanced when outside the target ranges, which are approximately 90% fixed income and 10% equity investments. During 2020, the U.S. Pension Plan assets were invested in collective investment trust funds, which are measured at net asset value.
Non-U.S. Plan Assets
The investments of the non-U.S. plans are managed by insurance companies, pension funds, or third-party trustees, consistent with regulations or market practice of the country where the assets are invested. The investment manager makes investment decisions within the guidelines set by Intel or local regulations. Investments managed by qualified insurance companies or pension funds under standard contracts follow local regulations, and we are not actively involved in their investment strategies. For the assets that we have discretion to set investment guidelines, the assets are invested in developed country equity investments and fixed-income investments, either through index funds or direct investment. In general, the investment strategy is designed to accumulate a diversified portfolio among markets, asset classes, or individual securities to reduce market risk and to help ensure that the pension assets are available to pay benefits as they come due. The target allocation of the non-U.S. plan assets that we have control over was approximately 45% fixed income, 35% equity, and 20% hedge fund investments in 2020.
The equity investments in the non-U.S. plan assets are invested in a diversified mix of equities of developed countries, including the U.S., and emerging markets throughout the world.
We have control over the investment strategy related to the majority of the assets measured at net asset value, which are invested in hedge funds, bond index funds, and equity index funds.
Estimated Future Benefit Payments for Pension Benefit Plans
Estimated benefit payments over the next 10 years are as follows:
| | | | | | | | | | | | | | | | | | | | | | | | | | | | | | | | | | | | | | |
(In Millions) | | 2021 | | 2022 | | 2023 | | 2024 | | 2025 | | 2026-2030 |
| Pension benefits | | $ | 158 | | | $ | 151 | | | $ | 155 | | | $ | 149 | | | $ | 154 | | | $ | 814 | |
| | | | | | | | | | | |
| Financial Statements | Notes to Consolidated Financial Statements | 104 |
| | | | | |
| Note 18 : | Employee Equity Incentive Plans |
Our equity incentive plans are broad-based, long-term programs intended to attract and retain talented employees and align stockholder and employee interests. Our plans include our 2006 Plan and our 2006 ESPP.
Under the 2006 Plan, 866 million shares of common stock have been authorized for issuance as equity awards to employees and non-employee directors through June 2023. As of December 26, 2020, 193 million shares of common stock remained available for future grants.
Under the 2006 Plan, we grant RSUs and stock options. We grant RSUs with a service condition as well as RSUs with a market condition, performance condition, and a service condition, which we call PSUs. Prior to 2019, we granted OSUs, which were RSUs with only market and service conditions. PSUs are granted to a group of senior officers and employees. For PSUs granted in 2020, the number of shares of our common stock to be received at vesting will range from 0% to 200% of the target grant amount, equally based on two metrics: our three-year cumulative non-GAAP EPS growth relative to a target rate and TSR of our common stock measured against the benchmark TSR of the S&P 500 IT Sector Index over a three-year period. TSR is a measure of stock price appreciation plus any dividends paid in this performance period. As of December 26, 2020, 12 million PSUs and OSUs were outstanding. PSUs vest three years from the grant date, and OSUs, which were granted prior to 2019, generally vest three years and one month from the grant date. Other RSU awards and option awards generally vest over four years from the grant date. Stock options generally expire 10 years from the date of grant.
Share-Based Compensation
Share-based compensation recognized in 2020 was $1.9 billion ($1.7 billion in 2019 and $1.5 billion in 2018). During 2020, the tax benefit that we realized for the tax deduction from share-based awards totaled $380 million ($359 million in 2019 and $399 million in 2018).
We estimate the fair value of RSUs with a service condition or performance condition using the value of our common stock on the date of grant, reduced by the present value of dividends expected to be paid on our shares of common stock prior to vesting. We estimate the fair value of RSUs with a market condition using a Monte Carlo simulation model as of the date of grant using historical volatility.
Restricted Stock Units
Weighted average assumptions used in estimating grant values were as follows:
| | | | | | | | | | | | | | | | | | | | |
| | |
| | Dec 26, 2020 | | Dec 28, 2019 | | Dec 29, 2018 |
| Estimated values | | $ | 54.82 | | | $ | 48.06 | | | $ | 48.95 | |
| Risk-free interest rate | | 0.4 | % | | 2.3 | % | | 2.4 | % |
| Dividend yield | | 2.3 | % | | 2.5 | % | | 2.4 | % |
| Volatility | | 30 | % | | 25 | % | | 22 | % |
Summary of activities:
| | | | | | | | | | | | | | |
| | Number of Stock Units (In Millions) | | Weighted Average Grant-Date Fair Value |
| December 28, 2019 | | 84.1 | | | $ | 43.86 | |
| Granted | | 40.4 | | | $ | 54.82 | |
| Vested | | (33.3) | | | $ | 40.54 | |
| Forfeited | | (8.5) | | | $ | 47.89 | |
| December 26, 2020 | | 82.7 | | | $ | 50.14 | |
| Expected to vest | 76.7 | | | $ | 50.06 | |
The aggregate fair value of awards that vested in 2020 was $1.9 billion ($1.9 billion in 2019 and $2.0 billion in 2018), which represents the market value of our common stock on the date that the RSUs vested. The grant-date fair value of awards that vested in 2020 was $1.3 billion ($1.3 billion in 2019 and $1.2 billion in 2018). The number of RSUs vested includes shares of common stock that we withheld on behalf of employees to satisfy the minimum statutory tax withholding requirements. RSUs that are expected to vest are net of estimated future forfeitures.
As of December 26, 2020, unrecognized compensation costs related to RSUs granted under our equity incentive plans were $2.4 billion. We expect to recognize those costs over a weighted average period of 1.3 years.
Stock Purchase Plan
The 2006 ESPP allows eligible employees to purchase shares of our common stock at 85% of the value of our common stock on specific dates. Under the 2006 ESPP, 523 million shares of common stock are authorized for issuance through August 2026. As of December 26, 2020, 249 million shares of common stock remained available for issuance.
| | | | | | | | | | | |
| Financial Statements | Notes to Consolidated Financial Statements | 105 |
Employees purchased 21 million shares of common stock in 2020 for $876 million under the 2006 ESPP (17 million shares of common stock for $688 million in 2019 and 14 million shares of common stock for $468 million in 2018). As of December 26, 2020, unrecognized share-based compensation costs related to rights to acquire shares of common stock under the 2006 ESPP totaled $48 million. We expect to recognize those costs over a period of approximately two months.
| | | | | |
| Note 19 : | Commitments and Contingencies |
Leases
We recognized leased assets in other long-term assets of $604 million and corresponding accrued liabilities of $173 million, and other long-term liabilities of $354 million as of December 26, 2020. Our leases have remaining terms of 1 to 15 years and may include options to extend the leases for up to 38 years. The weighted average remaining lease term was 4.5 years, and the weighted average discount rate was 2.5% as of December 26, 2020.
Lease expense was $416 million in 2020 ($185 million in 2019 and $231 million in 2018), including $237 million in variable lease expense in 2020. Discounted and undiscounted lease payments under non-cancelable leases as of December 26, 2020, excluding non-lease components, were as follows:
| | | | | | | | | | | | | | | | | | | | | | | | | | | | | | | | | | | | | | | | | | | | |
| (In Millions) | | 2021 | | 2022 | | 2023 | | 2024 | | 2025 | | Thereafter | | Total |
| Lease payments | | $ | 175 | | | $ | 133 | | | $ | 96 | | | $ | 69 | | | $ | 52 | | | $ | 34 | | | $ | 559 | |
| | | | | | | | | | | | | | |
| Present value of lease payments | | | | | | | | | | | | | | $ | 527 | |
Commitments
Commitments for construction or purchase of property, plant and equipment totaled $8.6 billion as of December 26, 2020 ($10.9 billion as of December 28, 2019), a substantial majority of which will be due within the next 12 months. Other purchase obligations and commitments totaled approximately $2.6 billion as of December 26, 2020 (approximately $2.8 billion as of December 28, 2019). Other purchase obligations and commitments include payments due under various types of licenses and agreements to purchase goods or services.
Legal Proceedings
We are a party to various legal proceedings, including those noted in this section. Although management at present believes that the ultimate outcome of these proceedings, individually and in the aggregate, will not materially harm our financial position, results of operations, cash flows, or overall trends, legal proceedings and related government investigations are subject to inherent uncertainties, and unfavorable rulings or other events could occur. Unfavorable resolutions could include substantial monetary damages. In addition, in matters for which injunctive relief or other conduct remedies are sought, unfavorable resolutions could include an injunction or other order prohibiting us from selling one or more products at all or in particular ways, precluding particular business practices, or requiring other remedies. An unfavorable outcome may result in a material adverse impact on our business, results of operations, financial position, and overall trends. We might also conclude that settling one or more such matters is in the best interests of our stockholders, employees, and customers, and any such settlement could include substantial payments. Except as specifically described below, we have not concluded that settlement of any of the legal proceedings noted in this section is appropriate at this time.
European Commission Competition Matter
In 2001, the EC commenced an investigation regarding claims by Advanced Micro Devices, Inc. (AMD) that we used unfair business practices to persuade customers to buy our microprocessors. We received numerous requests for information and documents from the EC and we responded to each of those requests. The EC issued a Statement of Objections in July 2007 and held a hearing on that Statement in March 2008. The EC issued a Supplemental Statement of Objections in July 2008. In May 2009, the EC issued a decision finding that we had violated Article 82 of the EC Treaty and Article 54 of the European Economic Area Agreement. In general, the EC found that we violated Article 82 (later renumbered as Article 102 by a new treaty) by offering alleged "conditional rebates and payments" that required our customers to purchase all or most of their x86 microprocessors from us. The EC also found that we violated Article 82 by making alleged "payments to prevent sales of specific rival products." The EC imposed a fine in the amount of €1.1 billion ($1.4 billion as of May 2009), which we subsequently paid during the third quarter of 2009, and ordered us to "immediately bring to an end the infringement referred to in" the EC decision.
The EC decision contained no specific direction on whether or how we should modify our business practices. Instead, the decision stated that we should "cease and desist" from further conduct that, in the EC's opinion, would violate applicable law. We took steps, which are subject to the EC's ongoing review, to comply with that decision pending appeal. We had discussions with the EC to better understand the decision and to explain changes to our business practices.
We appealed the EC decision to the Court of First Instance (which has been renamed the General Court) in July 2009. The hearing of our appeal took place in July 2012. In June 2014, the General Court rejected our appeal in its entirety. In August 2014, we filed an appeal with the European Court of Justice. In November 2014, Intervener Association for Competitive Technologies filed comments in support of Intel's grounds of appeal. The EC and interveners filed briefs in November 2014, we filed a reply in February 2015, and the EC filed a rejoinder in April 2015. The Court of Justice held oral argument in June 2016. In October 2016, Advocate General Wahl, an advisor to the Court of Justice, issued a non-binding advisory opinion that favored Intel on a number of grounds. The Court of Justice issued its decision in September 2017, setting aside the judgment of the General Court and sending the case back to the General Court to examine whether the rebates at issue were capable of restricting competition. The General Court has appointed a panel of five judges to consider our
| | | | | | | | | | | |
| Financial Statements | Notes to Consolidated Financial Statements | 106 |
appeal of the EC's 2009 decision in light of the Court of Justice’s clarifications of the law. In November 2017, the parties filed initial "Observations" about the Court of Justice's decision and the appeal and were invited by the General Court to offer supplemental comments to each other's "Observations," which the parties submitted in March 2018. Responses to other questions posed by the General Court were filed in May and June 2018. The General Court heard oral argument in March 2020. Pending the final decision in this matter, the fine paid by Intel has been placed by the EC in commercial bank accounts where it accrues interest.
Litigation Related to Security Vulnerabilities
In June 2017, a Google research team notified us and other companies that it had identified security vulnerabilities (now commonly referred to as "Spectre" and "Meltdown") that affect many types of microprocessors, including our products. As is standard when findings like these are presented, we worked together with other companies in the industry to verify the research and develop and validate software and firmware updates for impacted technologies. On January 3, 2018, information on the security vulnerabilities was publicly reported, before software and firmware updates to address the vulnerabilities were made widely available.
Numerous lawsuits have been filed against Intel and, in certain cases, our current and former executives and directors, in U.S. federal and state courts and in certain courts in other countries relating to the Spectre and Meltdown security vulnerabilities, as well as other variants of these vulnerabilities that have since been identified.
As of January 20, 2021, consumer class action lawsuits relating to the above class of security vulnerabilities publicly disclosed since 2018 were pending in the U.S., Canada, and Israel. The plaintiffs, who purport to represent various classes of purchasers of our products, generally claim to have been harmed by Intel's actions and/or omissions in connection with the security vulnerabilities and assert a variety of common law and statutory claims seeking monetary damages and equitable relief. In the U.S., numerous individual class action suits filed in various jurisdictions were consolidated in April 2018 for all pretrial proceedings in the U.S. District Court for the District of Oregon. In March 2020, the court granted Intel's motion to dismiss the complaint in that consolidated action but granted plaintiffs leave to amend. Plaintiffs filed an amended complaint in May 2020, which Intel moved to dismiss in July 2020; argument on the motion was heard in December 2020. In Canada, in one case pending in the Superior Court of Justice of Ontario, an initial status conference has not yet been scheduled. In a second case pending in the Superior Court of Justice of Quebec, the court has stayed the case until January 2021. In Israel, two consumer class action lawsuits were filed in the District Court of Haifa. In the first case, the District Court denied the parties' joint motion to stay filed in January 2019, but to date has deferred Intel's deadline to respond to the complaint. Intel filed a motion to stay the second case pending resolution of the consolidated proceeding in the U.S., and a hearing on that motion has been scheduled for November 2020. Additional lawsuits and claims may be asserted seeking monetary damages or other related relief. We dispute the pending claims described above and intend to defend those lawsuits vigorously. Given the procedural posture and the nature of those cases, including that the pending proceedings are in the early stages, that alleged damages have not been specified, that uncertainty exists as to the likelihood of a class or classes being certified or the ultimate size of any class or classes if certified, and that there are significant factual and legal issues to be resolved, we are unable to make a reasonable estimate of the potential loss or range of losses, if any, that might arise from those matters.
In addition to these lawsuits, Intel stockholders filed multiple shareholder derivative lawsuits since January 2018 against certain current and former members of our Board of Directors and certain current and former officers, alleging that the defendants breached their duties to Intel in connection with the disclosure of the security vulnerabilities and the failure to take action in relation to alleged insider trading. The complaints sought to recover damages from the defendants on behalf of Intel. Some of the derivative actions were filed in the U.S. District Court for the Northern District of California and were consolidated, and the others were filed in the Superior Court of the State of California in San Mateo County and were consolidated. The federal court granted defendants' motion to dismiss in August 2018 on the ground that plaintiffs failed to plead facts sufficient to show they were excused from making a pre-lawsuit demand on the Board. The federal court granted plaintiffs leave to amend their complaint, but subsequently dismissed the cases in January 2019 at plaintiffs' request. The California Superior Court entered judgment in defendants' favor in August 2020 after granting defendants' motions to dismiss plaintiffs' consolidated complaint and three successive amended complaints, all for failure to plead facts sufficient to show plaintiffs were excused from making pre-lawsuit demand on the Board. Plaintiffs filed a notice of appeal of the California court's judgment in October 2020. In January 2021, another Intel stockholder filed a derivative lawsuit in the Superior Court in San Mateo County against certain current and former officers and members of our Board of Directors. The lawsuit asserts claims similar to those dismissed in August 2020, except that it alleges that the stockholder made a pre-lawsuit demand on our Board of Directors and that the demand was wrongfully refused. Defendants have not yet responded.
Institute of Microelectronics, Chinese Academy of Sciences v. Intel China, Ltd., et al.
In February 2018, the Institute of Microelectronics of the Chinese Academy of Sciences (IMECAS) sued Intel China, Ltd., Dell China, Ltd. (Dell) and Beijing JingDong Century Information Technology, Ltd. (JD) for patent infringement in the Beijing High Court. IMECAS alleges that Intel Core processors infringe Chinese patent CN 102956457 ('457 Patent). The complaint demands an injunction and damages of at least RMB 200 million plus the cost of litigation. A trial date is not yet set. In March 2018, Dell tendered indemnity to Intel, which Intel granted in April 2018. JD also tendered indemnity to Intel, which Intel granted in October 2018. In March 2018, Intel filed an invalidation request on the '457 patent with the Chinese Patent Reexamination Board (PRB). The PRB held an oral hearing in September 2018 and in February 2019 upheld the validity of the challenged claims. In January 2020, Intel filed a second invalidation request on the '457 patent with the PRB, for which the PRB heard oral argument in July 2020 and in November 2020 held the challenged apparatus claims invalid. In December 2020, Intel filed a third invalidation request on the '457 patent with the PRB. In September 2018 and March 2019, Intel filed petitions with the United States Patent & Trademark Office (USPTO) requesting institution of inter partes review (IPR) of U.S. Patent No. 9,070,719, the U.S. counterpart to the '457 patent. The USPTO denied institution of Intel's petitions in March and October 2019, respectively. In April 2019, Intel filed a request for rehearing and a petition for a Precedential Opinion Panel (POP) in the USPTO to challenge the denial of its first IPR petition, and in November 2019 Intel filed a request for rehearing on the second IPR petition. In January 2020, the USPTO denied the POP petition on the first IPR petition. In June 2020, the Patent Trial and Appeal Board denied Intel's rehearing requests on both petitions.
| | | | | | | | | | | |
| Financial Statements | Notes to Consolidated Financial Statements | 107 |
In October 2019, IMECAS filed second and third lawsuits in the Beijing IP Court, alleging infringement of Chinese Patent No. CN 102386226 ('226 Patent) based on the manufacturing and sale of Intel® Core i3 microprocessors. Defendants in the second case are Lenovo (Beijing) Co., Ltd. (Lenovo) and Beijing Jiayun Huitong Technology Development Co. Ltd. (BJHT). Defendants in the third case are Intel Corp., Intel China Co., Ltd., the Intel China Beijing Branch, Beijing Digital China Co., Ltd. (Digital China), and JD. Both complaints demand injunctions plus litigation costs and reserve the right to claim damages in unspecified amounts. No proceedings have occurred or are yet scheduled in these lawsuits. In December 2019, Lenovo tendered indemnity to Intel, which Intel granted in March 2020. In July 2020, Intel filed two invalidation requests on the '226 patent with the Chinese PRB. The PRB heard oral argument in December 2020.
Given the procedural posture and the nature of these cases, the unspecified nature and extent of damages claimed by IMECAS, and uncertainty regarding the availability of injunctive relief under applicable law, we are unable to make a reasonable estimate of the potential loss or range of losses, if any, arising from these matters. We dispute IMECAS's claims and intend to vigorously defend against them.
VLSI Technology LLC v. Intel
In October 2017, VLSI Technology LLC (VLSI) filed a complaint against Intel in the U.S. District Court for the Northern District of California alleging infringement of eight patents acquired from NXP Semiconductors, N.V. (NXP). The patents, which originated at Freescale Semiconductor, Inc. and NXP B.V., are U.S. Patent Nos. 7,268,588; 7,675,806; 7,706,207; 7,709,303; 8,004,922; 8,020,014; 8,268,672; and 8,566,836. VLSI accuses various FPGA and processor products of infringement. VLSI estimated its damages to be as high as $7.1 billion, and its complaint further sought enhanced damages, future royalties, attorneys' fees, costs, and interest. In May, June, September, and October 2018, Intel filed IPR petitions challenging the patentability of claims in all eight of the patents in-suit. The PTAB instituted review of six patents and denied institution on two patents. As a result of the institution decisions, the parties stipulated to stay the District Court action in March 2019. In December 2019 and February 2020, the PTAB found all claims of the '588 and '303 patents, and some claims of the '922 patent, to be unpatentable. The PTAB found the challenged claims of the '014, '672 and '207 patents to be patentable. Intel moved for a continuation of the stay in March 2020 as it appealed certain rulings by the PTAB. In June 2020, the District Court issued an order continuing the stay through August 2021 and setting trial for December 2022.
In June 2018, VLSI filed a second suit against Intel, in U.S. District Court for the District of Delaware, alleging infringement by various Intel processors of five additional patents acquired from NXP: U.S. Patent Nos. 6,212,663; 7,246,027; 7,247,552; 7,523,331; and 8,081,026. VLSI accused Intel of willful infringement and seeks an injunction or, in the alternative, ongoing royalties, enhanced damages, attorneys' fees and costs, and interest. In March 2019, the District Court dismissed VLSI's claims for willful infringement as to all the patents-in-suit except the '027 patent, and also dismissed VLSI's allegations of indirect infringement as to the '633, '331, and '026 patents. In June 2019, Intel filed IPR petitions challenging the patentability of claims in all five patents-in-suit. In January 2020, the District Court vacated the November 2020 trial date based on agreement of the parties; no trial date is currently set. In January and February 2020, the PTAB instituted review of the '552, '633, '331 and '026 patents and as a result, Intel moved for stay of the District Court proceedings. In May 2020, the District Court stayed the case as to the '026 and '552 patents but allowed the case to proceed on the '027 and '331 patents. For these two patents, VLSI is seeking damages of approximately $4.13 billion plus enhanced damages for the '027 patent. VLSI is no longer asserting claims from the '633 patent.
In March 2019, VLSI filed a third suit against Intel, also in U.S. District Court for the District of Delaware, alleging infringement of six more patents acquired from NXP: U.S. Patent Nos. 6,366,522; 6,663,187; 7,292,485; 7,606,983; 7,725,759; and 7,793,025. In April 2019, VLSI voluntarily dismissed this Delaware case without prejudice. In April 2019, VLSI filed three new infringement suits against Intel in the U.S. District Court for the Western District of Texas (WDTX) accusing various Intel processors of infringement. The three suits collectively assert the same six patents from the voluntarily dismissed Delaware case plus two additional patents acquired from NXP, U.S. Patent Nos. 7,523,373 and 8,156,357. VLSI accuses Intel of willful infringement and seeks an injunction or, in the alternative, ongoing royalties, enhanced damages, attorneys' fees and costs, and interest. Specifically, VLSI is seeking damages of approximately $11 billion collectively in the Texas cases, plus enhanced damages for alleged willful infringement. In the first Texas case, VLSI is asserting the '373 and '759 patents. (In December 2020, the court granted Intel summary judgment of non-infringement on the '357 patent.) VLSI seeks approximately $2.5 billion plus enhanced damages for alleged willful infringement in that case. That case was originally scheduled for trial in November 2020, but the court has now moved trial to February 2021. In October and November 2019 and in February 2020, Intel filed IPR petitions on certain asserted claims across six of the patents-in-suit in WDTX. Between May and October 2020, the PTAB denied all of these requests, and Intel has requested a rehearing, as well as a review from the Precedential Opinion Panel (POP), as to all petitions. All requests for POP review were denied in October and December 2020, and in December 2020 requests for rehearing were denied as to petitions filed on the '373 and '759 patents.
In May 2019, VLSI filed a case in Shenzhen Intermediate People’s Court against Intel, Intel (China) Co., Ltd., Intel Trading (Shanghai) Co., Ltd., and Intel Products (Chengdu) Co., Ltd. VLSI asserts Chinese Patent 201410094015.9 accusing certain Intel Core processors of infringement. VLSI requests an injunction as well as RMB 1.3 million in damages. Defendants filed an invalidation petition in October 2019 with the PRB, but no hearing date has been set. In May 2020, defendants filed a motion to stay the trial court proceedings pending a determination on invalidity. The court has not yet ruled on the motion to stay. The court held the first evidentiary hearing in November 2020.
In May 2019, VLSI filed a second case in Shanghai Intellectual Property Court against Intel (China) Co., Ltd., Intel Trading (Shanghai) Co., Ltd., and Intel Products (Chengdu) Co., Ltd. VLSI asserts Chinese Patent 201080024173.7. VLSI accuses certain Intel core processors and seeks an injunction. Defendants filed with the PRB an invalidation petition in October 2019. No hearing date has been set. In June 2020, defendants filed a motion to stay the trial court proceedings pending a determination on invalidity. The court has not yet ruled on the motion to stay. The court held its first evidentiary hearing in September 2020. The Court held a second evidentiary hearing and trial in December 2020 and has not yet issued a ruling.
| | | | | | | | | | | |
| Financial Statements | Notes to Consolidated Financial Statements | 108 |
In November 2019, Intel, along with Apple Inc., filed a complaint against Fortress Investment Group LLC, Fortress Credit Co. LLC, Uniloc 2017 LLC, Uniloc USA, Inc., Uniloc Luxembourg S.A.R.L., VLSI, INVT SPE LLC, Inventergy Global, Inc., DSS Technology Management, Inc., IXI IP, LLC, and Seven Networks, LLC. Plaintiffs allege violations of Section 1 of the Sherman Act by certain defendants, Section 7 of the Clayton Act by certain defendants, and California Business and Professions Code section 17200 by all defendants based on defendants' unlawful aggregation of patents. In February 2020, defendants moved to dismiss plaintiffs' complaint. In July 2020, the court granted defendants' motion to dismiss with leave to amend. The court dismissed antitrust claims related to two DSS patents with prejudice. The plaintiffs filed an amended complaint in August 2020, and defendants moved to dismiss in September 2020. The court heard defendants' motion to dismiss the amended complaint in December 2020 and granted the motion in January 2021, with leave to further amend.
In June 2020, affiliates controlled by Fortress Investment Group, which also controls VLSI, acquired Finjan Holdings, Inc. Intel had signed a "Settlement, Release and Patent License Agreement" with Finjan in 2012, acquiring a license to the patents of Finjan and its affiliates, current or future, through a capture period of November 20, 2022. The agreement also contains covenants wherein Finjan agrees to cause its affiliates to comply with the agreement. As such, Intel maintains that it now has a license to the patents of VLSI, which has become a Finjan affiliate, and that Finjan must cause VLSI to dismiss its suits against Intel. In August 2020, Intel started dispute resolution proceedings under the agreement. As a part of this dispute resolution process, Intel and Finjan held a mediation in December 2020, but failed to resolve their differences. Intel filed suit to enforce its rights under the License Agreement with Finjan in January 2021 in Delaware Chancery Court. In September 2020, Intel filed motions to stay the Texas, Delaware, and Shanghai matters pending resolution of its dispute with Finjan. In November 2020, Intel filed a motion to stay the Shenzhen matter pending resolution of its dispute with Finjan. In November 2020, the Delaware Court denied Intel's motion to stay. The other stay motions remain pending. Finally, Intel filed a motion to amend its answer in the Texas matters to add a license defense in November 2020. The Court has yet to rule on the motion.
Given the procedural posture and the nature of these cases and that there are significant factual and legal issues to be resolved, we are unable to make a reasonable estimate of the potential loss or range of losses, if any, arising from these matters. We dispute VLSI's claims and intend to vigorously defend against them.
Litigation Related to 7nm Product Delay Announcement
Starting in July 2020, five securities class action lawsuits were filed in the United States District Court for the Northern District of California against Intel and certain current and former officers based on Intel’s July 2020 announcement of 7nm product delays. The plaintiffs, who purport to represent classes of acquirers of Intel stock between October 2019 and July 2020, generally allege that the defendants violated securities laws by making false and misleading statements about the timeline for 7nm products in light of subsequently announced delays. In October 2020, the court consolidated the lawsuits and appointed lead plaintiffs, and in January 2021 the lead plaintiffs filed a consolidated complaint. We dispute the claims described above and intend to defend the lawsuits vigorously. Given the procedural posture and the nature of these cases, including that the proceedings are in the early stages, that alleged damages have not been specified, that uncertainty exists as to the likelihood of a class or classes being certified or the ultimate size of any class or classes if certified, and that there are significant factual and legal issues to be resolved, we are unable to make a reasonable estimate of the potential loss or range of losses, if any, that might arise from these matters.
In addition to the securities lawsuits, several Intel stockholders have filed derivative lawsuits against certain members of our Board of Directors and certain current and former officers based on Intel’s July 2020 announcement of 7nm product delays. The complaints, which were filed in the United States District Court for the District of Delaware in December 2020, allege that defendants breached their fiduciary duties to Intel by either making or allowing the company to make alleged misstatements about the timeline for 7nm products during the class period alleged in the securities litigation. Certain of the complaints also allege claims under Section 14(a) of the Securities Exchange Act of 1934. The complaints seek to recover damages on behalf of Intel. Defendants have not yet responded.
| | | | | | | | | | | |
| Financial Statements | Notes to Consolidated Financial Statements | 109 |
We use terms throughout our document that are specific to Intel or that are abbreviations that may not be commonly known or used. Below is a list of these terms used in our document.
| | | | | | | | |
| Term | | Definition |
| | |
| 2006 Plan | | 2006 Equity Incentive Plan |
| 2006 ESPP | | 2006 Employee Stock Purchase Plan |
| 2009 Debentures | | 3.25% junior subordinated convertible debentures due 2039 |
| | |
| | |
| 2019 Arizona Bonds | | Bonds issued in 2019 by the Industrial Development Authority of the City of Chandler, Arizona that are our unsecured obligations |
| 2019 Oregon Bonds | | Bonds issued in 2019 by the State of Oregon Business Development Commission that are our unsecured obligations |
| | |
| 5G | | The fifth-generation mobile network, which is expected to bring dramatic improvements in network speeds and latency, and which we view as a transformative technology and opportunity for many industries |
| | |
| ADAS | | Advanced driver-assistance systems |
| Adjacent products | | All of our non-platform products for CCG, DCG, and IOTG, such as modem, Ethernet and silicon photonics, as well as Mobileye, Non-Volatile Memory Solutions Group (NSG), and Programmable Solutions Group (PSG) products. Combined with our platform products, adjacent products form comprehensive platform solutions to meet customer needs |
| | |
| | |
| ASIC | | Application-specific integrated circuit |
| ASR | | Accelerated share repurchase |
| AV | | Autonomous vehicle |
| | |
| CAGR | | Compound annual growth rate |
| | |
| CDP | | A nonprofit organization that runs a global disclosure system for investors, companies, cities, states, and regions to manage their environmental impacts |
| | |
| CODM | | Chief operating decision maker |
| | |
| Cloudification | | Refers to the application of cloud technologies and business practices to infrastructure outside the centralized cloud data center—bringing the same programmability, flexibility, and economies of scale to the network and edge |
| CPU | | Processor or central processing unit |
| | |
| Data-centric businesses | | Includes our Data Center Group (DCG), Internet of Things Group (IOTG), Mobileye, Non-Volatile Memory Solutions Group (NSG), Programmable Solutions Group (PSG), and all other businesses |
| | |
| | |
| EC | | European Commission |
| EDA | | Electronic design automation refers to tools used to design and verify electronic systems such as integrated circuits and printed circuit boards |
| Edge computing or intelligent edge | | Edge computing places resources to move, store, and process data closer to where data is generated and consumed |
| | |
| EMIB | | Embedded multi-die interconnect bridge, a form of "2.5D" packaging technology developed by Intel that enables high-density interconnect of heterogeneous chips |
| | |
| | |
| ERISA | | Employee Retirement Income Security Act |
| | |
| Form 10-K | | Annual Report on Form 10-K |
| Foveros | | Intel's high-performance three-dimensional stacked chip architecture |
| FPGA | | Field-programmable gate array |
| | |
| GPU | | Graphics processing unit |
| IDM | | Integrated device manufacturer |
| IEEE | | Institute of Electrical and Electronics Engineers |
| IMFT | | IM Flash Technologies, LLC |
| | |
| | |
| | |
| Internet of Things | | Refers to the Internet of Things market in which we sell our IOTG and Mobileye products |
| | |
| | |
| I/O | | Input/output |
| IP | | Intellectual property |
| | |
| | |
|
| | |
| | |
| L2+ | | Level 2+ of autonomous driving; the system controls both steering and acceleration using a multi-camera sensor suite and/or high-definition maps to enhance and solidify L2 capabilities |
| | |
| | |
| | |
| MaaS | | Mobility-as-a-Service |
| McAfee | | Business, post divestiture of Intel Security Group in Q2 2017, in which we retained an interest in as part of our investment strategy |
| MD&A | | Management's Discussion & Analysis |
| | |
| MG&A | | Marketing, general and administrative |
| | |
| NAND | | NAND flash memory |
| | | | | | | | |
| NIC | | Network interface controller |
| nm | | Nanometer |
| | |
| | |
| ODM | | Original design manufacturer |
| OEM | | Original equipment manufacturer |
| | |
| | |
| | |
| | |
| PC-centric business | | Our Client Computing Group (CCG) business, including both platform and adjacent products |
| Platform products | | A microprocessor (CPU) and chipset, a stand-alone SoC, or a multichip package, based on Intel® architecture. Platform products are primarily used in solutions sold through the CCG, DCG, and IOTG segments |
| PLD | | Programmable logic device |
| Program (specific to Mobileye business) | | A process that takes two to three years of intense activity with the carmaker and Tier 1 after a design win until Mobileye technology is launched into production |
| PRQ | | Product release qualification, which is the milestone when costs to manufacture a product are included in inventory valuation |
| | |
| | |
| QLC | | Quad-level cell |
| R&D | | Research and development |
| RDFV | | Readily determinable fair value |
| REM | | Road Experience Management |
| | |
| RSU | | Restricted stock unit |
| | |
| | |
| | |
| | |
| SEC | | U.S. Securities and Exchange Commission |
| | |
| SoC | | A System-on-a-Chip, integrates most of the components of a computer or other electronic system into a single silicon chip. We offer a range of SoC platform products in DCG, IOTG, and CCG. In our DCG business, we offer SoCs across many market segments for a variety of applications, including products targeted for 5G base stations and network infrastructure. |
| | |
| | |
| SSD | | Solid-state drive |
| TAM | | Total addressable market |
| Tax Reform | | U.S. Tax Cuts and Jobs Act |
| TCFD | | Task Force on Climate-Related Financial Disclosures |
| TLC | | Triple-level cell |
| | |
| | |
| TME | | Total Memory Encryption, the baseline capability for memory encryption with a single ephemeral key. Provides the capability to encrypt the entirety of the physical memory of a system. |
| TSR | | Total stockholder return |
| UNECE | | United Nations Economic Commission for Europe |
| | |
| | |
| U.S. GAAP | | U.S. Generally Accepted Accounting Principles |
| U.S. Pension Plan | | U.S. Intel Minimum Pension Plan |
| U.S. Retiree Medical Plan | | U.S. Postretirement Medical Benefits Plan |
| VPU | | Vision processing unit |
| Wind River | | Wind River Systems, Inc. (divested in Q2 2018) |
| | |
| xPU | | A term for processors that are designed for one of four major computing architectures: CPU, GPU, AI accelerator, and FPGA |
| | | | | |
| Financial Information by Quarter (Unaudited) | |
| |
| | | | | | | | | | | | | | | | | | | | | | | | | | |
2020 for Quarter Ended
(In Millions, Except Per Share Amounts) | | December 26 | | September 26 | | June 27 | | March 28 |
| Net revenue | | $ | 19,978 | | | $ | 18,333 | | | $ | 19,728 | | | $ | 19,828 | |
| Gross margin | | $ | 11,348 | | | $ | 9,741 | | | $ | 10,507 | | | $ | 12,016 | |
| Net income | | $ | 5,857 | | | $ | 4,276 | | | $ | 5,105 | | | $ | 5,661 | |
| Earnings per share—basic | | $ | 1.43 | | | $ | 1.02 | | | $ | 1.20 | | | $ | 1.33 | |
| Earnings per share—diluted | | $ | 1.42 | | | $ | 1.02 | | | $ | 1.19 | | | $ | 1.31 | |
| Dividends per share of common stock: | | | | | | | | |
| Declared | | $ | — | | | $ | 0.66 | | | $ | — | | | $ | 0.66 | |
| Paid | | $ | 0.33 | | | $ | 0.33 | | | $ | 0.33 | | | $ | 0.33 | |
| | | | | | | | | | | | | | | | | | | | | | | | | | |
2019 for Quarter Ended
(In Millions, Except Per Share Amounts) | | December 28 | | September 28 | | June 29 | | March 30 |
| Net revenue | | $ | 20,209 | | | $ | 19,190 | | | $ | 16,505 | | | $ | 16,061 | |
| Gross margin | | $ | 11,878 | | | $ | 11,295 | | | $ | 9,878 | | | $ | 9,089 | |
| Net income | | $ | 6,905 | | | $ | 5,990 | | | $ | 4,179 | | | $ | 3,974 | |
| Earnings per share—basic | | $ | 1.60 | | | $ | 1.36 | | | $ | 0.94 | | | $ | 0.88 | |
| Earnings per share—diluted | | $ | 1.58 | | | $ | 1.35 | | | $ | 0.92 | | | $ | 0.87 | |
| Dividends per share of common stock: | | | | | | | | |
| Declared | | $ | — | | | $ | 0.63 | | | $ | — | | | $ | 0.63 | |
| Paid | | $ | 0.315 | | | $ | 0.315 | | | $ | 0.315 | | | $ | 0.315 | |
Inherent Limitations on Effectiveness of Controls
Our management, including the principal executive officer and principal financial officer, does not expect that our disclosure controls and procedures or our internal control over financial reporting will prevent or detect all errors and all fraud. A control system, no matter how well-designed and operated, can provide only reasonable, not absolute, assurance that the control system's objectives will be met. The design of a control system must reflect the fact that there are resource constraints, and the benefits of controls must be considered relative to their costs. Further, because of the inherent limitations in all control systems, no evaluation of controls can provide absolute assurance that misstatements due to error or fraud will not occur or that all control issues and instances of fraud, if any, have been detected.
Due to the COVID-19 pandemic, a significant portion of our employees are working from home. Established business continuity plans remain activated to mitigate the impact to our control environment, operating procedures, data, and internal controls. The design of our processes and controls allows for remote execution with accessibility to secure data.
Evaluation of Disclosure Controls and Procedures
Based on management's evaluation (with the participation of our principal executive officer and principal financial officer), as of the end of the period covered by this report, our principal executive officer and principal financial officer have concluded that our disclosure controls and procedures (as defined in Rules 13a-15(e) and 15d-15(e) under the Securities Exchange Act of 1934, as amended (the Exchange Act)), are effective to provide reasonable assurance that information required to be disclosed by us in reports that we file or submit under the Exchange Act is recorded, processed, summarized, and reported within the time periods specified in SEC rules and forms, and is accumulated and communicated to management, including our principal executive officer and principal financial officer, as appropriate, to allow timely decisions regarding required disclosure.
Changes in Internal Control Over Financial Reporting
There were no changes to our internal control over financial reporting (as defined in Rules 13a-15(f) and 15d-15(f) under the Exchange Act) that occurred during the quarter ended December 26, 2020 that have materially affected, or are reasonably likely to materially affect, our internal control over financial reporting.
Management Report on Internal Control Over Financial Reporting
Our management is responsible for establishing and maintaining adequate internal control over financial reporting (as defined in Rules 13a-15(f) and 15d-15(f) under the Exchange Act) to provide reasonable assurance regarding the reliability of our financial reporting and the preparation of Consolidated Financial Statements for external purposes in accordance with U.S. GAAP.
Management assessed our internal control over financial reporting as of December 26, 2020. Management based its assessment on criteria established in Internal Control—Integrated Framework issued by the Committee of Sponsoring Organizations of the Treadway Commission (2013 framework). Management’s assessment included evaluation of elements such as the design and operating effectiveness of key financial reporting controls, process documentation, accounting policies, and our overall control environment.
Based on this assessment, management has concluded that our internal control over financial reporting was effective as of the end of the fiscal year to provide reasonable assurance regarding the reliability of financial reporting and the preparation of Consolidated Financial Statements for external reporting purposes in accordance with U.S. GAAP. We reviewed the results of management’s assessment with the Audit Committee of our Board of Directors.
Our independent registered public accounting firm, Ernst & Young LLP, independently assessed the effectiveness of the company's internal control over financial reporting, as stated in the firm's attestation report, which is included within Financial Statements and Supplemental Details.
1.Financial Statements: See "Index to Consolidated Financial Statements" within the Consolidated Financial Statements.
2.Financial Statement Schedules; not applicable or the required information is otherwise included in the Consolidated Financial Statements and accompanying notes.
3.Exhibits: The exhibits listed in the accompanying index to exhibits are filed, furnished, or incorporated by reference as part of this Form 10-K.
Certain of the agreements filed as exhibits to this Form 10-K contain representations and warranties by the parties to the agreements that have been made solely for the benefit of the parties to the agreement. These representations and warranties:
▪may have been qualified by disclosures that were made to the other parties in connection with the negotiation of the agreements, which disclosures are not necessarily reflected in the agreements;
▪may apply standards of materiality that differ from those of a reasonable investor; and
▪were made only as of specified dates contained in the agreements and are subject to subsequent developments and changed circumstances.
Accordingly, these representations and warranties may not describe the actual state of affairs as of the date that these representations and warranties were made or at any other time. Investors should not rely on them as statements of fact.
Exhibit Index
| | | | | | | | | | | | | | | | | | | | | | | | | | | | | | | | | | | | | | |
Exhibit Number | | | | Incorporated by Reference | | Filed or
Furnished
Herewith |
Exhibit Description | | Form | | File Number | | Exhibit | | Filing
Date | |
| 2.1 | |
| | 8-K | | 000-06217 | | 2.1 | | | 10/20/2020 | | |
| 3.1 | | | | 8-K | | 000-06217 | | 3.1 | | | 5/22/2006 | | |
| 3.2 | | | | 8-K | | 000-06217 | | 3.2 | | | 1/17/2019 | | |
| 4.1 | | | | S-3ASR | | 333-132865 | | 4.4 | | | 3/30/2006 | | |
| 4.2 | | | | 10-K | | 000-06217 | | 4.2.4 | | 2/20/2008 | | |
| 4.3 | | | | 8-K | | 000-06217 | | 4.01 | | | 9/19/2011 | | |
| 4.4 | | | | 8-K | | 000-06217 | | 4.01 | | | 12/11/2012 | | |
| 4.5 | | | | 8-K | | 000-06217 | | 4.01 | | | 12/14/2012 | | |
| 4.6 | | | | 8-K | | 000-06217
| | 4.1 | | | 7/29/2015 | | |
| 4.7 | | | | 8-K | | 000-06217 | | 4.1 | | | 5/19/2016 | | |
| 4.8 | | | | 8-K | | 000-06217 | | 4.1 | | | 5/11/2017 | | |
| 4.9 | | | | 8-K | | 000-06217 | | 4.1 | | | 6/16/2017 | | |
| 4.10 | | | | 8-K | | 000-06217 | | 4.1 | | | 8/14/2017 | | |
| 4.11 | | | | 10-K | | 000-06217 | | 4.2.13 | | 2/16/2018 | | |
| | | | | | | | | | | | | | | | | | | | | | | | | | | | | | | | | | | | | | |
Exhibit Number | | | | Incorporated by Reference | | Filed or
Furnished
Herewith |
Exhibit Description | | Form | | File Number | | Exhibit | | Filing
Date | |
| 4.12 | | | | 8-K | | 000-06217 | | 4.1 | | | 11/21/2019 | | |
| 4.13 | | | | 8-K | | 000-06217 | | 4.1 | | 2/13/2020 | | |
| 4.14 | | | | 8-K | | 000-06217 | | 4.2 | | | 2/13/2020 | | |
| 4.15 | | | | 8-K | | 000-06217 | | 4.1 | | | 3/25/2020 | | |
| 4.16 | | | | 8-K | | 000-06217 | | 99.2 | | | 12/28/2015 | | |
| | Certain instruments defining the rights of holders of long-term debt of Intel Corporation are omitted pursuant to Item 601(b)(4)(iii) of Regulation S-K. Intel Corporation hereby agrees to furnish to the Securities and Exchange Commission, upon request, copies of such instruments. | | | | | | | | | | |
| 4.17 | | | | 10-K | | 000-06218 | | 4.16 | | | 1/24/2020 | | |
10.1† | | | | 10-Q | | 000-06217 | | 10.1 | | | 7/26/2019 | | |
10.1.2†
| | | | 10-Q | | 000-06217 | | 10.3 | | | 8/3/2009 | | |
10.1.3†
| | | | 10-Q | | 000-06217 | | 10.1 | | | 10/25/2018 | | |
10.1.4†
| | | | 10-Q | | 000-06217 | | 10.3 | | | 4/27/2015
| | |
10.1.5†
| | | | 10-Q | | 000-06217 | | 10.3 | | | 4/26/2019 | | |
10.1.6†
| | | | 10-Q | | 000-06217 | | 10.4 | | | 4/26/2019 | | |
10.1.7†
| | | | 10-Q | | 000-06217 | | 10.2 | | | 10/25/2018 | | |
10.1.8†
| |
| | 10-Q | | 000-06217 | | 10.8 | | | 4/26/2019 | | |
10.1.9†
| | | | 10-Q | | 000-06217 | | 10.1 | | | 4/27/2017 | | |
| | | | | | | | | | | | | | | | | | | | | | | | | | | | | | | | | | | | | | |
Exhibit Number | | | | Incorporated by Reference | | Filed or
Furnished
Herewith |
Exhibit Description | | Form | | File Number | | Exhibit | | Filing
Date | |
10.1.10†
| | | | 10-Q | | 000-06217 | | 10.3 | | | 10/25/2018 | | |
10.1.11†
| | | | 10-Q | | 000-06217 | | 10.5 | | | 4/26/2019 | | |
10.1.12†
| | | | 10-Q | | 000-06217 | | 10.1 | | 4/24/2020 | | |
10.1.13†
| | | | 10-Q | | 000-06217 | | 10.6 | | | 4/26/2019 | | |
10.1.14†
| | | | 10-Q | | 000-06217 | | 10.9 | | | 4/26/2019 | | |
10.1.15†
| | | | 10-Q | | 000-06217 | | 10.10 | | | 4/26/2019 | | |
10.1.16†
| | | | 10-Q | | 000-06217 | | 10.7 | | | 4/26/2019 | | |
10.1.17†
| | | | 10-Q | | 000-06217 | | 10.1 | | | 4/27/2015 | | |
10.1.18†
| | | | 10-Q | | 000-06217 | | 10.11 | | | 4/26/2019 | | |
10.1.19†
| | | | 10-Q | | 000-06217 | | 10.2 | | | 4/27/2017 | | |
10.2† | | | | 8-K | | 000-06217 | | 10.1 | | | 1/22/2020 | | |
10.3† | | | | 10-Q | | 000-06217 | | 10.3 | | 4/24/2020 | | |
10.4† | | | | 10-Q | | 000-06217 | | 10.1 | | | 7/24/2020 | | |
10.5† | | | | 10-K | | 000-06217 | | 10.41 | | | 2/26/2007 | | |
10.6† | | | | 10-K | | 000-06217 | | 10.15 | | | 2/22/2005 | | |
| | | | | | | | | | | | | | | | | | | | | | | | | | | | | | | | | | | | | | |
Exhibit Number | | | | Incorporated by Reference | | Filed or
Furnished
Herewith |
Exhibit Description | | Form | | File Number | | Exhibit | | Filing
Date | |
10.7† | | | | 10-Q | | 000-06217 | | 10.2 | | | 10/31/2016 | | |
| 10.8 | | | | 8-K | | 000-06217 | | 10.1 | | | 11/12/2009 | | |
10.9†† | | | | 8-K | | 000-06217 | | 10.1 | | | 1/10/2011 | | |
10.10† | | | | 8-K | | 000-06217 | | 10.1 | | | 1/31/2019 | | |
10.11† | | | | 8-K | | 000-06217 | | 10.1 | | | 4/3/2019 | | |
10.12† | | | | 10-Q | | 000-06217 | | 10.12 | | | 4/26/2019 | | |
| 21.1 | | | | | | | | | | | | X |
| 23.1 | | | | | | | | | | | | X |
| 31.1 | | | | | | | | | | | | X |
| 31.2 | | | | | | | | | | | | X |
| 32.1 | | | | | | | | | | | | X |
| 99.1 | | | | | | | | | | | | X |
| 101.INS | | XBRL Instance Document - the instance document does not appear in the Interactive Data File because its XBRL tags are embedded within the Inline XBRL document | | | | | | | | | | X |
| 101.SCH | | XBRL Taxonomy Extension Schema Document | | | | | | | | | | X |
| 101.CAL | | XBRL Taxonomy Extension Calculation Linkbase Document | | | | | | | | | | X |
| 101.DEF | | XBRL Taxonomy Extension Definition Linkbase Document | | | | | | | | | | X |
| 101.LAB | | XBRL Taxonomy Extension Label Linkbase Document | | | | | | | | | | X |
| 101.PRE | | XBRL Taxonomy Extension Presentation Linkbase Document | | | | | | | | | | X |
| 104 | | Cover Page Interactive Data File - formatted in Inline XBRL and included as Exhibit 101
| | | | | | | | | | X |
† Management contracts or compensation plans or arrangements in which directors or executive officers are eligible to participate.
†† Portions of this exhibit have been omitted pursuant to an order granting confidential treatment.
| | | | | |
| Form 10-K Cross-Reference Index | |
| |
| | | | | | | | |
| Item Number | Item | |
Part I | | |
| Item 1. | Business: | |
| General development of business | |
| | |
| Description of business | |
| | |
| Available information | |
| Item 1A. | Risk Factors | |
| Item 1B. | Unresolved Staff Comments | Not applicable |
| Item 2. | Properties | |
| Item 3. | Legal Proceedings | |
| Item 4. | Mine Safety Disclosures | Not applicable |
| | |
Part II | | |
Item 5. | Market for Registrant's Common Equity, Related Stockholder Matters and Issuer Purchases of Equity Securities | |
| Item 6. | Selected Financial Data | |
| Item 7. | Management's Discussion and Analysis of Financial Condition and Results of Operations: | |
| Results of operations | |
| Liquidity | |
| Capital resources | |
| Off balance sheet arrangements | (a) |
| Contractual obligations | |
| Critical accounting estimates and policies | |
| Item 7A. | Quantitative and Qualitative Disclosures About Market Risk | |
| Item 8. | Financial Statements and Supplementary Data | |
| Item 9. | Changes in and Disagreements with Accountants on Accounting and Financial Disclosure | Not applicable |
| Item 9A. | Controls and Procedures | |
| Item 9B. | Other Information | Not applicable |
| | |
| Part III | | |
| Item 10. | Directors, Executive Officers and Corporate Governance | |
| Item 11. | Executive Compensation | (c) |
| Item 12. | Security Ownership of Certain Beneficial Owners and Management and Related Stockholder Matters | (d) |
| Item 13. | Certain Relationships and Related Transactions, and Director Independence | (e) |
| Item 14. | Principal Accounting Fees and Services | (f) |
| | |
| Part IV | | |
| Item 15. | Exhibits and Financial Statement Schedules | |
| Item 16. | Form 10-K Summary | Not applicable |
| | |
| Signatures | | |
(a) As of December 26, 2020, we did not have any significant off-balance-sheet arrangements, as defined in Item 303(a)(4)(ii) of SEC Regulation S-K.
(b) Incorporated by reference to "Proposal 1: Election of Directors," "Corporate Governance," and "Code of Conduct" in the 2021 Proxy Statement. The information under the heading "Information about Our Executive Officers" within Other Key Information is also incorporated by reference in this section.
(c) Incorporated by reference to "Director Compensation," "Compensation Discussion and Analysis," "Report of the Compensation Committee," and "Executive Compensation" in the 2021 Proxy Statement.
(d) Incorporated by reference to "Security Ownership of Certain Beneficial Owners and Management" and "Equity Compensation Plan Information" in the 2021 Proxy Statement.
(e) Incorporated by reference to "Corporate Governance" and "Certain Relationships and Related Transactions" in the 2021 Proxy Statement.
(f) Incorporated by reference to "Report of the Audit Committee" and "Proposal 2: Ratification of Selection of Independent Registered Public Accounting Firm" in the 2021 Proxy Statement.
Pursuant to the requirements of Section 13 or 15(d) of the Securities Exchange Act of 1934, the Registrant has duly caused this report to be signed on its behalf by the undersigned, thereunto duly authorized.
| | | | | | | | | | | |
| INTEL CORPORATION
Registrant |
| | | |
| By: | | /s/ ROBERT H. SWAN |
| | | Robert H. Swan |
| | | Chief Executive Officer, Director, and Principal Executive Officer |
| | | January 21, 2021 |
Pursuant to the requirements of the Securities Exchange Act of 1934, this report has been signed below by the following persons on behalf of the Registrant and in the capacities and on the dates indicated.
| | | | | | | | | | | | | | |
| /s/ ROBERT H. SWAN | | | /s/ GEORGE S. DAVIS |
| Robert H. Swan | | | George S. Davis |
| Chief Executive Officer, Director, and Principal Executive Officer | | | Executive Vice President, Chief Financial Officer, and |
| January 21, 2021 | | | Principal Financial Officer |
| | | | January 21, 2021 |
| | | | |
| /s/ KEVIN T. MCBRIDE | | | |
| Kevin T. McBride | | | |
| Vice President of Finance, Corporate Controller, and Principal Accounting Officer | | | |
| January 21, 2021 | | | |
| | | | | | | | | | | | | | |
| /s/ JAMES J. GOETZ | | | /s/ GREGORY D. SMITH |
| James J. Goetz | | | Gregory D. Smith |
| Director | | | Director |
| January 21, 2021 | | | January 21, 2021 |
| | | | |
| /s/ ALYSSA HENRY | | | /s/ DION J. WEISLER |
| Alyssa Henry | | | Dion J. Weisler |
| Director | | | Director |
| January 21, 2021 | | | January 21, 2021 |
| | | | |
| /s/ DR. OMAR ISHRAK | | | /s/ ANDREW WILSON |
| Dr. Omar Ishrak | | | Andrew Wilson |
| Chairman of the Board and Director | | | Director |
| January 21, 2021 | | | January 21, 2021 |
| | | | |
| /s/ DR. RISA LAVIZZO-MOUREY | | | /s/ FRANK D. YEARY |
| Dr. Risa Lavizzo-Mourey | | | Frank D. Yeary |
| Director | | | Director |
| January 21, 2021 | | | January 21, 2021 |
| | | | |
| /s/ DR. TSU-JAE KING LIU | | | |
| Dr. Tsu-Jae King Liu | | | |
| Director | | | |
| January 21, 2021 | | | |
| | | | |
| | | | |
| | | | |
| | | | |
| | | | |
| | | | |