June 26, 20210000050863December 252021Q2FALSE81,55877,6454,0574,0624,0574,0620.6950.6600000508632020-12-272021-06-26xbrli:shares00000508632021-06-26iso4217:USD00000508632021-03-282021-06-2600000508632020-03-292020-06-2700000508632019-12-292020-06-270000050863us-gaap:RetainedEarningsMember2021-03-282021-06-260000050863us-gaap:RetainedEarningsMember2020-12-272021-06-26iso4217:USDxbrli:shares00000508632020-12-2600000508632019-12-2800000508632020-06-270000050863us-gaap:CommonStockIncludingAdditionalPaidInCapitalMember2021-03-270000050863us-gaap:AccumulatedOtherComprehensiveIncomeMember2021-03-270000050863us-gaap:RetainedEarningsMember2021-03-2700000508632021-03-270000050863us-gaap:AccumulatedOtherComprehensiveIncomeMember2021-03-282021-06-260000050863us-gaap:CommonStockIncludingAdditionalPaidInCapitalMember2021-03-282021-06-260000050863us-gaap:CommonStockIncludingAdditionalPaidInCapitalMember2021-06-260000050863us-gaap:AccumulatedOtherComprehensiveIncomeMember2021-06-260000050863us-gaap:RetainedEarningsMember2021-06-260000050863us-gaap:CommonStockIncludingAdditionalPaidInCapitalMember2020-03-280000050863us-gaap:AccumulatedOtherComprehensiveIncomeMember2020-03-280000050863us-gaap:RetainedEarningsMember2020-03-2800000508632020-03-280000050863us-gaap:RetainedEarningsMember2020-03-292020-06-270000050863us-gaap:AccumulatedOtherComprehensiveIncomeMember2020-03-292020-06-270000050863us-gaap:CommonStockIncludingAdditionalPaidInCapitalMember2020-03-292020-06-270000050863us-gaap:CommonStockIncludingAdditionalPaidInCapitalMember2020-06-270000050863us-gaap:AccumulatedOtherComprehensiveIncomeMember2020-06-270000050863us-gaap:RetainedEarningsMember2020-06-270000050863srt:CumulativeEffectPeriodOfAdoptionAdjustedBalanceMemberus-gaap:CommonStockIncludingAdditionalPaidInCapitalMember2020-12-260000050863srt:CumulativeEffectPeriodOfAdoptionAdjustedBalanceMemberus-gaap:AccumulatedOtherComprehensiveIncomeMember2020-12-260000050863us-gaap:RetainedEarningsMembersrt:CumulativeEffectPeriodOfAdoptionAdjustedBalanceMember2020-12-260000050863srt:CumulativeEffectPeriodOfAdoptionAdjustedBalanceMember2020-12-260000050863us-gaap:AccumulatedOtherComprehensiveIncomeMember2020-12-272021-06-260000050863us-gaap:CommonStockIncludingAdditionalPaidInCapitalMember2020-12-272021-06-260000050863us-gaap:CommonStockIncludingAdditionalPaidInCapitalMember2019-12-280000050863us-gaap:AccumulatedOtherComprehensiveIncomeMember2019-12-280000050863us-gaap:RetainedEarningsMember2019-12-280000050863us-gaap:RetainedEarningsMember2019-12-292020-06-270000050863us-gaap:AccumulatedOtherComprehensiveIncomeMember2019-12-292020-06-270000050863us-gaap:CommonStockIncludingAdditionalPaidInCapitalMember2019-12-292020-06-270000050863intc:ClientComputingGroupMemberintc:PlatformMember2021-03-282021-06-260000050863intc:ClientComputingGroupMemberintc:PlatformMember2020-03-292020-06-270000050863intc:ClientComputingGroupMemberintc:PlatformMember2020-12-272021-06-260000050863intc:ClientComputingGroupMemberintc:PlatformMember2019-12-292020-06-270000050863intc:OtherProductOrServiceMemberintc:ClientComputingGroupMember2021-03-282021-06-260000050863intc:OtherProductOrServiceMemberintc:ClientComputingGroupMember2020-03-292020-06-270000050863intc:OtherProductOrServiceMemberintc:ClientComputingGroupMember2020-12-272021-06-260000050863intc:OtherProductOrServiceMemberintc:ClientComputingGroupMember2019-12-292020-06-270000050863intc:ClientComputingGroupMember2021-03-282021-06-260000050863intc:ClientComputingGroupMember2020-03-292020-06-270000050863intc:ClientComputingGroupMember2020-12-272021-06-260000050863intc:ClientComputingGroupMember2019-12-292020-06-270000050863intc:DCGPlatformMemberintc:DataCenterGroupMember2021-03-282021-06-260000050863intc:DCGPlatformMemberintc:DataCenterGroupMember2020-03-292020-06-270000050863intc:DCGPlatformMemberintc:DataCenterGroupMember2020-12-272021-06-260000050863intc:DCGPlatformMemberintc:DataCenterGroupMember2019-12-292020-06-270000050863intc:DataCenterGroupMemberintc:OtherProductOrServiceMember2021-03-282021-06-260000050863intc:DataCenterGroupMemberintc:OtherProductOrServiceMember2020-03-292020-06-270000050863intc:DataCenterGroupMemberintc:OtherProductOrServiceMember2020-12-272021-06-260000050863intc:DataCenterGroupMemberintc:OtherProductOrServiceMember2019-12-292020-06-270000050863intc:DataCenterGroupMember2021-03-282021-06-260000050863intc:DataCenterGroupMember2020-03-292020-06-270000050863intc:DataCenterGroupMember2020-12-272021-06-260000050863intc:DataCenterGroupMember2019-12-292020-06-270000050863intc:InternetOfThingsGroupMember2021-03-282021-06-260000050863intc:InternetOfThingsGroupMember2020-03-292020-06-270000050863intc:InternetOfThingsGroupMember2020-12-272021-06-260000050863intc:InternetOfThingsGroupMember2019-12-292020-06-270000050863intc:MobileyeMember2021-03-282021-06-260000050863intc:MobileyeMember2020-03-292020-06-270000050863intc:MobileyeMember2020-12-272021-06-260000050863intc:MobileyeMember2019-12-292020-06-270000050863intc:InternetofThingsMember2021-03-282021-06-260000050863intc:InternetofThingsMember2020-03-292020-06-270000050863intc:InternetofThingsMember2020-12-272021-06-260000050863intc:InternetofThingsMember2019-12-292020-06-270000050863intc:NonVolatileMemorySolutionsGroupMember2021-03-282021-06-260000050863intc:NonVolatileMemorySolutionsGroupMember2020-03-292020-06-270000050863intc:NonVolatileMemorySolutionsGroupMember2020-12-272021-06-260000050863intc:NonVolatileMemorySolutionsGroupMember2019-12-292020-06-270000050863intc:ProgrammableSolutionsGroupMember2021-03-282021-06-260000050863intc:ProgrammableSolutionsGroupMember2020-03-292020-06-270000050863intc:ProgrammableSolutionsGroupMember2020-12-272021-06-260000050863intc:ProgrammableSolutionsGroupMember2019-12-292020-06-270000050863us-gaap:AllOtherSegmentsMember2021-03-282021-06-260000050863us-gaap:AllOtherSegmentsMember2020-03-292020-06-270000050863us-gaap:AllOtherSegmentsMember2020-12-272021-06-260000050863us-gaap:AllOtherSegmentsMember2019-12-292020-06-270000050863intc:DesktopPlatformMember2021-03-282021-06-260000050863intc:DesktopPlatformMember2020-03-292020-06-270000050863intc:DesktopPlatformMember2020-12-272021-06-260000050863intc:DesktopPlatformMember2019-12-292020-06-270000050863intc:NotebookPlatformMember2021-03-282021-06-260000050863intc:NotebookPlatformMember2020-03-292020-06-270000050863intc:NotebookPlatformMember2020-12-272021-06-260000050863intc:NotebookPlatformMember2019-12-292020-06-270000050863intc:OtherPlatformMember2021-03-282021-06-260000050863intc:OtherPlatformMember2020-03-292020-06-270000050863intc:OtherPlatformMember2020-12-272021-06-260000050863intc:OtherPlatformMember2019-12-292020-06-270000050863intc:IOTGPlatformMember2021-03-282021-06-260000050863intc:IOTGPlatformMember2020-03-292020-06-270000050863intc:IOTGPlatformMember2020-12-272021-06-260000050863intc:IOTGPlatformMember2019-12-292020-06-270000050863intc:PlatformMember2021-03-282021-06-260000050863intc:PlatformMember2020-03-292020-06-270000050863intc:PlatformMember2020-12-272021-06-260000050863intc:PlatformMember2019-12-292020-06-270000050863intc:OtherProductOrServiceMember2021-03-282021-06-260000050863intc:OtherProductOrServiceMember2020-03-292020-06-270000050863intc:OtherProductOrServiceMember2020-12-272021-06-260000050863intc:OtherProductOrServiceMember2019-12-292020-06-270000050863intc:PrepaidSupplyAgreementsMember2020-12-260000050863intc:PrepaidSupplyAgreementsMember2020-12-272021-06-260000050863intc:PrepaidSupplyAgreementsMember2021-06-2600000508632020-12-272021-03-270000050863us-gaap:DebtSecuritiesMember2021-03-282021-06-260000050863us-gaap:DebtSecuritiesMember2020-12-272021-06-260000050863us-gaap:DebtSecuritiesMember2020-03-292020-06-270000050863us-gaap:DebtSecuritiesMember2019-12-292020-06-270000050863intc:BejingUnisocTechnologyLtdMember2020-12-272021-03-270000050863intc:BejingUnisocTechnologyLtdMember2021-06-260000050863intc:BejingUnisocTechnologyLtdMember2020-12-260000050863intc:MoovitMember2020-05-042020-05-040000050863intc:MoovitMember2020-05-0400000508632020-10-192020-10-190000050863srt:ScenarioForecastMember2021-11-012021-11-010000050863srt:ScenarioForecastMember2025-03-012025-03-310000050863srt:ScenarioForecastMember2021-03-282021-10-310000050863us-gaap:SeniorNotesMemberintc:SeniorNotesDueMay2021Member2021-03-282021-06-260000050863us-gaap:RevolvingCreditFacilityMemberintc:VariableRateRevolvingCreditFacilityMember2021-06-260000050863us-gaap:CommercialPaperMember2021-06-260000050863us-gaap:CorporateDebtSecuritiesMemberus-gaap:CashEquivalentsMemberus-gaap:FairValueMeasurementsRecurringMemberus-gaap:FairValueInputsLevel1Member2021-06-260000050863us-gaap:CorporateDebtSecuritiesMemberus-gaap:CashEquivalentsMemberus-gaap:FairValueInputsLevel2Memberus-gaap:FairValueMeasurementsRecurringMember2021-06-260000050863us-gaap:CorporateDebtSecuritiesMemberus-gaap:CashEquivalentsMemberus-gaap:FairValueMeasurementsRecurringMemberus-gaap:FairValueInputsLevel3Member2021-06-260000050863us-gaap:CorporateDebtSecuritiesMemberus-gaap:CashEquivalentsMemberus-gaap:FairValueMeasurementsRecurringMember2021-06-260000050863us-gaap:CorporateDebtSecuritiesMemberus-gaap:CashEquivalentsMemberus-gaap:FairValueMeasurementsRecurringMemberus-gaap:FairValueInputsLevel1Member2020-12-260000050863us-gaap:CorporateDebtSecuritiesMemberus-gaap:CashEquivalentsMemberus-gaap:FairValueInputsLevel2Memberus-gaap:FairValueMeasurementsRecurringMember2020-12-260000050863us-gaap:CorporateDebtSecuritiesMemberus-gaap:CashEquivalentsMemberus-gaap:FairValueMeasurementsRecurringMemberus-gaap:FairValueInputsLevel3Member2020-12-260000050863us-gaap:CorporateDebtSecuritiesMemberus-gaap:CashEquivalentsMemberus-gaap:FairValueMeasurementsRecurringMember2020-12-260000050863us-gaap:CashEquivalentsMemberus-gaap:FixedIncomeSecuritiesMemberus-gaap:FairValueMeasurementsRecurringMemberus-gaap:FairValueInputsLevel1Member2021-06-260000050863us-gaap:CashEquivalentsMemberus-gaap:FixedIncomeSecuritiesMemberus-gaap:FairValueInputsLevel2Memberus-gaap:FairValueMeasurementsRecurringMember2021-06-260000050863us-gaap:CashEquivalentsMemberus-gaap:FixedIncomeSecuritiesMemberus-gaap:FairValueMeasurementsRecurringMemberus-gaap:FairValueInputsLevel3Member2021-06-260000050863us-gaap:CashEquivalentsMemberus-gaap:FixedIncomeSecuritiesMemberus-gaap:FairValueMeasurementsRecurringMember2021-06-260000050863us-gaap:CashEquivalentsMemberus-gaap:FixedIncomeSecuritiesMemberus-gaap:FairValueMeasurementsRecurringMemberus-gaap:FairValueInputsLevel1Member2020-12-260000050863us-gaap:CashEquivalentsMemberus-gaap:FixedIncomeSecuritiesMemberus-gaap:FairValueInputsLevel2Memberus-gaap:FairValueMeasurementsRecurringMember2020-12-260000050863us-gaap:CashEquivalentsMemberus-gaap:FixedIncomeSecuritiesMemberus-gaap:FairValueMeasurementsRecurringMemberus-gaap:FairValueInputsLevel3Member2020-12-260000050863us-gaap:CashEquivalentsMemberus-gaap:FixedIncomeSecuritiesMemberus-gaap:FairValueMeasurementsRecurringMember2020-12-260000050863intc:GovernmentDebtSecuritiesMemberus-gaap:CashEquivalentsMemberus-gaap:FairValueMeasurementsRecurringMemberus-gaap:FairValueInputsLevel1Member2021-06-260000050863intc:GovernmentDebtSecuritiesMemberus-gaap:CashEquivalentsMemberus-gaap:FairValueInputsLevel2Memberus-gaap:FairValueMeasurementsRecurringMember2021-06-260000050863intc:GovernmentDebtSecuritiesMemberus-gaap:CashEquivalentsMemberus-gaap:FairValueMeasurementsRecurringMemberus-gaap:FairValueInputsLevel3Member2021-06-260000050863intc:GovernmentDebtSecuritiesMemberus-gaap:CashEquivalentsMemberus-gaap:FairValueMeasurementsRecurringMember2021-06-260000050863intc:GovernmentDebtSecuritiesMemberus-gaap:CashEquivalentsMemberus-gaap:FairValueMeasurementsRecurringMemberus-gaap:FairValueInputsLevel1Member2020-12-260000050863intc:GovernmentDebtSecuritiesMemberus-gaap:CashEquivalentsMemberus-gaap:FairValueInputsLevel2Memberus-gaap:FairValueMeasurementsRecurringMember2020-12-260000050863intc:GovernmentDebtSecuritiesMemberus-gaap:CashEquivalentsMemberus-gaap:FairValueMeasurementsRecurringMemberus-gaap:FairValueInputsLevel3Member2020-12-260000050863intc:GovernmentDebtSecuritiesMemberus-gaap:CashEquivalentsMemberus-gaap:FairValueMeasurementsRecurringMember2020-12-260000050863us-gaap:CashEquivalentsMemberus-gaap:FairValueMeasurementsRecurringMemberus-gaap:FairValueInputsLevel1Member2021-06-260000050863us-gaap:CashEquivalentsMemberus-gaap:FairValueInputsLevel2Memberus-gaap:FairValueMeasurementsRecurringMember2021-06-260000050863us-gaap:CashEquivalentsMemberus-gaap:FairValueMeasurementsRecurringMemberus-gaap:FairValueInputsLevel3Member2021-06-260000050863us-gaap:CashEquivalentsMemberus-gaap:FairValueMeasurementsRecurringMember2021-06-260000050863us-gaap:CashEquivalentsMemberus-gaap:FairValueMeasurementsRecurringMemberus-gaap:FairValueInputsLevel1Member2020-12-260000050863us-gaap:CashEquivalentsMemberus-gaap:FairValueInputsLevel2Memberus-gaap:FairValueMeasurementsRecurringMember2020-12-260000050863us-gaap:CashEquivalentsMemberus-gaap:FairValueMeasurementsRecurringMemberus-gaap:FairValueInputsLevel3Member2020-12-260000050863us-gaap:CashEquivalentsMemberus-gaap:FairValueMeasurementsRecurringMember2020-12-260000050863us-gaap:CorporateDebtSecuritiesMemberus-gaap:FairValueMeasurementsRecurringMemberus-gaap:ShortTermInvestmentsMemberus-gaap:FairValueInputsLevel1Member2021-06-260000050863us-gaap:CorporateDebtSecuritiesMemberus-gaap:FairValueInputsLevel2Memberus-gaap:FairValueMeasurementsRecurringMemberus-gaap:ShortTermInvestmentsMember2021-06-260000050863us-gaap:CorporateDebtSecuritiesMemberus-gaap:FairValueMeasurementsRecurringMemberus-gaap:ShortTermInvestmentsMemberus-gaap:FairValueInputsLevel3Member2021-06-260000050863us-gaap:CorporateDebtSecuritiesMemberus-gaap:FairValueMeasurementsRecurringMemberus-gaap:ShortTermInvestmentsMember2021-06-260000050863us-gaap:CorporateDebtSecuritiesMemberus-gaap:FairValueMeasurementsRecurringMemberus-gaap:ShortTermInvestmentsMemberus-gaap:FairValueInputsLevel1Member2020-12-260000050863us-gaap:CorporateDebtSecuritiesMemberus-gaap:FairValueInputsLevel2Memberus-gaap:FairValueMeasurementsRecurringMemberus-gaap:ShortTermInvestmentsMember2020-12-260000050863us-gaap:CorporateDebtSecuritiesMemberus-gaap:FairValueMeasurementsRecurringMemberus-gaap:ShortTermInvestmentsMemberus-gaap:FairValueInputsLevel3Member2020-12-260000050863us-gaap:CorporateDebtSecuritiesMemberus-gaap:FairValueMeasurementsRecurringMemberus-gaap:ShortTermInvestmentsMember2020-12-260000050863us-gaap:FixedIncomeSecuritiesMemberus-gaap:FairValueMeasurementsRecurringMemberus-gaap:ShortTermInvestmentsMemberus-gaap:FairValueInputsLevel1Member2021-06-260000050863us-gaap:FixedIncomeSecuritiesMemberus-gaap:FairValueInputsLevel2Memberus-gaap:FairValueMeasurementsRecurringMemberus-gaap:ShortTermInvestmentsMember2021-06-260000050863us-gaap:FixedIncomeSecuritiesMemberus-gaap:FairValueMeasurementsRecurringMemberus-gaap:ShortTermInvestmentsMemberus-gaap:FairValueInputsLevel3Member2021-06-260000050863us-gaap:FixedIncomeSecuritiesMemberus-gaap:FairValueMeasurementsRecurringMemberus-gaap:ShortTermInvestmentsMember2021-06-260000050863us-gaap:FixedIncomeSecuritiesMemberus-gaap:FairValueMeasurementsRecurringMemberus-gaap:ShortTermInvestmentsMemberus-gaap:FairValueInputsLevel1Member2020-12-260000050863us-gaap:FixedIncomeSecuritiesMemberus-gaap:FairValueInputsLevel2Memberus-gaap:FairValueMeasurementsRecurringMemberus-gaap:ShortTermInvestmentsMember2020-12-260000050863us-gaap:FixedIncomeSecuritiesMemberus-gaap:FairValueMeasurementsRecurringMemberus-gaap:ShortTermInvestmentsMemberus-gaap:FairValueInputsLevel3Member2020-12-260000050863us-gaap:FixedIncomeSecuritiesMemberus-gaap:FairValueMeasurementsRecurringMemberus-gaap:ShortTermInvestmentsMember2020-12-260000050863intc:GovernmentDebtSecuritiesMemberus-gaap:FairValueMeasurementsRecurringMemberus-gaap:ShortTermInvestmentsMemberus-gaap:FairValueInputsLevel1Member2021-06-260000050863intc:GovernmentDebtSecuritiesMemberus-gaap:FairValueInputsLevel2Memberus-gaap:FairValueMeasurementsRecurringMemberus-gaap:ShortTermInvestmentsMember2021-06-260000050863intc:GovernmentDebtSecuritiesMemberus-gaap:FairValueMeasurementsRecurringMemberus-gaap:ShortTermInvestmentsMemberus-gaap:FairValueInputsLevel3Member2021-06-260000050863intc:GovernmentDebtSecuritiesMemberus-gaap:FairValueMeasurementsRecurringMemberus-gaap:ShortTermInvestmentsMember2021-06-260000050863intc:GovernmentDebtSecuritiesMemberus-gaap:FairValueMeasurementsRecurringMemberus-gaap:ShortTermInvestmentsMemberus-gaap:FairValueInputsLevel1Member2020-12-260000050863intc:GovernmentDebtSecuritiesMemberus-gaap:FairValueInputsLevel2Memberus-gaap:FairValueMeasurementsRecurringMemberus-gaap:ShortTermInvestmentsMember2020-12-260000050863intc:GovernmentDebtSecuritiesMemberus-gaap:FairValueMeasurementsRecurringMemberus-gaap:ShortTermInvestmentsMemberus-gaap:FairValueInputsLevel3Member2020-12-260000050863intc:GovernmentDebtSecuritiesMemberus-gaap:FairValueMeasurementsRecurringMemberus-gaap:ShortTermInvestmentsMember2020-12-260000050863us-gaap:CorporateDebtSecuritiesMemberus-gaap:FairValueMeasurementsRecurringMemberus-gaap:FairValueInputsLevel1Member2021-06-260000050863us-gaap:CorporateDebtSecuritiesMemberus-gaap:FairValueInputsLevel2Memberus-gaap:FairValueMeasurementsRecurringMember2021-06-260000050863us-gaap:CorporateDebtSecuritiesMemberus-gaap:FairValueMeasurementsRecurringMemberus-gaap:FairValueInputsLevel3Member2021-06-260000050863us-gaap:CorporateDebtSecuritiesMemberus-gaap:FairValueMeasurementsRecurringMember2021-06-260000050863us-gaap:CorporateDebtSecuritiesMemberus-gaap:FairValueMeasurementsRecurringMemberus-gaap:FairValueInputsLevel1Member2020-12-260000050863us-gaap:CorporateDebtSecuritiesMemberus-gaap:FairValueInputsLevel2Memberus-gaap:FairValueMeasurementsRecurringMember2020-12-260000050863us-gaap:CorporateDebtSecuritiesMemberus-gaap:FairValueMeasurementsRecurringMemberus-gaap:FairValueInputsLevel3Member2020-12-260000050863us-gaap:CorporateDebtSecuritiesMemberus-gaap:FairValueMeasurementsRecurringMember2020-12-260000050863us-gaap:FixedIncomeSecuritiesMemberus-gaap:FairValueMeasurementsRecurringMemberus-gaap:FairValueInputsLevel1Member2021-06-260000050863us-gaap:FixedIncomeSecuritiesMemberus-gaap:FairValueInputsLevel2Memberus-gaap:FairValueMeasurementsRecurringMember2021-06-260000050863us-gaap:FixedIncomeSecuritiesMemberus-gaap:FairValueMeasurementsRecurringMemberus-gaap:FairValueInputsLevel3Member2021-06-260000050863us-gaap:FixedIncomeSecuritiesMemberus-gaap:FairValueMeasurementsRecurringMember2021-06-260000050863us-gaap:FixedIncomeSecuritiesMemberus-gaap:FairValueMeasurementsRecurringMemberus-gaap:FairValueInputsLevel1Member2020-12-260000050863us-gaap:FixedIncomeSecuritiesMemberus-gaap:FairValueInputsLevel2Memberus-gaap:FairValueMeasurementsRecurringMember2020-12-260000050863us-gaap:FixedIncomeSecuritiesMemberus-gaap:FairValueMeasurementsRecurringMemberus-gaap:FairValueInputsLevel3Member2020-12-260000050863us-gaap:FixedIncomeSecuritiesMemberus-gaap:FairValueMeasurementsRecurringMember2020-12-260000050863intc:GovernmentDebtSecuritiesMemberus-gaap:FairValueMeasurementsRecurringMemberus-gaap:FairValueInputsLevel1Member2021-06-260000050863intc:GovernmentDebtSecuritiesMemberus-gaap:FairValueInputsLevel2Memberus-gaap:FairValueMeasurementsRecurringMember2021-06-260000050863intc:GovernmentDebtSecuritiesMemberus-gaap:FairValueMeasurementsRecurringMemberus-gaap:FairValueInputsLevel3Member2021-06-260000050863intc:GovernmentDebtSecuritiesMemberus-gaap:FairValueMeasurementsRecurringMember2021-06-260000050863intc:GovernmentDebtSecuritiesMemberus-gaap:FairValueMeasurementsRecurringMemberus-gaap:FairValueInputsLevel1Member2020-12-260000050863intc:GovernmentDebtSecuritiesMemberus-gaap:FairValueInputsLevel2Memberus-gaap:FairValueMeasurementsRecurringMember2020-12-260000050863intc:GovernmentDebtSecuritiesMemberus-gaap:FairValueMeasurementsRecurringMemberus-gaap:FairValueInputsLevel3Member2020-12-260000050863intc:GovernmentDebtSecuritiesMemberus-gaap:FairValueMeasurementsRecurringMember2020-12-260000050863us-gaap:OtherCurrentAssetsMemberus-gaap:FairValueMeasurementsRecurringMemberus-gaap:FairValueInputsLevel1Member2021-06-260000050863us-gaap:OtherCurrentAssetsMemberus-gaap:FairValueInputsLevel2Memberus-gaap:FairValueMeasurementsRecurringMember2021-06-260000050863us-gaap:OtherCurrentAssetsMemberus-gaap:FairValueMeasurementsRecurringMemberus-gaap:FairValueInputsLevel3Member2021-06-260000050863us-gaap:OtherCurrentAssetsMemberus-gaap:FairValueMeasurementsRecurringMember2021-06-260000050863us-gaap:OtherCurrentAssetsMemberus-gaap:FairValueMeasurementsRecurringMemberus-gaap:FairValueInputsLevel1Member2020-12-260000050863us-gaap:OtherCurrentAssetsMemberus-gaap:FairValueInputsLevel2Memberus-gaap:FairValueMeasurementsRecurringMember2020-12-260000050863us-gaap:OtherCurrentAssetsMemberus-gaap:FairValueMeasurementsRecurringMemberus-gaap:FairValueInputsLevel3Member2020-12-260000050863us-gaap:OtherCurrentAssetsMemberus-gaap:FairValueMeasurementsRecurringMember2020-12-260000050863us-gaap:EquitySecuritiesMemberus-gaap:FairValueMeasurementsRecurringMemberus-gaap:FairValueInputsLevel1Member2021-06-260000050863us-gaap:EquitySecuritiesMemberus-gaap:FairValueInputsLevel2Memberus-gaap:FairValueMeasurementsRecurringMember2021-06-260000050863us-gaap:EquitySecuritiesMemberus-gaap:FairValueMeasurementsRecurringMemberus-gaap:FairValueInputsLevel3Member2021-06-260000050863us-gaap:EquitySecuritiesMemberus-gaap:FairValueMeasurementsRecurringMember2021-06-260000050863us-gaap:EquitySecuritiesMemberus-gaap:FairValueMeasurementsRecurringMemberus-gaap:FairValueInputsLevel1Member2020-12-260000050863us-gaap:EquitySecuritiesMemberus-gaap:FairValueInputsLevel2Memberus-gaap:FairValueMeasurementsRecurringMember2020-12-260000050863us-gaap:EquitySecuritiesMemberus-gaap:FairValueMeasurementsRecurringMemberus-gaap:FairValueInputsLevel3Member2020-12-260000050863us-gaap:EquitySecuritiesMemberus-gaap:FairValueMeasurementsRecurringMember2020-12-260000050863us-gaap:CorporateDebtSecuritiesMemberus-gaap:OtherLongTermInvestmentsMemberus-gaap:FairValueMeasurementsRecurringMemberus-gaap:FairValueInputsLevel1Member2021-06-260000050863us-gaap:CorporateDebtSecuritiesMemberus-gaap:OtherLongTermInvestmentsMemberus-gaap:FairValueInputsLevel2Memberus-gaap:FairValueMeasurementsRecurringMember2021-06-260000050863us-gaap:CorporateDebtSecuritiesMemberus-gaap:OtherLongTermInvestmentsMemberus-gaap:FairValueMeasurementsRecurringMemberus-gaap:FairValueInputsLevel3Member2021-06-260000050863us-gaap:CorporateDebtSecuritiesMemberus-gaap:OtherLongTermInvestmentsMemberus-gaap:FairValueMeasurementsRecurringMember2021-06-260000050863us-gaap:CorporateDebtSecuritiesMemberus-gaap:OtherLongTermInvestmentsMemberus-gaap:FairValueMeasurementsRecurringMemberus-gaap:FairValueInputsLevel1Member2020-12-260000050863us-gaap:CorporateDebtSecuritiesMemberus-gaap:OtherLongTermInvestmentsMemberus-gaap:FairValueInputsLevel2Memberus-gaap:FairValueMeasurementsRecurringMember2020-12-260000050863us-gaap:CorporateDebtSecuritiesMemberus-gaap:OtherLongTermInvestmentsMemberus-gaap:FairValueMeasurementsRecurringMemberus-gaap:FairValueInputsLevel3Member2020-12-260000050863us-gaap:CorporateDebtSecuritiesMemberus-gaap:OtherLongTermInvestmentsMemberus-gaap:FairValueMeasurementsRecurringMember2020-12-260000050863us-gaap:FixedIncomeSecuritiesMemberus-gaap:OtherLongTermInvestmentsMemberus-gaap:FairValueMeasurementsRecurringMemberus-gaap:FairValueInputsLevel1Member2021-06-260000050863us-gaap:FixedIncomeSecuritiesMemberus-gaap:OtherLongTermInvestmentsMemberus-gaap:FairValueInputsLevel2Memberus-gaap:FairValueMeasurementsRecurringMember2021-06-260000050863us-gaap:FixedIncomeSecuritiesMemberus-gaap:OtherLongTermInvestmentsMemberus-gaap:FairValueMeasurementsRecurringMemberus-gaap:FairValueInputsLevel3Member2021-06-260000050863us-gaap:FixedIncomeSecuritiesMemberus-gaap:OtherLongTermInvestmentsMemberus-gaap:FairValueMeasurementsRecurringMember2021-06-260000050863us-gaap:FixedIncomeSecuritiesMemberus-gaap:OtherLongTermInvestmentsMemberus-gaap:FairValueMeasurementsRecurringMemberus-gaap:FairValueInputsLevel1Member2020-12-260000050863us-gaap:FixedIncomeSecuritiesMemberus-gaap:OtherLongTermInvestmentsMemberus-gaap:FairValueInputsLevel2Memberus-gaap:FairValueMeasurementsRecurringMember2020-12-260000050863us-gaap:FixedIncomeSecuritiesMemberus-gaap:OtherLongTermInvestmentsMemberus-gaap:FairValueMeasurementsRecurringMemberus-gaap:FairValueInputsLevel3Member2020-12-260000050863us-gaap:FixedIncomeSecuritiesMemberus-gaap:OtherLongTermInvestmentsMemberus-gaap:FairValueMeasurementsRecurringMember2020-12-260000050863intc:GovernmentDebtSecuritiesMemberus-gaap:OtherLongTermInvestmentsMemberus-gaap:FairValueMeasurementsRecurringMemberus-gaap:FairValueInputsLevel1Member2021-06-260000050863intc:GovernmentDebtSecuritiesMemberus-gaap:OtherLongTermInvestmentsMemberus-gaap:FairValueInputsLevel2Memberus-gaap:FairValueMeasurementsRecurringMember2021-06-260000050863intc:GovernmentDebtSecuritiesMemberus-gaap:OtherLongTermInvestmentsMemberus-gaap:FairValueMeasurementsRecurringMemberus-gaap:FairValueInputsLevel3Member2021-06-260000050863intc:GovernmentDebtSecuritiesMemberus-gaap:OtherLongTermInvestmentsMemberus-gaap:FairValueMeasurementsRecurringMember2021-06-260000050863intc:GovernmentDebtSecuritiesMemberus-gaap:OtherLongTermInvestmentsMemberus-gaap:FairValueMeasurementsRecurringMemberus-gaap:FairValueInputsLevel1Member2020-12-260000050863intc:GovernmentDebtSecuritiesMemberus-gaap:OtherLongTermInvestmentsMemberus-gaap:FairValueInputsLevel2Memberus-gaap:FairValueMeasurementsRecurringMember2020-12-260000050863intc:GovernmentDebtSecuritiesMemberus-gaap:OtherLongTermInvestmentsMemberus-gaap:FairValueMeasurementsRecurringMemberus-gaap:FairValueInputsLevel3Member2020-12-260000050863intc:GovernmentDebtSecuritiesMemberus-gaap:OtherLongTermInvestmentsMemberus-gaap:FairValueMeasurementsRecurringMember2020-12-260000050863us-gaap:OtherNoncurrentAssetsMemberus-gaap:FairValueMeasurementsRecurringMemberus-gaap:FairValueInputsLevel1Member2021-06-260000050863us-gaap:OtherNoncurrentAssetsMemberus-gaap:FairValueInputsLevel2Memberus-gaap:FairValueMeasurementsRecurringMember2021-06-260000050863us-gaap:OtherNoncurrentAssetsMemberus-gaap:FairValueMeasurementsRecurringMemberus-gaap:FairValueInputsLevel3Member2021-06-260000050863us-gaap:OtherNoncurrentAssetsMemberus-gaap:FairValueMeasurementsRecurringMember2021-06-260000050863us-gaap:OtherNoncurrentAssetsMemberus-gaap:FairValueMeasurementsRecurringMemberus-gaap:FairValueInputsLevel1Member2020-12-260000050863us-gaap:OtherNoncurrentAssetsMemberus-gaap:FairValueInputsLevel2Memberus-gaap:FairValueMeasurementsRecurringMember2020-12-260000050863us-gaap:OtherNoncurrentAssetsMemberus-gaap:FairValueMeasurementsRecurringMemberus-gaap:FairValueInputsLevel3Member2020-12-260000050863us-gaap:OtherNoncurrentAssetsMemberus-gaap:FairValueMeasurementsRecurringMember2020-12-260000050863us-gaap:FairValueMeasurementsRecurringMemberus-gaap:FairValueInputsLevel1Member2021-06-260000050863us-gaap:FairValueInputsLevel2Memberus-gaap:FairValueMeasurementsRecurringMember2021-06-260000050863us-gaap:FairValueMeasurementsRecurringMemberus-gaap:FairValueInputsLevel3Member2021-06-260000050863us-gaap:FairValueMeasurementsRecurringMember2021-06-260000050863us-gaap:FairValueMeasurementsRecurringMemberus-gaap:FairValueInputsLevel1Member2020-12-260000050863us-gaap:FairValueInputsLevel2Memberus-gaap:FairValueMeasurementsRecurringMember2020-12-260000050863us-gaap:FairValueMeasurementsRecurringMemberus-gaap:FairValueInputsLevel3Member2020-12-260000050863us-gaap:FairValueMeasurementsRecurringMember2020-12-260000050863us-gaap:OtherCurrentLiabilitiesMemberus-gaap:FairValueMeasurementsRecurringMemberus-gaap:FairValueInputsLevel1Member2021-06-260000050863us-gaap:OtherCurrentLiabilitiesMemberus-gaap:FairValueInputsLevel2Memberus-gaap:FairValueMeasurementsRecurringMember2021-06-260000050863us-gaap:OtherCurrentLiabilitiesMemberus-gaap:FairValueMeasurementsRecurringMemberus-gaap:FairValueInputsLevel3Member2021-06-260000050863us-gaap:OtherCurrentLiabilitiesMemberus-gaap:FairValueMeasurementsRecurringMember2021-06-260000050863us-gaap:OtherCurrentLiabilitiesMemberus-gaap:FairValueMeasurementsRecurringMemberus-gaap:FairValueInputsLevel1Member2020-12-260000050863us-gaap:OtherCurrentLiabilitiesMemberus-gaap:FairValueInputsLevel2Memberus-gaap:FairValueMeasurementsRecurringMember2020-12-260000050863us-gaap:OtherCurrentLiabilitiesMemberus-gaap:FairValueMeasurementsRecurringMemberus-gaap:FairValueInputsLevel3Member2020-12-260000050863us-gaap:OtherCurrentLiabilitiesMemberus-gaap:FairValueMeasurementsRecurringMember2020-12-260000050863us-gaap:OtherNoncurrentLiabilitiesMemberus-gaap:FairValueMeasurementsRecurringMemberus-gaap:FairValueInputsLevel1Member2021-06-260000050863us-gaap:OtherNoncurrentLiabilitiesMemberus-gaap:FairValueInputsLevel2Memberus-gaap:FairValueMeasurementsRecurringMember2021-06-260000050863us-gaap:OtherNoncurrentLiabilitiesMemberus-gaap:FairValueMeasurementsRecurringMemberus-gaap:FairValueInputsLevel3Member2021-06-260000050863us-gaap:OtherNoncurrentLiabilitiesMemberus-gaap:FairValueMeasurementsRecurringMember2021-06-260000050863us-gaap:OtherNoncurrentLiabilitiesMemberus-gaap:FairValueMeasurementsRecurringMemberus-gaap:FairValueInputsLevel1Member2020-12-260000050863us-gaap:OtherNoncurrentLiabilitiesMemberus-gaap:FairValueInputsLevel2Memberus-gaap:FairValueMeasurementsRecurringMember2020-12-260000050863us-gaap:OtherNoncurrentLiabilitiesMemberus-gaap:FairValueMeasurementsRecurringMemberus-gaap:FairValueInputsLevel3Member2020-12-260000050863us-gaap:OtherNoncurrentLiabilitiesMemberus-gaap:FairValueMeasurementsRecurringMember2020-12-260000050863us-gaap:FairValueMeasurementsNonrecurringMember2021-06-260000050863us-gaap:FairValueMeasurementsNonrecurringMember2020-12-260000050863us-gaap:AccumulatedNetInvestmentGainLossIncludingPortionAttributableToNoncontrollingInterestMember2020-12-260000050863us-gaap:AccumulatedNetGainLossFromCashFlowHedgesIncludingPortionAttributableToNoncontrollingInterestMember2020-12-260000050863us-gaap:AccumulatedDefinedBenefitPlansAdjustmentNetGainLossIncludingPortionAttributableToNoncontrollingInterestMember2020-12-260000050863us-gaap:AccumulatedTranslationAdjustmentMember2020-12-260000050863us-gaap:AccumulatedNetInvestmentGainLossIncludingPortionAttributableToNoncontrollingInterestMember2020-12-272021-06-260000050863us-gaap:AccumulatedNetGainLossFromCashFlowHedgesIncludingPortionAttributableToNoncontrollingInterestMember2020-12-272021-06-260000050863us-gaap:AccumulatedDefinedBenefitPlansAdjustmentNetGainLossIncludingPortionAttributableToNoncontrollingInterestMember2020-12-272021-06-260000050863us-gaap:AccumulatedTranslationAdjustmentMember2020-12-272021-06-260000050863us-gaap:AccumulatedNetInvestmentGainLossIncludingPortionAttributableToNoncontrollingInterestMember2021-06-260000050863us-gaap:AccumulatedNetGainLossFromCashFlowHedgesIncludingPortionAttributableToNoncontrollingInterestMember2021-06-260000050863us-gaap:AccumulatedDefinedBenefitPlansAdjustmentNetGainLossIncludingPortionAttributableToNoncontrollingInterestMember2021-06-260000050863us-gaap:AccumulatedTranslationAdjustmentMember2021-06-260000050863us-gaap:ForeignExchangeContractMember2021-06-260000050863us-gaap:ForeignExchangeContractMember2020-12-260000050863us-gaap:InterestRateContractMember2021-06-260000050863us-gaap:InterestRateContractMember2020-12-260000050863us-gaap:OtherContractMember2021-06-260000050863us-gaap:OtherContractMember2020-12-260000050863us-gaap:OtherAssetsMemberus-gaap:DesignatedAsHedgingInstrumentMemberus-gaap:ForeignExchangeContractMember2021-06-260000050863us-gaap:OtherLiabilitiesMemberus-gaap:DesignatedAsHedgingInstrumentMemberus-gaap:ForeignExchangeContractMember2021-06-260000050863us-gaap:OtherAssetsMemberus-gaap:DesignatedAsHedgingInstrumentMemberus-gaap:ForeignExchangeContractMember2020-12-260000050863us-gaap:OtherLiabilitiesMemberus-gaap:DesignatedAsHedgingInstrumentMemberus-gaap:ForeignExchangeContractMember2020-12-260000050863us-gaap:InterestRateContractMemberus-gaap:OtherAssetsMemberus-gaap:DesignatedAsHedgingInstrumentMember2021-06-260000050863us-gaap:InterestRateContractMemberus-gaap:OtherLiabilitiesMemberus-gaap:DesignatedAsHedgingInstrumentMember2021-06-260000050863us-gaap:InterestRateContractMemberus-gaap:OtherAssetsMemberus-gaap:DesignatedAsHedgingInstrumentMember2020-12-260000050863us-gaap:InterestRateContractMemberus-gaap:OtherLiabilitiesMemberus-gaap:DesignatedAsHedgingInstrumentMember2020-12-260000050863us-gaap:OtherAssetsMemberus-gaap:DesignatedAsHedgingInstrumentMember2021-06-260000050863us-gaap:OtherLiabilitiesMemberus-gaap:DesignatedAsHedgingInstrumentMember2021-06-260000050863us-gaap:OtherAssetsMemberus-gaap:DesignatedAsHedgingInstrumentMember2020-12-260000050863us-gaap:OtherLiabilitiesMemberus-gaap:DesignatedAsHedgingInstrumentMember2020-12-260000050863us-gaap:NondesignatedMemberus-gaap:OtherAssetsMemberus-gaap:ForeignExchangeContractMember2021-06-260000050863us-gaap:NondesignatedMemberus-gaap:OtherLiabilitiesMemberus-gaap:ForeignExchangeContractMember2021-06-260000050863us-gaap:NondesignatedMemberus-gaap:OtherAssetsMemberus-gaap:ForeignExchangeContractMember2020-12-260000050863us-gaap:NondesignatedMemberus-gaap:OtherLiabilitiesMemberus-gaap:ForeignExchangeContractMember2020-12-260000050863us-gaap:InterestRateContractMemberus-gaap:NondesignatedMemberus-gaap:OtherAssetsMember2021-06-260000050863us-gaap:InterestRateContractMemberus-gaap:NondesignatedMemberus-gaap:OtherLiabilitiesMember2021-06-260000050863us-gaap:InterestRateContractMemberus-gaap:NondesignatedMemberus-gaap:OtherAssetsMember2020-12-260000050863us-gaap:InterestRateContractMemberus-gaap:NondesignatedMemberus-gaap:OtherLiabilitiesMember2020-12-260000050863us-gaap:NondesignatedMemberus-gaap:OtherContractMemberus-gaap:OtherAssetsMember2021-06-260000050863us-gaap:NondesignatedMemberus-gaap:OtherContractMemberus-gaap:OtherLiabilitiesMember2021-06-260000050863us-gaap:NondesignatedMemberus-gaap:OtherContractMemberus-gaap:OtherAssetsMember2020-12-260000050863us-gaap:NondesignatedMemberus-gaap:OtherContractMemberus-gaap:OtherLiabilitiesMember2020-12-260000050863us-gaap:NondesignatedMemberus-gaap:OtherAssetsMember2021-06-260000050863us-gaap:NondesignatedMemberus-gaap:OtherLiabilitiesMember2021-06-260000050863us-gaap:NondesignatedMemberus-gaap:OtherAssetsMember2020-12-260000050863us-gaap:NondesignatedMemberus-gaap:OtherLiabilitiesMember2020-12-260000050863us-gaap:OtherAssetsMember2021-06-260000050863us-gaap:OtherLiabilitiesMember2021-06-260000050863us-gaap:OtherAssetsMember2020-12-260000050863us-gaap:OtherLiabilitiesMember2020-12-260000050863us-gaap:ForeignExchangeContractMember2021-03-282021-06-260000050863us-gaap:ForeignExchangeContractMember2020-12-272021-06-260000050863us-gaap:ForeignExchangeContractMember2020-03-292020-06-270000050863us-gaap:ForeignExchangeContractMember2019-12-292020-06-270000050863us-gaap:FairValueHedgingMemberus-gaap:OtherNonoperatingIncomeExpenseMember2020-12-272021-06-260000050863us-gaap:InterestRateContractMember2021-03-282021-06-260000050863us-gaap:InterestRateContractMember2020-03-292020-06-270000050863us-gaap:InterestRateContractMember2020-12-272021-06-260000050863us-gaap:InterestRateContractMember2019-12-292020-06-270000050863us-gaap:FairValueHedgingMemberus-gaap:LongTermDebtMemberus-gaap:InterestRateSwapMember2021-06-260000050863us-gaap:FairValueHedgingMemberus-gaap:LongTermDebtMemberus-gaap:InterestRateSwapMember2020-12-260000050863us-gaap:FairValueHedgingMemberus-gaap:LongTermDebtMemberus-gaap:InterestRateSwapMember2020-12-272021-06-260000050863us-gaap:FairValueHedgingMemberus-gaap:LongTermDebtMemberus-gaap:InterestRateSwapMember2019-12-292020-12-260000050863us-gaap:NondesignatedMember2020-12-272021-06-260000050863us-gaap:NondesignatedMemberus-gaap:OtherNonoperatingIncomeExpenseMemberus-gaap:ForeignExchangeContractMember2021-03-282021-06-260000050863us-gaap:NondesignatedMemberus-gaap:OtherNonoperatingIncomeExpenseMemberus-gaap:ForeignExchangeContractMember2020-03-292020-06-270000050863us-gaap:NondesignatedMemberus-gaap:OtherNonoperatingIncomeExpenseMemberus-gaap:ForeignExchangeContractMember2020-12-272021-06-260000050863us-gaap:NondesignatedMemberus-gaap:OtherNonoperatingIncomeExpenseMemberus-gaap:ForeignExchangeContractMember2019-12-292020-06-270000050863us-gaap:InterestRateContractMemberus-gaap:NondesignatedMemberus-gaap:OtherNonoperatingIncomeExpenseMember2021-03-282021-06-260000050863us-gaap:InterestRateContractMemberus-gaap:NondesignatedMemberus-gaap:OtherNonoperatingIncomeExpenseMember2020-03-292020-06-270000050863us-gaap:InterestRateContractMemberus-gaap:NondesignatedMemberus-gaap:OtherNonoperatingIncomeExpenseMember2020-12-272021-06-260000050863us-gaap:InterestRateContractMemberus-gaap:NondesignatedMemberus-gaap:OtherNonoperatingIncomeExpenseMember2019-12-292020-06-270000050863us-gaap:NondesignatedMemberus-gaap:OtherContractMemberintc:VariousMember2021-03-282021-06-260000050863us-gaap:NondesignatedMemberus-gaap:OtherContractMemberintc:VariousMember2020-03-292020-06-270000050863us-gaap:NondesignatedMemberus-gaap:OtherContractMemberintc:VariousMember2020-12-272021-06-260000050863us-gaap:NondesignatedMemberus-gaap:OtherContractMemberintc:VariousMember2019-12-292020-06-270000050863us-gaap:NondesignatedMember2021-03-282021-06-260000050863us-gaap:NondesignatedMember2020-03-292020-06-270000050863us-gaap:NondesignatedMember2019-12-292020-06-27iso4217:EUR0000050863intc:EcFineMember2009-05-012009-05-31
UNITED STATES SECURITIES AND EXCHANGE COMMISSION
Washington, D.C. 20549
FORM 10-Q
(Mark One)
| | | | | | | | | | | |
| | ☑ | QUARTERLY REPORT PURSUANT TO SECTION 13 OR 15(d) OF THE SECURITIES EXCHANGE ACT OF 1934 |
| | For the quarterly period ended | June 26, 2021 |
Or
| | | | | | | | |
| | ☐ | TRANSITION REPORT PURSUANT TO SECTION 13 OR 15(d) OF THE SECURITIES EXCHANGE ACT OF 1934 |
| | For the transition period from to |
Commission File Number 000-06217
INTEL CORPORATION
(Exact name of registrant as specified in its charter)
| | | | | | | | | | | | | | |
| Delaware | | | 94-1672743 |
| (State or other jurisdiction of incorporation or organization) | | (I.R.S. Employer Identification No.) |
| | | | |
| 2200 Mission College Boulevard, | Santa Clara, | California | | 95054-1549 |
| (Address of principal executive offices) | | (Zip Code) |
(408) 765-8080
(Registrant’s telephone number, including area code)
N/A
(Former name, former address and former fiscal year, if changed since last report)
Securities registered pursuant to Section 12(b) of the Act:
| | | | | | | | |
| Title of each class | Trading Symbol(s) | Name of each exchange on which registered |
| Common stock, $0.001 par value | INTC | Nasdaq Global Select Market |
Indicate by check mark whether the registrant (1) has filed all reports required to be filed by Section 13 or 15(d) of the Securities Exchange Act of 1934 during the preceding 12 months (or for such shorter period that the registrant was required to file such reports), and (2) has been subject to such filing requirements for the past 90 days. Yes ☑ No ¨
Indicate by check mark whether the registrant has submitted electronically every Interactive Data File required to be submitted pursuant to Rule 405 of Regulation S-T (§232.405 of this chapter) during the preceding 12 months (or for such shorter period that the registrant was required to submit such files). Yes ☑ No ¨
Indicate by check mark whether the registrant is a large accelerated filer, an accelerated filer, a non-accelerated filer, a smaller reporting company, or an emerging growth company. See the definitions of “large accelerated filer,” “accelerated filer,” “smaller reporting company,” and "emerging growth company" in Rule 12b-2 of the Exchange Act.
| | | | | | | | | | | | | | | | | |
| Large Accelerated Filer | | Accelerated filer | | Non-accelerated filer | | Smaller reporting company | Emerging growth company |
☑
| | ¨ | | ¨ | | ☐ | ☐ |
| | | | | | | |
If an emerging growth company, indicate by check mark if the registrant has elected not to use the extended transition period for complying with any new or revised financial accounting standards provided pursuant to Section 13(a) of the Exchange Act. ¨
Indicate by check mark whether the registrant is a shell company (as defined in Rule 12b-2 of the Exchange Act). Yes ☐ No ☑
As of June 26, 2021, the registrant had outstanding 4,057 million shares of common stock.
Table of Contents
The Organization of Our Quarterly Report on Form 10-Q
The order and presentation of content in our Form 10-Q differs from the traditional SEC Form 10-Q format. Our format is designed to improve readability and better present how we organize and manage our business. See "Form 10-Q Cross-Reference Index" within Other Key Information for a cross-reference index to the traditional SEC Form 10-Q format.
We have defined certain terms and abbreviations used throughout our Form 10-Q in "Key Terms" within the Consolidated Condensed Financial Statements and Supplemental Details.
The preparation of our Consolidated Condensed Financial Statements is in conformity with U.S. GAAP. Our Form 10-Q includes key metrics that we use to measure our business, some of which are non-GAAP measures. See "Non-GAAP Financial Measures" within MD&A for an explanation of these measures and why management uses them and believes they provide investors with useful supplemental information.
| | | | | | | | | | | |
| | | Page |
Forward-Looking Statements | |
| |
A Quarter in Review | |
Consolidated Condensed Financial Statements and Supplemental Details | |
| Consolidated Condensed Statements of Income | |
| Consolidated Condensed Statements of Comprehensive Income | |
| Consolidated Condensed Balance Sheets | |
| Consolidated Condensed Statements of Cash Flows | |
| Consolidated Condensed Statements of Stockholders' Equity | |
| Notes to Consolidated Condensed Financial Statements | |
| Key Terms | |
| | | |
Management's Discussion and Analysis | |
| | |
| | |
| Segment Trends and Results | |
| | | |
| | | |
| | | |
| | | |
| | | |
| Consolidated Results of Operations | |
| Liquidity and Capital Resources | |
| | |
| | |
| Non-GAAP Financial Measures | |
| | | |
Other Key Information | |
| Quantitative and Qualitative Disclosures about Market Risk | |
| Risk Factors | |
| Controls and Procedures | |
| | |
| Issuer Purchases of Equity Securities | |
| Disclosure Pursuant to Section 13(r)(of the Securities Exchange Act of 1934 | |
| Exhibits | |
| Form 10-Q Cross-Reference Index | |
Forward-Looking Statements
This Form 10-Q contains forward-looking statements that involve a number of risks and uncertainties. Words such as "anticipate," "expect," "intend," "plan," "opportunity," "future," "pending," "to be," "believes," "estimated," "continue," "likely," "may," "might," "potentially," "will," "would," "should," "could," “accelerate,” "progress," “goal,” and variations of such words and similar expressions are intended to identify such forward-looking statements. In addition, any statements that refer to Intel’s strategy; manufacturing expansion and investment plans, including Intel’s anticipated New Mexico investment; future responses to and effects of COVID-19; projections of our future financial performance and demand; our anticipated growth and trends in our businesses or operations; projected growth and trends in markets relevant to our businesses; business plans; future products and technology and the expected availability and benefits of such products and technology; expected timing and impact of acquisitions, divestitures, and other significant transactions, including statements relating to the pending divestiture of our NAND memory business to SK hynix Inc. (SK hynix), NAND manufacturing and supply arrangements between Intel and SK hynix, and expected additions to held for sale NAND property, plant and equipment; expected completion of restructuring activities; availability, uses, sufficiency, and cost of capital, capital resources, and funding sources, including expected returns to stockholders such as dividends; accounting estimates and judgments regarding reported matters, events and contingencies and our intentions with respect to such matters, events and contingencies, and the actual results thereof; future production capacity and product supply; the future impact of industry component and substrate constraints; the future purchase, use, and availability of, and payment for, products, components and services supplied by third parties; tax-related expectations; plans and future impacts related to export licensing and trade policies; uncertain events or assumptions; and other characterizations of future events or circumstances are forward-looking statements. Such statements are based on management's expectations as of the date of this filing, unless an earlier date is specified, and involve many risks and uncertainties that could cause our actual results to differ materially from those expressed or implied in our forward-looking statements. Such risks and uncertainties include those described throughout this report, our 2020 Form 10-K, and our Form 10-Q for the quarter ended March 27, 2021, particularly the "Risk Factors" sections of such reports. Given these risks and uncertainties, readers are cautioned not to place undue reliance on such forward-looking statements. Readers are urged to carefully review and consider the various disclosures made in this Form 10-Q and in other documents we file from time to time with the SEC that disclose risks and uncertainties that may affect our business. Unless specifically indicated otherwise, the forward-looking statements in this Form 10-Q do not reflect the potential impact of any divestitures, mergers, acquisitions, or other business combinations that have not been completed as of the date of this filing. In addition, the forward-looking statements in this Form 10-Q are made as of the date of this filing, unless an earlier date is specified, including expectations based on third-party information and projections that management believes to be reputable, and Intel does not undertake, and expressly disclaims any duty, to update such statements, whether as a result of new information, new developments, or otherwise, except to the extent that disclosure may be required by law.
Intel, the Intel logo, Intel Core, Intel Evo, Intel Optane, and Xeon are trademarks of Intel Corporation or its subsidiaries in the U.S. and/or other countries.
* Other names and brands may be claimed as the property of others.
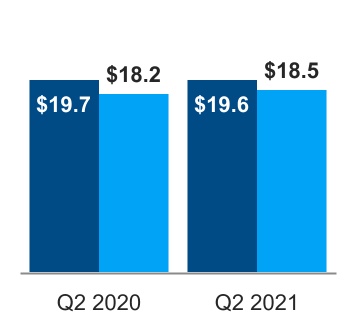
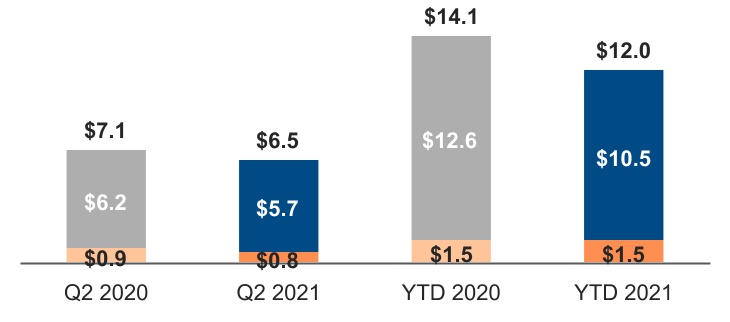
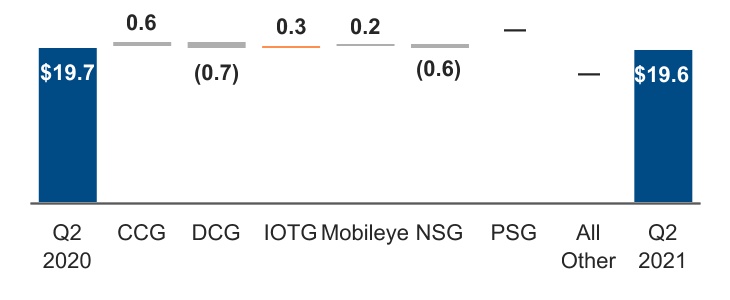
Total revenue of $19.6 billion was down $97 million year over year as DCG declined 9% and CCG grew 6%. DCG revenue declined on lower ASPs and on lower platform volume compared to a strong, COVID-driven Q2 2020. DCG revenue was also impacted by lower adjacent revenue. CCG revenue was up, due to continued strength in notebook demand and recovery in desktop demand. NSG was down due to lower ASPs and lower volume. IOTG and Mobileye were both up on higher demand amid recovery from the economic impacts of COVID-19.
| | | | | | | | | | | | | | | | | | | | |
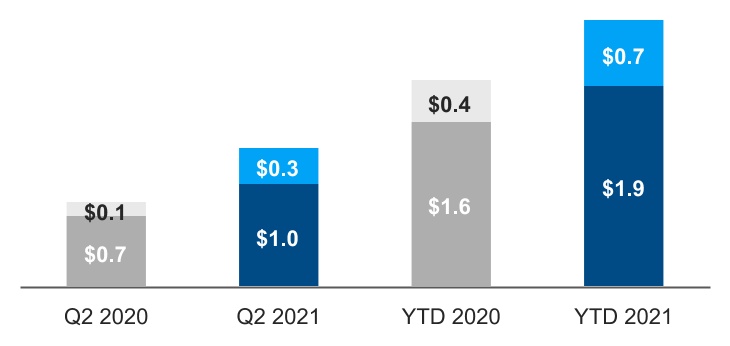
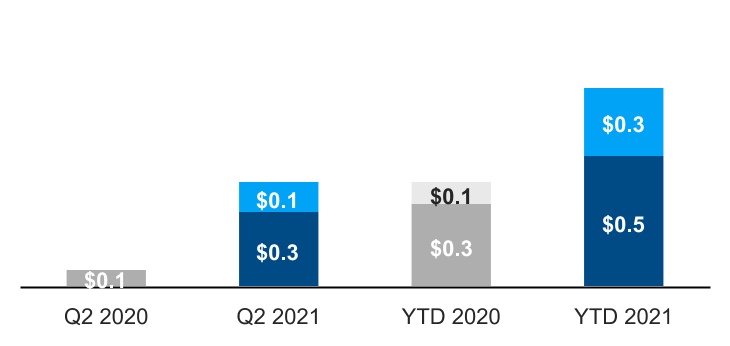
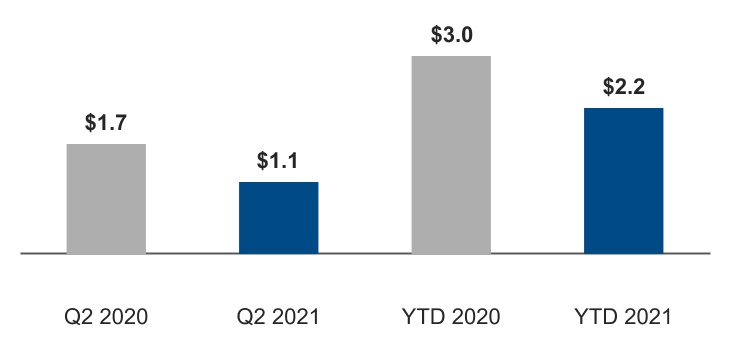
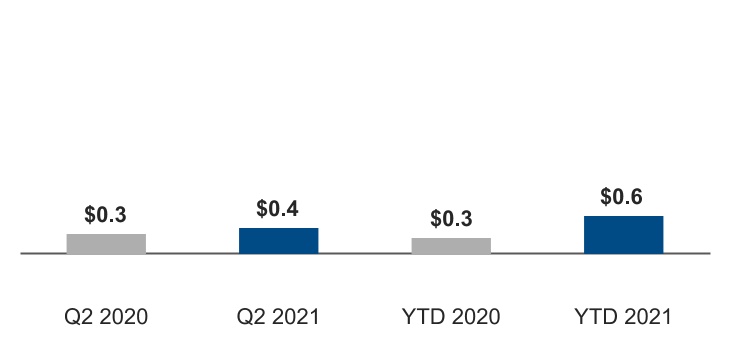
| Revenue | | Operating Income | | Diluted EPS | | Cash Flows |
■ GAAP $B ■ Non-GAAP $B | | ■ GAAP $B ■ Non-GAAP $B | | ■ GAAP ■ Non-GAAP | | ■ Operating Cash Flow $B ■ Free Cash Flow $B |
| | | | | | | | | | | | | | | | | | | | | | | | | | | | | | | | | | | | | | | | | | | | |
| | | | | | |
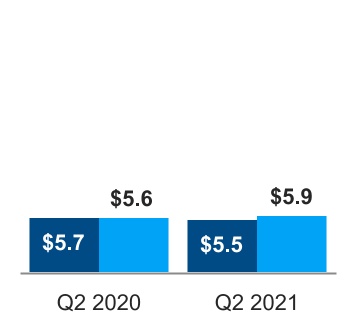
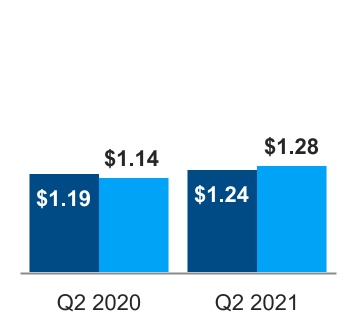
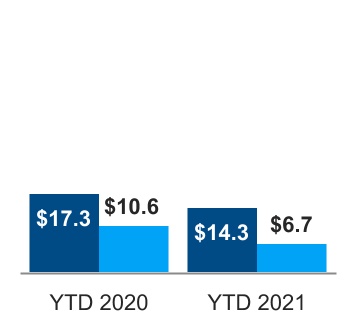
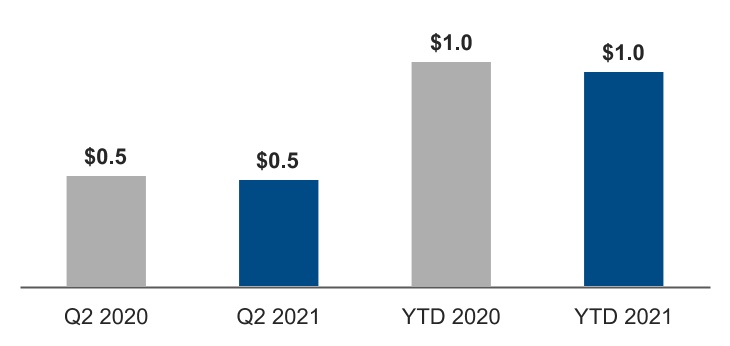
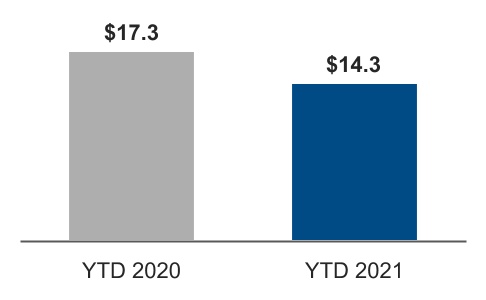
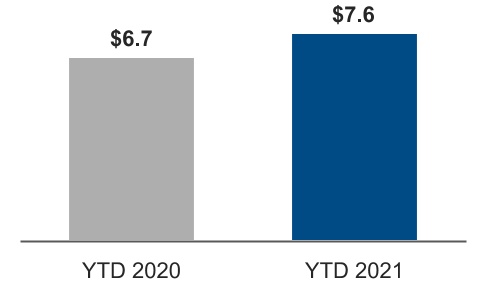
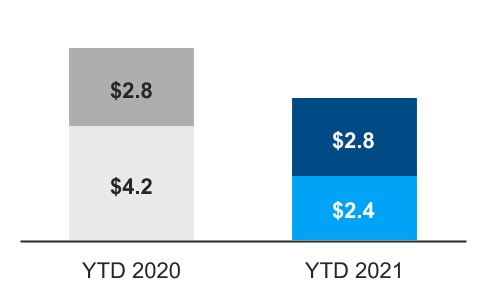
| $19.6B | | $18.5B | | $5.5B | | $5.9B | | $1.24 | | $1.28 | | $14.3B | | $6.7B |
| GAAP | | non-GAAP1 | | GAAP | | non-GAAP1 | | GAAP | | non-GAAP1 | | GAAP | | non-GAAP1 |
| Revenue down $97M or 0.5% from Q2 2020 | | Revenue up $349M or 2% from Q2 2020 | | Operating income down $151M or 3% from Q2 2020; Q2 2021 operating margin at 28% | | Operating income up $221M or 4% from Q2 2020; Q2 2021 operating margin at 32% | | Diluted EPS up $0.05 or 4% from Q2 2020 | | Diluted EPS up $0.14 or 12% from Q2 2020 | | Operating cash flow down $3.0B or 17% from Q2 2020 | | Free cash flow down $3.9B or 37% from Q2 2020 |
| | | | | | | | | | | | |
Declines in DCG and NSG, partially offset by growth in CCG, IOTG, and Mobileye. Non-GAAP revenue excludes NSG. | | Higher operating expenses from additional investments, higher corporate restructuring costs, and lower gross margin from lower platform2 revenue, partially offset by lower period charges driven by absence of reserves on non-qualified platform products taken in Q2 2020, and lower platform unit cost from 10nm cost improvements. Non-GAAP operating income excludes NSG, amortization of acquisition-related intangibles, and restructuring. | | Lower effective tax rate and lower shares, partially offset by lower operating income. Non-GAAP results incrementally exclude ongoing mark-to-market adjustments, and tax impacts of non-GAAP adjustments. | | Lower net income, net of non-cash adjustments including the Corporate VLSI charge, cash paid to settle a prepaid supply agreement in Q1 2021, and income taxes. Free cash flow decreased due to lower operating cash flow and higher capital spending. |
Key Developments
▪We announced a $3.5 billion investment to equip our Rio Rancho, New Mexico site for advanced packaging manufacturing, including our Foveros 3D packaging technology. Foveros technology enables us to build processors with compute tiles stacked vertically, rather than side-by-side, which can provide greater performance in a smaller footprint.
▪We launched the 3rd Gen Intel® Xeon® Scalable CPU (Ice Lake), which boasts up to 40 cores and delivers a significant increase in performance on average compared to the previous generation. The chips include a set of built-in security features, crypto acceleration, and artificial intelligence.
▪We launched the 11th Gen Intel® CoreTM H-series mobile processors (Tiger Lake-H), which deliver high end performance in laptops for gamers, content creators, and business professionals. We also saw broad availability of the first Intel® Evo™ platforms for the commercial segment, based on 11th Gen Intel Core mobile processors.
1 See "Non-GAAP Financial Measures" within MD&A.
2 See "Key Terms" within Consolidated Condensed Financial Statements and Supplemental Details.
| | | | | |
Consolidated Condensed Statements of Income | |
| |
| | | | | | | | | | | | | | | | | | | | | | | | | | |
| | | Three Months Ended | | Six Months Ended |
(In Millions, Except Per Share Amounts; Unaudited) | | Jun 26, 2021 | | Jun 27, 2020 | | Jun 26, 2021 | | Jun 27, 2020 |
| Net revenue | | $ | 19,631 | | | $ | 19,728 | | | $ | 39,304 | | | $ | 39,556 | |
| Cost of sales | | 8,425 | | | 9,221 | | | 17,244 | | | 17,033 | |
| Gross margin | | 11,206 | | | 10,507 | | | 22,060 | | | 22,523 | |
| Research and development | | 3,715 | | | 3,354 | | | 7,338 | | | 6,629 | |
| Marketing, general and administrative | | 1,599 | | | 1,447 | | | 2,927 | | | 2,988 | |
| Restructuring and other charges | | 346 | | | 9 | | | 2,555 | | | 171 | |
| Operating expenses | | 5,660 | | | 4,810 | | | 12,820 | | | 9,788 | |
| Operating income | | 5,546 | | | 5,697 | | | 9,240 | | | 12,735 | |
| Gains (losses) on equity investments, net | | 295 | | | 267 | | | 663 | | | 156 | |
| Interest and other, net | | (96) | | | (29) | | | (252) | | | (342) | |
| Income before taxes | | 5,745 | | | 5,935 | | | 9,651 | | | 12,549 | |
| Provision for taxes | | 684 | | | 830 | | | 1,229 | | | 1,783 | |
| Net income | | $ | 5,061 | | | $ | 5,105 | | | $ | 8,422 | | | $ | 10,766 | |
| Earnings per share—basic | | $ | 1.25 | | | $ | 1.20 | | | $ | 2.08 | | | $ | 2.53 | |
| Earnings per share—diluted | | $ | 1.24 | | | $ | 1.19 | | | $ | 2.06 | | | $ | 2.50 | |
| | | | | | | | |
| Weighted average shares of common stock outstanding: | | | | | | | | |
| Basic | | 4,049 | | | 4,246 | | | 4,053 | | | 4,256 | |
| Diluted | | 4,084 | | | 4,284 | | | 4,090 | | | 4,298 | |
See accompanying notes.
| | | | | | | | | | | |
| Financial Statements | Consolidated Condensed Statements of Income | 3 |
| | | | | |
Consolidated Condensed Statements of Comprehensive Income | |
| |
| | | | | | | | | | | | | | | | | | | | | | | | | | |
| | Three Months Ended | | Six Months Ended |
(In Millions; Unaudited) | | Jun 26, 2021 | | Jun 27, 2020 | | Jun 26, 2021 | | Jun 27, 2020 |
| Net income | | $ | 5,061 | | | $ | 5,105 | | | $ | 8,422 | | | $ | 10,766 | |
| Changes in other comprehensive income, net of tax: | | | | | | | | |
| | | | | | | | |
| | | | | | | | |
| Net unrealized holding gains (losses) on derivatives | | 6 | | | 319 | | | (344) | | | 51 | |
| Actuarial valuation and other pension benefits (expenses), net | | 12 | | | 11 | | | 25 | | | 23 | |
| Translation adjustments and other | | (10) | | | 59 | | | (25) | | | 54 | |
| Other comprehensive income (loss) | | 8 | | | 389 | | | (344) | | | 128 | |
| Total comprehensive income | | $ | 5,069 | | | $ | 5,494 | | | $ | 8,078 | | | $ | 10,894 | |
See accompanying notes.
| | | | | | | | | | | |
| Financial Statements | Consolidated Condensed Statements of Comprehensive Income | 4 |
| | | | | |
Consolidated Condensed Balance Sheets | |
| |
| | | | | | | | | | | | | | |
(In Millions) | | Jun 26, 2021 | | Dec 26, 2020 |
| | (unaudited) | | |
| Assets | | | | |
| Current assets: | | | | |
| Cash and cash equivalents | | $ | 4,746 | | | $ | 5,865 | |
| Short-term investments | | 3,014 | | | 2,292 | |
| Trading assets | | 17,097 | | | 15,738 | |
| Accounts receivable | | 7,460 | | | 6,782 | |
| Inventories | | 8,817 | | | 8,427 | |
| Assets held for sale | | 5,817 | | | 5,400 | |
| Other current assets | | 2,421 | | | 2,745 | |
| Total current assets | | 49,372 | | | 47,249 | |
| | | | |
| Property, plant and equipment, net of accumulated depreciation of $81,558 ($77,645 as of December 26, 2020) | | 58,166 | | | 56,584 | |
| Equity investments | | 5,655 | | | 5,152 | |
| Other long-term investments | | 1,262 | | | 2,192 | |
| Goodwill | | 26,768 | | | 26,971 | |
| Identified intangible assets, net | | 8,018 | | | 9,026 | |
| Other long-term assets | | 5,356 | | | 5,917 | |
| Total assets | | $ | 154,597 | | | $ | 153,091 | |
| | | | |
| Liabilities and stockholders’ equity | | | | |
| Current liabilities: | | | | |
| Short-term debt | | $ | 3,695 | | | $ | 2,504 | |
| Accounts payable | | 5,917 | | | 5,581 | |
| Accrued compensation and benefits | | 3,176 | | | 3,999 | |
| | | | |
| | | | |
| Other accrued liabilities | | 12,048 | | | 12,670 | |
| Total current liabilities | | 24,836 | | | 24,754 | |
| | | | |
| Debt | | 31,714 | | | 33,897 | |
| Contract liabilities | | 68 | | | 1,367 | |
| Income taxes payable | | 4,172 | | | 4,578 | |
| Deferred income taxes | | 3,271 | | | 3,843 | |
| Other long-term liabilities | | 5,329 | | | 3,614 | |
| Contingencies (Note 13) | | | | |
| | | | |
| Stockholders’ equity: | | | | |
| | | | |
| Common stock and capital in excess of par value, 4,057 issued and outstanding (4,062 issued and outstanding as of December 26, 2020) | | 26,655 | | | 25,556 | |
| Accumulated other comprehensive income (loss) | | (1,095) | | | (751) | |
| Retained earnings | | 59,647 | | | 56,233 | |
| Total stockholders’ equity | | 85,207 | | | 81,038 | |
| Total liabilities and stockholders’ equity | | $ | 154,597 | | | $ | 153,091 | |
See accompanying notes.
| | | | | | | | | | | |
| Financial Statements | Consolidated Condensed Balance Sheets | 5 |
| | | | | |
Consolidated Condensed Statements of Cash Flows | |
| |
| | | | | | | | | | | | | | |
| | Six Months Ended |
(In Millions; Unaudited) | | Jun 26, 2021 | | Jun 27, 2020 |
| | | | |
| Cash and cash equivalents, beginning of period | | $ | 5,865 | | | $ | 4,194 | |
| Cash flows provided by (used for) operating activities: | | | | |
| Net income | | 8,422 | | | 10,766 | |
| Adjustments to reconcile net income to net cash provided by operating activities: | | | | |
| Depreciation | | 4,862 | | | 5,248 | |
| Share-based compensation | | 1,044 | | | 941 | |
| | | | |
| Restructuring and other charges | | 2,555 | | | 171 | |
| Amortization of intangibles | | 897 | | | 865 | |
| (Gains) losses on equity investments, net | | (555) | | | (92) | |
| | | | |
| | | | |
| | | | |
| Changes in assets and liabilities: | | | | |
| Accounts receivable | | (678) | | | 224 | |
| Inventories | | (126) | | | (271) | |
| Accounts payable | | 425 | | | 208 | |
| Accrued compensation and benefits | | (836) | | | (1,025) | |
| Prepaid supply agreements | | (1,571) | | | (161) | |
| Income taxes | | 114 | | | 1,203 | |
| Other assets and liabilities | | (259) | | | (762) | |
| Total adjustments | | 5,872 | | | 6,549 | |
| Net cash provided by operating activities | | 14,294 | | | 17,315 | |
| Cash flows provided by (used for) investing activities: | | | | |
| Additions to property, plant and equipment | | (7,574) | | | (6,676) | |
| Additions to held for sale NAND property, plant and equipment | | (682) | | | — | |
| | | | |
| Purchases of available-for-sale debt investments | | (2,000) | | | (4,558) | |
| | | | |
| Maturities and sales of available-for-sale debt investments | | 2,126 | | | 1,303 | |
| Purchases of trading assets | | (14,637) | | | (11,429) | |
| Maturities and sales of trading assets | | 12,936 | | | 7,430 | |
| | | | |
| | | | |
| | | | |
| | | | |
| | | | |
| | | | |
| | | | |
| Other investing | | 380 | | | (416) | |
| Net cash used for investing activities | | (9,451) | | | (14,346) | |
| Cash flows provided by (used for) financing activities: | | | | |
| | | | |
| | | | |
| | | | |
| Issuance of long-term debt, net of issuance costs | | — | | | 10,247 | |
| Repayment of debt and debt conversion | | (500) | | | (2,775) | |
| Proceeds from sales of common stock through employee equity incentive plans | | 589 | | | 512 | |
| Repurchase of common stock | | (2,415) | | | (4,229) | |
| | | | |
| | | | |
| Payment of dividends to stockholders | | (2,821) | | | (2,811) | |
| | | | |
| | | | |
| | | | |
| Other financing | | (815) | | | 629 | |
| Net cash provided by (used for) financing activities | | (5,962) | | | 1,573 | |
| | | | |
| Net increase (decrease) in cash and cash equivalents | | (1,119) | | | 4,542 | |
| Cash and cash equivalents, end of period | | $ | 4,746 | | | $ | 8,736 | |
| | | | |
| Supplemental disclosures of noncash investing activities and cash flow information: | | | | |
| Acquisition of property, plant, and equipment included in accounts payable and accrued liabilities | | $ | 2,426 | | | $ | 2,836 | |
| | | | |
| | | | |
| Cash paid during the period for: | | | | |
| Interest, net of capitalized interest | | $ | 283 | | | $ | 252 | |
| Income taxes, net of refunds | | $ | 1,110 | | | $ | 574 | |
See accompanying notes.
| | | | | | | | | | | |
| Financial Statements | Consolidated Condensed Statements of Cash Flows | 6 |
| | | | | |
Consolidated Condensed Statements of Stockholders' Equity | |
| |
| | | | | | | | | | | | | | | | | | | | | | | | | | | | | | | | |
| | Common Stock and Capital in Excess of Par Value | | Accumulated Other Comprehensive Income (Loss) | | Retained Earnings1 | | Total |
| (In Millions, Except Per Share Amounts; Unaudited) | | Shares | | Amount | | | |
| Three Months Ended | | | | | | | | | | |
| | | | | | | | | | |
| Balance as of March 27, 2021 | | 4,038 | | | $ | 26,272 | | | $ | (1,103) | | | $ | 54,638 | | | $ | 79,807 | |
| Net income | | — | | | — | | | — | | | 5,061 | | | 5,061 | |
| Other comprehensive income (loss) | | — | | | — | | | 8 | | | — | | | 8 | |
| Employee equity incentive plans and other | | 24 | | | 23 | | | — | | | — | | | 23 | |
| Share-based compensation | | — | | | 619 | | | — | | | — | | | 619 | |
| | | | | | | | | | |
| | | | | | | | | | |
| | | | | | | | | | |
| | | | | | | | | | |
| | | | | | | | | | |
| Restricted stock unit withholdings | | (5) | | | (259) | | | — | | | (52) | | | (311) | |
| | | | | | | | | | |
| Balance as of June 26, 2021 | | 4,057 | | | $ | 26,655 | | | $ | (1,095) | | | $ | 59,647 | | | $ | 85,207 | |
| | | | | | | | | | |
| Balance as of March 28, 2020 | | 4,234 | | | $ | 25,251 | | | $ | (1,541) | | | $ | 52,644 | | | $ | 76,354 | |
| | | | | | | | | | |
| | | | | | | | | | |
| Net income | | — | | | — | | | — | | | 5,105 | | | 5,105 | |
| Other comprehensive income (loss) | | — | | | — | | | 389 | | | — | | | 389 | |
| Employee equity incentive plans and other | | 25 | | | 9 | | | — | | | — | | | 9 | |
| Share-based compensation | | — | | | 492 | | | — | | | — | | | 492 | |
| | | | | | | | | | |
| | | | | | | | | | |
| | | | | | | | | | |
| | | | | | | | | | |
| Restricted stock unit withholdings | | (6) | | | (236) | | | — | | | (103) | | | (339) | |
| | | | | | | | | | |
| | | | | | | | | | |
| Balance as of June 27, 2020 | | 4,253 | | | $ | 25,516 | | | $ | (1,152) | | | $ | 57,646 | | | $ | 82,010 | |
| | | | | | | | | | |
| Six Months Ended | | | | | | | | | | |
| | | | | | | | | | |
| Balance as of December 26, 2020 | | 4,062 | | | $ | 25,556 | | | $ | (751) | | | $ | 56,268 | | | $ | 81,073 | |
| Net income | | — | | | — | | | — | | | 8,422 | | | 8,422 | |
| Other comprehensive income (loss) | | — | | | — | | | (344) | | | — | | | (344) | |
| Employee equity incentive plans and other | | 41 | | | 588 | | | — | | | — | | | 588 | |
| Share-based compensation | | — | | | 1,044 | | | — | | | — | | | 1,044 | |
| Temporary equity reduction | | — | | | — | | | — | | | — | | | — | |
| Convertible debt | | — | | | — | | | — | | | — | | | — | |
| | | | | | | | | | |
| Repurchase of common stock | | (40) | | | (249) | | | — | | | (2,166) | | | (2,415) | |
| | | | | | | | | | |
| Restricted stock unit withholdings | | (6) | | | (284) | | | — | | | (56) | | | (340) | |
| Cash dividends declared ($0.695 per share) | | — | | | — | | | — | | | (2,821) | | | (2,821) | |
| Balance as of June 26, 2021 | | 4,057 | | | $ | 26,655 | | | $ | (1,095) | | | $ | 59,647 | | | $ | 85,207 | |
| | | | | | | | | | |
| Balance as of December 28, 2019 | | 4,290 | | | $ | 25,261 | | | $ | (1,280) | | | $ | 53,523 | | | $ | 77,504 | |
| Net income | | — | | | — | | | — | | | 10,766 | | | 10,766 | |
| Other comprehensive income (loss) | | — | | | — | | | 128 | | | — | | | 128 | |
| Employee equity incentive plans and other | | 42 | | | 629 | | | — | | | — | | | 629 | |
| Share-based compensation | | — | | | 941 | | | — | | | — | | | 941 | |
| Temporary equity reduction | | — | | | 155 | | | — | | | — | | | 155 | |
| Convertible debt | | — | | | (750) | | | — | | | — | | | (750) | |
| Repurchase of common stock | | (71) | | | (420) | | | — | | | (3,689) | | | (4,109) | |
| Restricted stock unit withholdings | | (8) | | | (300) | | | — | | | (135) | | | (435) | |
| Cash dividends declared ($0.66 per share) | | — | | | — | | | — | | | (2,819) | | | (2,819) | |
| Balance as of June 27, 2020 | | 4,253 | | | $ | 25,516 | | | $ | (1,152) | | | $ | 57,646 | | | $ | 82,010 | |
1The retained earnings balance as of December 26, 2020 includes an opening balance adjustment made as a result of the adoption of a new accounting standard in 2021.
See accompanying notes.
| | | | | | | | | | | |
| Financial Statements | Consolidated Condensed Statements of Stockholders' Equity | 7 |
| | | | | |
Notes to Consolidated Condensed Financial Statements | |
| |
| | | | | |
| Note 1 : | Basis of Presentation |
We prepared our interim Consolidated Condensed Financial Statements that accompany these notes in conformity with U.S. GAAP, consistent in all material respects with those applied in our 2020 Form 10-K.
We have made estimates and judgments affecting the amounts reported in our Consolidated Condensed Financial Statements and the accompanying notes. The actual results that we experience may differ materially from our estimates. The interim financial information is unaudited, and reflects all normal adjustments that are, in our opinion, necessary to provide a fair statement of results for the interim periods presented. This report should be read in conjunction with the Consolidated Financial Statements in our 2020 Form 10-K where we include additional information about our policies and the methods and assumptions used in our estimates.
| | | | | |
| Note 2 : | Operating Segments |
We manage our business through the following operating segments:
▪CCG
▪DCG
▪IOTG
▪Mobileye
▪NSG
▪PSG
We derive a substantial majority of our revenue from platform products, which are our principal products and considered as one product class. We offer platform products that incorporate various components and technologies, including a microprocessor and chipset, a stand-alone SoC, or a multichip package. Platform products are used in various form factors across our CCG, DCG, and IOTG operating segments. Our non-platform, or adjacent products, can be combined with platform products to form comprehensive platform solutions to meet customer needs.
CCG and DCG are our reportable operating segments. IOTG, Mobileye, NSG, and PSG do not meet the quantitative thresholds to qualify as reportable operating segments; however, we have elected to disclose the results of these non-reportable operating segments. Our Internet of Things portfolio, presented as Internet of Things, is comprised of IOTG and Mobileye operating segments. In 2021, our DCG operating segment includes the results of our Intel® OptaneTM memory business, and our NSG operating segment is composed of our NAND memory business. Refer to "Note 8: Acquisitions and Divestitures" within Notes to Consolidated Condensed Financial Statements for further information on the pending divestiture of our NAND memory business.
We have an “all other” category that includes revenue, expenses, and charges such as:
▪results of operations from non-reportable segments not otherwise presented;
▪historical results of operations from divested businesses;
▪results of operations of start-up businesses that support our initiatives, including our foundry business;
▪amounts included within restructuring and other charges;
▪a portion of employee benefits, compensation, and other expenses not allocated to the operating segments; and
▪acquisition-related costs, including amortization and any impairment of acquisition-related intangibles and goodwill.
The CODM, who is our CEO, does not evaluate operating segments using discrete asset information. Operating segments do not record inter-segment revenue. We do not allocate gains and losses from equity investments, interest and other income, or taxes to operating segments. Although the CODM uses operating income to evaluate the segments, operating costs included in one segment may benefit other segments. The accounting policies for segment reporting are the same as for Intel as a whole.
| | | | | | | | | | | |
| Financial Statements | Notes to Financial Statements | 8 |
Net revenue and operating income (loss) for each period were as follows:
| | | | | | | | | | | | | | | | | | | | | | | | | | |
| | Three Months Ended | | Six Months Ended |
(In Millions) | | Jun 26, 2021 | | Jun 27, 2020 | | Jun 26, 2021 | | Jun 27, 2020 |
| Net revenue: | | | | | | | | |
| Client Computing Group | | | | | | | | |
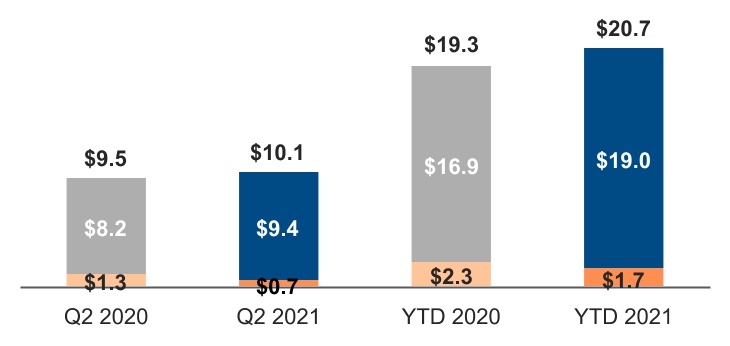
| Platform | | $ | 9,397 | | | $ | 8,229 | | | $ | 19,014 | | | $ | 16,941 | |
| Adjacent | | 712 | | | 1,267 | | | 1,700 | | | 2,330 | |
| | 10,109 | | | 9,496 | | | 20,714 | | | 19,271 | |
| Data Center Group | | | | | | | | |
| Platform | | 5,703 | | | 6,181 | | | 10,514 | | | 12,608 | |
| Adjacent | | 752 | | | 936 | | | 1,505 | | | 1,502 | |
| | 6,455 | | | 7,117 | | | 12,019 | | | 14,110 | |
| Internet of Things | | | | | | | | |
| IOTG | | 984 | | | 670 | | | 1,898 | | | 1,553 | |
| Mobileye | | 327 | | | 146 | | | 704 | | | 400 | |
| | 1,311 | | | 816 | | | 2,602 | | | 1,953 | |
| | | | | | | | |
| | | | | | | | |
| | | | | | | | |
| Non-Volatile Memory Solutions Group | | 1,098 | | | 1,659 | | | 2,205 | | | 2,997 | |
| Programmable Solutions Group | | 486 | | | 501 | | | 972 | | | 1,020 | |
| | | | | | | | |
| All other | | 172 | | | 139 | | | 792 | | | 205 | |
| Total net revenue | | $ | 19,631 | | | $ | 19,728 | | | $ | 39,304 | | | $ | 39,556 | |
| | | | | | | | |
| Operating income (loss): | | | | | | | | |
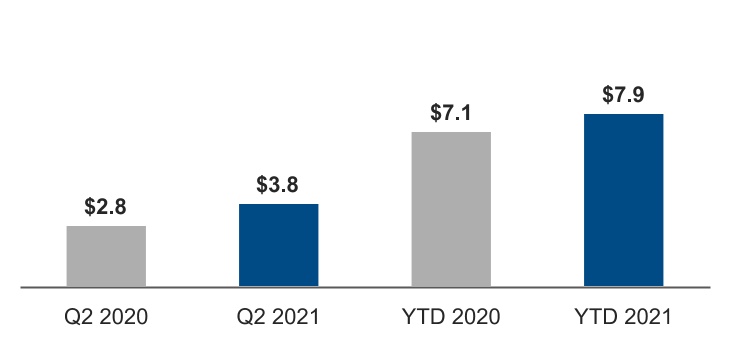
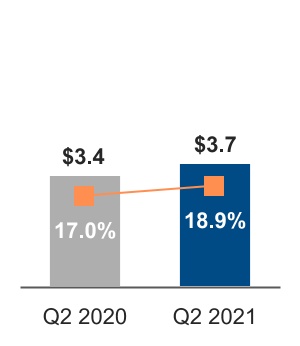
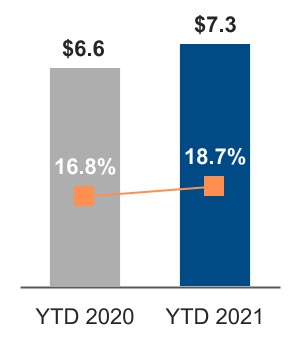
| Client Computing Group | | $ | 3,760 | | | $ | 2,842 | | | $ | 7,880 | | | $ | 7,067 | |
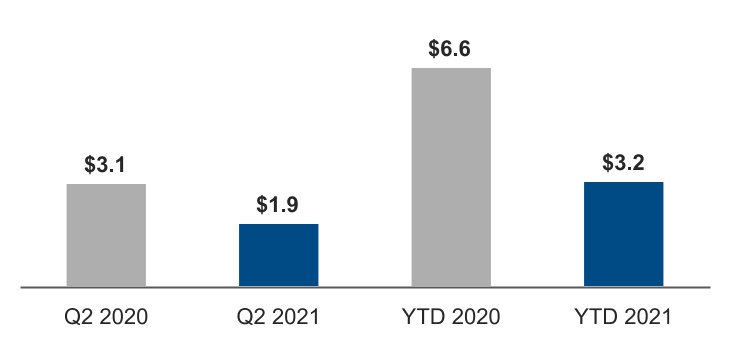
| Data Center Group | | 1,941 | | | 3,099 | | | 3,214 | | | 6,591 | |
| | | | | | | | |
| Internet of Things | | | | | | | | |
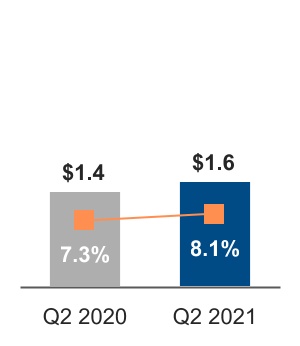
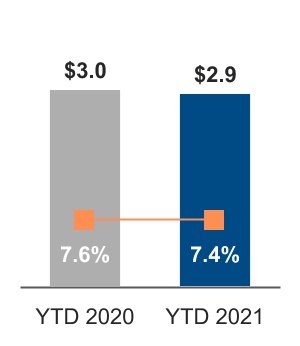
| IOTG | | 287 | | | 70 | | | 499 | | | 313 | |
| Mobileye | | 109 | | | (4) | | | 256 | | | 84 | |
| | 396 | | | 66 | | | 755 | | | 397 | |
| | | | | | | | |
| | | | | | | | |
| Non-Volatile Memory Solutions Group | | 402 | | | 322 | | | 573 | | | 256 | |
| Programmable Solutions Group | | 82 | | | 80 | | | 170 | | | 177 | |
| All other | | (1,035) | | | (712) | | | (3,352) | | | (1,753) | |
| Total operating income | | $ | 5,546 | | | $ | 5,697 | | | $ | 9,240 | | | $ | 12,735 | |
Disaggregated net revenue for each period was as follows:
| | | | | | | | | | | | | | | | | | | | | | | | | | |
| | Three Months Ended | | Six Months Ended |
(In Millions) | | Jun 26, 2021 | | Jun 27, 2020 | | Jun 26, 2021 | | Jun 27, 2020 |
| Platform revenue | | | | | | | | |
| CCG desktop platform | | $ | 2,635 | | | $ | 2,368 | | | $ | 5,279 | | | $ | 5,208 | |
| CCG notebook platform | | 6,743 | | | 5,844 | | | 13,702 | | | 11,701 | |
CCG other platform1 | | 19 | | | 16 | | | 33 | | | 31 | |
| DCG platform | | 5,703 | | | 6,181 | | | 10,514 | | | 12,608 | |
| IOTG platform | | 891 | | | 619 | | | 1,731 | | | 1,414 | |
| | 15,991 | | | 15,028 | | | 31,259 | | | 30,962 | |
| | | | | | | | |
Adjacent revenue2 | | 3,640 | | | 4,700 | | | 8,045 | | | 8,594 | |
| Total revenue | | $ | 19,631 | | | $ | 19,728 | | | $ | 39,304 | | | $ | 39,556 | |
1 Includes our tablet and service provider revenue.
2 Includes all of our non-platform products for CCG, DCG, and IOTG such as modem, Ethernet, and silicon photonics, as well as Mobileye, NSG, and PSG products, as well as revenue included in our "all other" category.
| | | | | | | | | | | |
| Financial Statements | Notes to Financial Statements | 9 |
| | | | | |
| Note 3 : | Earnings Per Share |
We computed basic earnings per share of common stock based on the weighted average number of shares of common stock outstanding during the period. We computed diluted earnings per share of common stock based on the weighted average number of shares of common stock outstanding plus potentially dilutive shares of common stock outstanding during the period.
| | | | | | | | | | | | | | | | | | | | | | | | | | |
| | | Three Months Ended | | Six Months Ended |
| (In Millions, Except Per Share Amounts) | | Jun 26, 2021 | | Jun 27, 2020 | | Jun 26, 2021 | | Jun 27, 2020 |
| Net income available to common stockholders | | $ | 5,061 | | | $ | 5,105 | | | $ | 8,422 | | | $ | 10,766 | |
| Weighted average shares of common stock outstanding—basic | | 4,049 | | | 4,246 | | | 4,053 | | | 4,256 | |
| Dilutive effect of employee equity incentive plans | | 35 | | | 38 | | | 37 | | | 42 | |
| | | | | | | | |
| Weighted average shares of common stock outstanding—diluted | | 4,084 | | | 4,284 | | | 4,090 | | | 4,298 | |
Earnings per share—basic
| | $ | 1.25 | | | $ | 1.20 | | | $ | 2.08 | | | $ | 2.53 | |
Earnings per share—diluted
| | $ | 1.24 | | | $ | 1.19 | | | $ | 2.06 | | | $ | 2.50 | |
Potentially dilutive shares of common stock from employee equity incentive plans are determined by applying the treasury stock method to the assumed exercise of outstanding stock options, the assumed vesting of outstanding RSUs, and the assumed issuance of common stock under the stock purchase plan.
Securities which would have been anti-dilutive are insignificant and are excluded from the computation of diluted earnings per share in all periods presented.
| | | | | |
| Note 4 : | Contract Liabilities |
Contract liabilities consist of prepayments received from customers on long-term prepaid supply agreements toward future product delivery and other revenue deferrals from regular ongoing business activity. Contract liabilities were $349 million as of June 26, 2021 ($1.9 billion as of December 26, 2020).
The following table shows the changes in contract liability balances relating to long-term prepaid supply agreements during the first six months of 2021:
| | | | | | | | |
| (In Millions) | | |
| Prepaid supply agreements balance as of December 26, 2020 | | $ | 1,625 | |
| | |
| Concession payment | | (950) | |
| Prepaids utilized | | (621) | |
| Prepaid supply agreements balance as of June 26, 2021 | | $ | 54 | |
During the first quarter of 2021, we settled an agreement with our largest prepaid customer whose prepayment balance made up $1.6 billion of our contract liability balance as of December 26, 2020. We returned $950 million to the customer and recognized $584 million in revenue for having completed performance of the prepaid supply agreement. The prepaid supply agreement is excluded from the NAND memory business and is recorded as Corporate revenue in the first six months of 2021 in the "all other" category presented in "Note 2: Operating Segments" within Notes to Consolidated Condensed Financial Statements.
| | | | | |
| Note 5 : | Other Financial Statement Details |
Inventories
| | | | | | | | | | | | | | |
(In Millions) | | Jun 26, 2021 | | Dec 26, 2020 |
Raw materials | | $ | 1,010 | | | $ | 908 | |
Work in process | | 5,968 | | | 5,693 | |
Finished goods | | 1,839 | | | 1,826 | |
| Total inventories | | $ | 8,817 | | | $ | 8,427 | |
| | | | | | | | | | | |
| Financial Statements | Notes to Financial Statements | 10 |
Interest and Other, Net
| | | | | | | | | | | | | | | | | | | | | | | | | | |
| | | Three Months Ended | | Six Months Ended |
(In Millions) | | Jun 26, 2021 | | Jun 27, 2020 | | Jun 26, 2021 | | Jun 27, 2020 |
Interest income | | $ | 37 | | | $ | 83 | | | $ | 74 | | | $ | 176 | |
Interest expense | | (129) | | | (186) | | | (319) | | | (321) | |
Other, net | | (4) | | | 74 | | | (7) | | | (197) | |
| Total interest and other, net | | $ | (96) | | | $ | (29) | | | $ | (252) | | | $ | (342) | |
Interest expense in the preceding table is net of $96 million of interest capitalized in the second quarter of 2021 and $193 million in the first six months of 2021 ($87 million in the second quarter of 2020 and $170 million in the first six months of 2020).
| | | | | |
| Note 6 : | Restructuring and Other Charges |
A restructuring program, which is ongoing, was approved in the first quarter of 2020 to further align our workforce with our continuing investments in the business and to execute the planned divestiture of Home Gateway Platform, a division of CCG. These actions are expected to be substantially completed in 2021.
| | | | | | | | | | | | | | | | | | | | | | | | | | | |
| | Three Months Ended | | Six Months Ended | |
| (In Millions) | | Jun 26, 2021 | | Jun 27, 2020 | | Jun 26, 2021 | | Jun 27, 2020 | |
| Employee severance and benefit arrangements | | $ | 15 | | | $ | 1 | | | $ | 22 | | | $ | 106 | | |
| | | | | | | | | |
| Litigation charges and other | | 49 | | | — | | | 2,251 | | | 57 | | |
| Asset impairment charges | | 282 | | | 8 | | | 282 | | | 8 | | |
| Total restructuring and other charges | | $ | 346 | | | $ | 9 | | | $ | 2,555 | | | $ | 171 | | |
Litigation charges and other includes a charge of $2.2 billion in the first quarter of 2021 related to the VLSI litigation, which is recorded as a Corporate charge in the "all other" category presented in "Note 2: Operating Segments" within Notes to Consolidated Condensed Financial Statements. Refer to "Note 13: Contingencies" within Notes to Consolidated Condensed Financial Statements for further information on legal proceedings related to the VLSI litigation.
Asset impairment charges includes impairments related to the shutdown in the second quarter of 2021 of two of our non-strategic businesses, the results of which are included in the “all other” category presented in “Note 2: Operating Segments” within Notes to Consolidated Condensed Financial Statements. The goodwill related to these businesses was impaired, resulting in a charge of $237 million recognized in the “all other” category along with other impairment charges related to these businesses.
Debt Investments
Trading Assets
For trading assets still held at the reporting date we recorded net gains of $2 million in the second quarter of 2021 and net losses of $226 million in the first six months of 2021 ($347 million of net gains in the second quarter of 2020 and $183 million of net gains in the first six months of 2020). Net gains on the related derivatives were $23 million in the second quarter of 2021 and net gains of $245 million in the first six months of 2021 ($251 million of net losses in the second quarter of 2020 and $204 million of net losses in the first six months of 2020).
Available-for-Sale Debt Investments
Available-for-sale investments include corporate debt, government debt, and financial institution instruments. Government debt includes instruments such as non-U.S. government bonds and U.S. agency securities. Financial institution instruments include instruments issued or managed by financial institutions in various forms, such as commercial paper, fixed- and floating-rate bonds, money market fund deposits, and time deposits. As of June 26, 2021 and December 26, 2020, substantially all time deposits were issued by institutions outside the U.S. The adjusted cost of our available-for-sale investments was $6.8 billion as of June 26, 2021 and $7.8 billion as of December 26, 2020. The adjusted cost of our available-for-sale investments approximated the fair value for these periods.
| | | | | | | | | | | |
| Financial Statements | Notes to Financial Statements | 11 |
The fair value of available-for-sale debt investments, by contractual maturity, as of June 26, 2021, was as follows:
| | | | | | | | |
(In Millions) | | Fair Value |
Due in 1 year or less | | $ | 4,826 | |
Due in 1–2 years | | 247 | |
Due in 2–5 years | | 1,015 | |
Due after 5 years | | — | |
Instruments not due at a single maturity date | | 829 | |
| Total | | $ | 6,917 | |
Equity Investments
| | | | | | | | | | | | | | |
(In Millions) | | Jun 26, 2021 | | Dec 26, 2020 |
Marketable equity securities | | $ | 1,615 | | | $ | 1,830 | |
Non-marketable equity securities | | 4,023 | | | 3,304 | |
Equity method investments | | 17 | | | 18 | |
| Total | | $ | 5,655 | | | $ | 5,152 | |
The components of gains (losses) on equity investments, net for each period were as follows:
| | | | | | | | | | | | | | | | | | | | | | | | | | | | | | |
| | | Three Months Ended | | Six Months Ended | | | |
(In Millions) | | Jun 26, 2021 | | Jun 27, 2020 | | Jun 26, 2021 | | Jun 27, 2020 | | | | |
Ongoing mark-to-market adjustments on marketable equity securities | | $ | 138 | | | $ | 165 | | | $ | (153) | | | $ | 62 | | | | | |
Observable price adjustments on non-marketable equity securities | | 72 | | | 58 | | | 623 | | | 137 | | | | | |
Impairment charges | | (35) | | | (51) | | | (73) | | | (193) | | | | | |
| Sale of equity investments and other¹ | | 120 | | | 95 | | | 266 | | | 150 | | | | | |
| Total gains (losses) on equity investments, net | | $ | 295 | | | $ | 267 | | | $ | 663 | | | $ | 156 | | | | | |
1 Sale of equity investments and other includes realized gains (losses) on sales of non-marketable equity investments, our share of equity method investees' gains (losses) and distributions, and initial fair value adjustments recorded upon a security becoming marketable.
Gains and losses for our marketable and non-marketable equity securities for each period were as follows:
| | | | | | | | | | | | | | | | | | | | | | | | | | | |
| | Three Months Ended | | Six Months Ended | |
(In Millions) | | Jun 26, 2021 | | Jun 27, 2020 | | Jun 26, 2021 | | Jun 27, 2020 | |
Net gains (losses) recognized during the period on equity securities | | $ | 226 | | | $ | 223 | | | $ | 537 | | | $ | 83 | | |
| Less: Net (gains) losses recognized during the period on equity securities sold during the period | | (26) | | | (55) | | | (125) | | | (58) | | |
| Unrealized gains (losses) recognized during the reporting period on equity securities still held at the reporting date | | $ | 200 | | | $ | 168 | | | $ | 412 | | | $ | 25 | | |
Beijing Unisoc Technology Ltd.
We account for our interest in Beijing Unisoc Technology Ltd. (Unisoc) as a non-marketable equity security. In the first quarter of 2021, we recognized $471 million in observable price adjustments in our investment in Unisoc and as of June 26, 2021, the net book value of the investment was $1.1 billion ($658 million as of December 26, 2020).
| | | | | |
| Note 8 : | Acquisitions and Divestitures |
Acquisitions
On May 4, 2020, we acquired Moovit, a MaaS solutions company, for total consideration of $915 million. The fair values of the assets acquired relate to goodwill of $638 million and intangible assets of $331 million. The goodwill arising from the acquisition is attributed to the expected synergies and other benefits that will be generated from the combination of Intel and Moovit. Substantially all of the goodwill will not be deductible for local tax purposes. The acquisition-related intangible assets are primarily related to Moovit's monthly active user base and application platform. The goodwill and operating results of Moovit are included in our Mobileye operating segment.
| | | | | | | | | | | |
| Financial Statements | Notes to Financial Statements | 12 |
Divestitures
NAND Memory Business
On October 19, 2020, we signed an agreement with SK hynix Inc. (SK hynix) to divest our NAND memory business, including our NAND memory fabrication facility in Dalian, China and certain related equipment and tangible assets (the Fab Assets), our NAND SSD business (the NAND SSD Business), and our NAND memory technology and manufacturing business (the NAND OpCo Business). Our Intel® Optane™ memory business is expressly excluded from the transaction. The transaction will occur over two closings for total consideration of $9.0 billion in cash, of which $7.0 billion will be received upon initial closing, not to occur prior to November 1, 2021, and the remaining $2.0 billion will be received no earlier than March 2025. The consummations of the first closing and the second closing are subject to customary conditions, including the receipt of certain governmental approvals.
At the first closing, Intel will sell to SK hynix the Fab Assets and the NAND SSD Business, and SK hynix will assume from Intel certain liabilities related to the Fab Assets and the NAND SSD Business. In connection with the first closing, we and certain affiliates of SK hynix will also enter into a NAND wafer manufacturing and sale agreement pursuant to which we will manufacture and sell to SK hynix NAND memory wafers to be manufactured using the Fab Assets in Dalian, China, until the second closing.
We will transfer certain employees, IP, and other assets related to the NAND OpCo Business to separately created, wholly owned subsidiaries of Intel at the first closing. The equity interest of these wholly owned subsidiaries will transfer to SK hynix at the second closing. We have concluded based on the terms of the transaction agreements that the subsidiaries will be variable interest entities for which we are not the primary beneficiary, and accordingly will deconsolidate at the first closing.
The carrying amounts of the major classes of NAND assets held for sale included the following:
| | | | | | | | | | | | | | |
| (In Millions) | | Jun 26, 2021 | | Dec 26, 2020 |
| Inventories | | $ | 699 | | | $ | 962 | |
| Property, plant and equipment, net | | 5,118 | | | 4,363 | |
| Total assets held for sale | | $ | 5,817 | | | $ | 5,325 | |
We ceased recording depreciation on property, plant and equipment as of the date the assets triggered held for sale accounting. Total capital purchases of approximately $1.8 billion expected in 2021 prior to the first closing will be classified as assets held for sale in the Consolidated Condensed Balance Sheets and within additions to held for sale NAND property, plant and equipment on the Consolidated Condensed Statements of Cash Flows.
In the second quarter of 2021, we settled $500 million of our senior notes due May 2021.
In the first quarter of 2021, we entered into a $5.0 billion variable-rate revolving credit facility which, if drawn, is expected to be used for general corporate purposes. The revolving credit facility matures in March 2026 and had no borrowings outstanding as of June 26, 2021.
We have an ongoing authorization from our Board of Directors to borrow up to $10.0 billion under our commercial paper program.
Our senior floating rate notes pay interest quarterly and our senior fixed rate notes pay interest semiannually. We may redeem the fixed rate notes prior to their maturity at our option at specified redemption prices and subject to certain restrictions. The obligations under our notes rank equally in right of payment with all of our other existing and future senior unsecured indebtedness and effectively rank junior to all liabilities of our subsidiaries.
| | | | | | | | | | | |
| Financial Statements | Notes to Financial Statements | 13 |
Assets and Liabilities Measured and Recorded at Fair Value on a Recurring Basis
| | | | | | | | | | | | | | | | | | | | | | | | | | | | | | | | | | | | | | | | | | | | | | | | | | | | |
| | Jun 26, 2021 | | Dec 26, 2020 | | |
| | Fair Value Measured and Recorded at Reporting Date Using | | | | Fair Value Measured and Recorded at Reporting Date Using | | | | |
(In Millions) | | Level 1 | | Level 2 | | Level 3 | | Total | | Level 1 | | Level 2 | | Level 3 | | Total | | |
Assets | | | | | | | | | | | | | | | | | | |
| Cash equivalents: | | | | | | | | | | | | | | | | | | |
| Corporate debt | | $ | — | | | $ | 648 | | | $ | — | | | $ | 648 | | | $ | — | | | $ | 50 | | | $ | — | | | $ | 50 | | | |
| Financial institution instruments¹ | | 829 | | | 1,064 | | | — | | | 1,893 | | | 2,781 | | | 636 | | | — | | | 3,417 | | | |
| Government debt² | | — | | | 100 | | | — | | | 100 | | | — | | | — | | | — | | | — | | | |
| Reverse repurchase agreements | | — | | | 1,350 | | | — | | | 1,350 | | | — | | | 1,900 | | | — | | | 1,900 | | | |
| Short-term investments: | | | | | | | | | | | | | | | | | | |
| Corporate debt | | — | | | 960 | | | — | | | 960 | | | — | | | 428 | | | — | | | 428 | | | |
| Financial institution instruments¹ | | — | | | 1,484 | | | — | | | 1,484 | | | — | | | 1,179 | | | — | | | 1,179 | | | |
| Government debt² | | — | | | 570 | | | — | | | 570 | | | — | | | 685 | | | — | | | 685 | | | |
| Trading assets: | | | | | | | | | | | | | | | | | | |
| | | | | | | | | | | | | | | | | | |
| Corporate debt | | — | | | 4,537 | | | — | | | 4,537 | | | — | | | 3,815 | | | — | | | 3,815 | | | |
| Financial institution instruments¹ | | 218 | | | 3,568 | | | — | | | 3,786 | | | 131 | | | 2,847 | | | — | | | 2,978 | | | |
| Government debt² | | — | | | 8,774 | | | — | | | 8,774 | | | — | | | 8,945 | | | — | | | 8,945 | | | |
| Other current assets: | | | | | | | | | | | | | | | | | | |
| Derivative assets | | 39 | | | 300 | | | — | | | 339 | | | 48 | | | 644 | | | — | | | 692 | | | |
| Loans receivable³ | | — | | | 213 | | | — | | | 213 | | | — | | | 439 | | | — | | | 439 | | | |
| Marketable equity securities | | 90 | | | 1,525 | | | — | | | 1,615 | | | 136 | | | 1,694 | | | — | | | 1,830 | | | |
| Other long-term investments: | | | | | | | | | | | | | | | | | | |
| | | | | | | | | | | | | | | | | | |
| Corporate debt | | — | | | 892 | | | — | | | 892 | | | — | | 1,520 | | | — | | 1,520 | | | |
| Financial institution instruments¹ | | — | | | 216 | | | — | | | 216 | | | — | | 257 | | | — | | 257 | | | |
| Government debt² | | — | | | 154 | | | — | | | 154 | | | — | | 415 | | | — | | 415 | | | |
| Other long-term assets: | | | | | | | | | | | | | | | | | | |
| Derivative assets | | — | | | 1,029 | | | 16 | | | 1,045 | | | — | | | 1,520 | | | 30 | | | 1,550 | | | |
| Loans receivable³ | | — | | | — | | | — | | | — | | | — | | 157 | | | — | | 157 | | | |
| Total assets measured and recorded at fair value | | $ | 1,176 | | | $ | 27,384 | | | $ | 16 | | | $ | 28,576 | | | $ | 3,096 | | | $ | 27,131 | | | $ | 30 | | | $ | 30,257 | | | |
| Liabilities | | | | | | | | | | | | | | | | | | |
| Other accrued liabilities: | | | | | | | | | | | | | | | | | | |
| Derivative liabilities | | $ | 5 | | | $ | 613 | | | $ | — | | | $ | 618 | | | $ | — | | | $ | 810 | | | $ | — | | | $ | 810 | | | |
| | | | | | | | | | | | | | | | | | |
| Other long-term liabilities: | | | | | | | | | | | | | | | | | | |
| Derivative liabilities | | — | | | 4 | | | — | | | 4 | | | — | | | 5 | | | — | | | 5 | | | |
| Total liabilities measured and recorded at fair value | | $ | 5 | | | $ | 617 | | | $ | — | | | $ | 622 | | | $ | — | | | $ | 815 | | | $ | — | | | $ | 815 | | | |
1Level 1 investments consist of money market funds. Level 2 investments consist primarily of commercial paper, certificates of deposit, time deposits, and notes and bonds issued by financial institutions.
2Level 2 investments consist primarily of U.S. agency notes and non-U.S. government debt.
3The fair value of our loans receivable for which we elected the fair value option did not significantly differ from the contractual principal balance.
Assets Measured and Recorded at Fair Value on a Non-Recurring Basis
Our non-marketable equity securities, equity method investments, and certain non-financial assets, such as intangible assets and property, plant and equipment, are recorded at fair value only if an impairment or observable price adjustment is recognized in the current period. If an observable price adjustment or impairment is recognized on our non-marketable equity securities during the period, we classify these assets as Level 3.
| | | | | | | | | | | |
| Financial Statements | Notes to Financial Statements | 14 |
Financial Instruments Not Recorded at Fair Value on a Recurring Basis
Financial instruments not recorded at fair value on a recurring basis include non-marketable equity securities and equity method investments that have not been remeasured or impaired in the current period, grants receivable, and issued debt.
We classify the fair value of grants receivable as Level 2. The estimated fair value of these financial instruments approximates their carrying value. The aggregate carrying value of grants receivable as of June 26, 2021 was $260 million (the aggregate carrying value of grants receivable as of December 26, 2020 was $139 million).
We classify the fair value of issued debt (excluding commercial paper and drafts payable) as Level 2. The fair value of these instruments was $39.0 billion as of June 26, 2021 ($40.9 billion as of December 26, 2020).
| | | | | |
| Note 11 : | Other Comprehensive Income (Loss) |
The changes in accumulated other comprehensive income (loss) by component and related tax effects in the first six months of 2021 were as follows:
| | | | | | | | | | | | | | | | | | | | | | | | | | | | | | |
| (In Millions) | | | | | | Unrealized Holding Gains (Losses) on Derivatives | | Actuarial Valuation and Other Pension Expenses | | Translation Adjustments and Other | | Total |
| Balance as of December 26, 2020 | | | | | | $ | 731 | | | $ | (1,565) | | | $ | 83 | | | $ | (751) | |
| Other comprehensive income (loss) before reclassifications | | | | | | (285) | | | 3 | | | (32) | | | (314) | |
| Amounts reclassified out of accumulated other comprehensive income (loss) | | | | | | (161) | | | 31 | | | — | | | (130) | |
| Tax effects | | | | | | 102 | | | (9) | | | 7 | | | 100 | |
| Other comprehensive income (loss) | | | | | | (344) | | | 25 | | | (25) | | | (344) | |
| Balance as of June 26, 2021 | | | | | | $ | 387 | | | $ | (1,540) | | | $ | 58 | | | $ | (1,095) | |
We estimate that we will reclassify approximately $115 million (before taxes) of net derivative gains included in accumulated other comprehensive income (loss) into earnings within the next 12 months.
| | | | | |
| Note 12 : | Derivative Financial Instruments |
Volume of Derivative Activity
Total gross notional amounts for outstanding derivatives at the end of each period were as follows:
| | | | | | | | | | | | | | | | |
(In Millions) | | Jun 26, 2021 | | Dec 26, 2020 | | |
Foreign currency contracts | | $ | 30,726 | | | $ | 31,209 | | | |
Interest rate contracts | | 14,652 | | | 14,461 | | | |
Other | | 2,274 | | | 2,026 | | | |
| Total | | $ | 47,652 | | | $ | 47,696 | | | |
| | | | | | | | | | | |
| Financial Statements | Notes to Financial Statements | 15 |
Fair Value of Derivative Instruments
| | | | | | | | | | | | | | | | | | | | | | | | | | |
| | Jun 26, 2021 | | Dec 26, 2020 |
(In Millions) | | Assets1 | | Liabilities2 | | Assets1 | | Liabilities2 |
Derivatives designated as hedging instruments: | | | | | | | | |
Foreign currency contracts3 | | $ | 143 | | | $ | 95 | | | $ | 551 | | | $ | 2 | |
Interest rate contracts | | 1,021 | | | — | | | 1,498 | | | — | |
Total derivatives designated as hedging instruments | | 1,164 | | | 95 | | | 2,049 | | | 2 | |
Derivatives not designated as hedging instruments: | | | | | | | | |
Foreign currency contracts3 | | 173 | | | 428 | | | 142 | | | 685 | |
Interest rate contracts | | 8 | | | 94 | | | 3 | | | 128 | |
Equity contracts | | 39 | | | 5 | | | 48 | | | — | |
| Total derivatives not designated as hedging instruments | | 220 | | | 527 | | | 193 | | | 813 | |
| Total derivatives | | $ | 1,384 | | | $ | 622 | | | $ | 2,242 | | | $ | 815 | |
1Derivative assets are recorded as other assets, current and non-current.
2Derivative liabilities are recorded as other liabilities, current and non-current.
3The majority of these instruments mature within 12 months.
Amounts Offset in the Consolidated Condensed Balance Sheets
The gross amounts of our derivative instruments and reverse repurchase agreements subject to master netting arrangements with various counterparties, and cash and non-cash collateral posted under such agreements at the end of each period were as follows:
| | | | | | | | | | | | | | | | | | | | | | | | | | | | | | | | | | | | | | |
| | Jun 26, 2021 |
| | | | | | | | Gross Amounts Not Offset in the Balance Sheet | | |
(In Millions) | | Gross Amounts Recognized | | Gross Amounts Offset in the Balance Sheet | | Net Amounts Presented in the Balance Sheet | | Financial Instruments | | Cash and Non-Cash Collateral Received or Pledged | | Net Amount |
Assets: | | | | | | | | | | | | |
| Derivative assets subject to master netting arrangements | | $ | 1,378 | | | | | $ | 1,378 | | | $ | (343) | | | $ | (1,033) | | | $ | 2 | |
Reverse repurchase agreements | | 1,350 | | | — | | | 1,350 | | | — | | | (1,350) | | | — | |
| Total assets | | 2,728 | | | — | | | 2,728 | | | (343) | | | (2,383) | | | 2 | |
| Liabilities: | | | | | | | | | | | | |
| Derivative liabilities subject to master netting arrangements | | 495 | | | — | | | 495 | | | (343) | | | (152) | | | — | |
| Total liabilities | | $ | 495 | | | $ | — | | | $ | 495 | | | $ | (343) | | | $ | (152) | | | $ | — | |
| | | | | | | | | | | |
| Financial Statements | Notes to Financial Statements | 16 |
| | | | | | | | | | | | | | | | | | | | | | | | | | | | | | | | | | | | | | |
| | Dec 26, 2020 |
| | | | | | | | Gross Amounts Not Offset in the Balance Sheet | | |
| (In Millions) | | Gross Amounts Recognized | | Gross Amounts Offset in the Balance Sheet | | Net Amounts Presented in the Balance Sheet | | Financial Instruments | | Cash and Non-Cash Collateral Received or Pledged | | Net Amount |
| Assets: | | | | | | | | | | | | |
| Derivative assets subject to master netting arrangements | | $ | 2,235 | | | $ | — | | | $ | 2,235 | | | $ | (264) | | | $ | (1,904) | | | $ | 67 | |
| Reverse repurchase agreements | | 1,900 | | | — | | | 1,900 | | | — | | | (1,900) | | | — | |
| Total assets | | 4,135 | | | — | | | 4,135 | | | (264) | | | (3,804) | | | 67 | |
| Liabilities: | | | | | | | | | | | | |
| Derivative liabilities subject to master netting arrangements | | 711 | | | — | | | 711 | | | (264) | | | (447) | | | — | |
| Total liabilities | | $ | 711 | | | $ | — | | | $ | 711 | | | $ | (264) | | | $ | (447) | | | $ | — | |
We obtain and secure available collateral from counterparties against obligations, including securities lending transactions and reverse repurchase agreements, when we deem it appropriate.
Derivatives in Cash Flow Hedging Relationships
The before-tax net gains or losses attributed to cash flow hedges, recognized in other comprehensive income (loss), were $49 million net gains in the second quarter of 2021 and $285 million net losses in the first six months of 2021 ($392 million net gains in the second quarter of 2020 and $19 million net gains in the first six months of 2020). Substantially all of our cash flow hedges were foreign currency contracts for all periods presented.
During the first six months of 2021 and 2020, the amounts excluded from effectiveness testing were insignificant.
Derivatives in Fair Value Hedging Relationships
The effects of derivative instruments designated as fair value hedges, recognized in interest and other, net for each period were as follows:
| | | | | | | | | | | | | | | | | | | | | | | | | | | | | | |
| | Gains (Losses) Recognized in Consolidated Condensed Statements of Income on Derivatives |
| | Three Months Ended | | Six Months Ended | | |
(In Millions) | | Jun 26, 2021 | | Jun 27, 2020 | | Jun 26, 2021 | | Jun 27, 2020 | | | | |
Interest rate contracts | | $ | 35 | | | $ | 78 | | | $ | (477) | | | $ | 1,032 | | | | | |
Hedged items | | (35) | | | (78) | | | 477 | | | (1,032) | | | | | |
| Total | | $ | — | | | $ | — | | | $ | — | | | $ | — | | | | | |
The amounts recorded on the Consolidated Condensed Balance Sheets related to cumulative basis adjustments for fair value hedges for each period were as follows:
| | | | | | | | | | | | | | | | | | | | | | | | | | | |
| Line Item in the Consolidated Condensed Balance Sheet in Which the Hedged Item is Included | | Carrying Amount of the Hedged Item Asset/(Liabilities) | | Cumulative Amount of Fair Value Hedging Adjustment Included in the Carrying Amount Assets/(Liabilities) | |
(In Millions) | | Jun 26, 2021 | | Dec 26, 2020 | | Jun 26, 2021 | | Dec 26, 2020 | |
| Long-term debt | | $ | (13,018) | | | $ | (13,495) | | | $ | (1,021) | | | $ | (1,498) | | |
The total notional amount of pay-variable and receive-fixed interest rate swaps was $12.0 billion as of June 26, 2021 and as of December 26, 2020.
| | | | | | | | | | | |
| Financial Statements | Notes to Financial Statements | 17 |
Derivatives Not Designated as Hedging Instruments
The effects of derivative instruments not designated as hedging instruments on the Consolidated Condensed Statements of Income for each period were as follows:
| | | | | | | | | | | | | | | | | | | | | | | | | | | | | | | | | | | | |
| | | | Three Months Ended | | Six Months Ended | | |
(In Millions) | | Location of Gains (Losses)
Recognized in Income on Derivatives | | Jun 26, 2021 | | Jun 27, 2020 | | Jun 26, 2021 | | Jun 27, 2020 | | | | |
Foreign currency contracts | | Interest and other, net | | $ | (22) | | | $ | (216) | | | $ | 212 | | | $ | (62) | | | | | |
Interest rate contracts | | Interest and other, net | | (2) | | | (14) | | | 21 | | | (91) | | | | | |
Other | | Various | | 140 | | | 225 | | | 195 | | | (43) | | | | | |
| Total | | | | $ | 116 | | | $ | (5) | | | $ | 428 | | | $ | (196) | | | | | |
Legal Proceedings
We are a party to various legal proceedings, including those noted in this section. In the first quarter of 2021, we accrued a charge of $2.2 billion related to litigation involving VLSI, described below. Excluding this charge, management at present believes that the ultimate outcome of these proceedings, individually and in the aggregate, will not materially harm our financial position, results of operations, cash flows, or overall trends; however, legal proceedings and related government investigations are subject to inherent uncertainties, and unfavorable rulings or other events could occur. Unfavorable resolutions could include substantial monetary damages. In addition, in matters for which injunctive relief or other conduct remedies are sought, unfavorable resolutions could include an injunction or other order prohibiting us from selling one or more products at all or in particular ways, precluding particular business practices, or requiring other remedies. An unfavorable outcome may result in a material adverse impact on our business, results of operations, financial position, and overall trends. We might also conclude that settling one or more such matters is in the best interests of our stockholders, employees, and customers, and any such settlement could include substantial payments. Except as specifically described below, we have not concluded that settlement of any of the legal proceedings noted in this section is appropriate at this time.
European Commission Competition Matter
In 2001, the EC commenced an investigation regarding claims by Advanced Micro Devices, Inc. (AMD) that we used unfair business practices to persuade customers to buy our microprocessors. We received numerous requests for information and documents from the EC and we responded to each of those requests. The EC issued a Statement of Objections in July 2007 and held a hearing on that Statement in March 2008. The EC issued a Supplemental Statement of Objections in July 2008. In May 2009, the EC issued a decision finding that we had violated Article 82 of the EC Treaty and Article 54 of the European Economic Area Agreement. In general, the EC found that we violated Article 82 (later renumbered as Article 102 by a new treaty) by offering alleged "conditional rebates and payments" that required our customers to purchase all or most of their x86 microprocessors from us. The EC also found that we violated Article 82 by making alleged "payments to prevent sales of specific rival products." The EC imposed a fine in the amount of €1.1 billion ($1.4 billion as of May 2009), which we subsequently paid during the third quarter of 2009, and ordered us to "immediately bring to an end the infringement referred to in" the EC decision.
The EC decision contained no specific direction on whether or how we should modify our business practices. Instead, the decision stated that we should "cease and desist" from further conduct that, in the EC's opinion, would violate applicable law. We took steps, which are subject to the EC's ongoing review, to comply with that decision pending appeal. We had discussions with the EC to better understand the decision and to explain changes to our business practices.
We appealed the EC decision to the Court of First Instance (which has been renamed the General Court) in July 2009. The hearing of our appeal took place in July 2012. In June 2014, the General Court rejected our appeal in its entirety. In August 2014, we filed an appeal with the European Court of Justice. In November 2014, Intervener Association for Competitive Technologies filed comments in support of Intel’s grounds of appeal. The EC and interveners filed briefs in November 2014, we filed a reply in February 2015, and the EC filed a rejoinder in April 2015. The Court of Justice held oral argument in June 2016. In October 2016, Advocate General Wahl, an advisor to the Court of Justice, issued a non-binding advisory opinion that favored Intel on a number of grounds. The Court of Justice issued its decision in September 2017, setting aside the judgment of the General Court and sending the case back to the General Court to examine whether the rebates at issue were capable of restricting competition. The General Court has appointed a panel of five judges to consider our appeal of the EC’s 2009 decision in light of the Court of Justice’s clarifications of the law. In November 2017, the parties filed initial “Observations” about the Court of Justice’s decision and the appeal and were invited by the General Court to offer supplemental comments to each other’s “Observations,” which the parties submitted in March 2018. Responses to other questions posed by the General Court were filed in May and June 2018. The General Court heard oral argument in March 2020. Pending the final decision in this matter, the fine paid by Intel has been placed by the EC in commercial bank accounts where it accrues interest.
| | | | | | | | | | | |
| Financial Statements | Notes to Financial Statements | 18 |
Litigation Related to Security Vulnerabilities
In June 2017, a Google research team notified us and other companies that it had identified security vulnerabilities (now commonly referred to as “Spectre” and “Meltdown”) that affect many types of microprocessors, including our products. As is standard when findings like these are presented, we worked together with other companies in the industry to verify the research and develop and validate software and firmware updates for impacted technologies. On January 3, 2018, information on the security vulnerabilities was publicly reported, before software and firmware updates to address the vulnerabilities were made widely available.
Numerous lawsuits have been filed against Intel and, in certain cases, our current and former executives and directors, in U.S. federal and state courts and in certain courts in other countries relating to the Spectre and Meltdown security vulnerabilities, as well as other variants of these vulnerabilities that have since been identified.
As of July 21, 2021, consumer class action lawsuits relating to the above class of security vulnerabilities publicly disclosed since 2018 were pending in the United States, Canada, and Israel. The plaintiffs, who purport to represent various classes of purchasers of our products, generally claim to have been harmed by Intel's actions and/or omissions in connection with the security vulnerabilities and assert a variety of common law and statutory claims seeking monetary damages and equitable relief. In the United States, numerous individual class action suits filed in various jurisdictions were consolidated in April 2018 for all pretrial proceedings in the U.S. District Court for the District of Oregon. In March 2020, the court granted Intel's motion to dismiss the complaint in that consolidated action but granted plaintiffs leave to amend. In March 2021, the court granted Intel’s motion to dismiss the amended complaint, but granted plaintiffs leave to further amend in part. Plaintiffs filed a further amended complaint in May 2021 which Intel moved to dismiss in July 2021. In Canada, in one case pending in the Superior Court of Justice of Ontario, an initial status conference has not yet been scheduled. In a second case pending in the Superior Court of Justice of Quebec, a stay of the case is in effect until July 2021. In Israel, two consumer class action lawsuits were filed in the District Court of Haifa. In the first case, the District Court denied the parties' joint motion to stay filed in January 2019, and subsequently set a July 2021 deadline for Intel to respond to the complaint. Intel filed a motion to stay the second case pending resolution of the consolidated proceeding in the United States, and a hearing on that motion has been scheduled for October 2021. Additional lawsuits and claims may be asserted seeking monetary damages or other related relief. We dispute the pending claims described above and intend to defend those lawsuits vigorously. Given the procedural posture and the nature of those cases, including that the pending proceedings are in the early stages, that alleged damages have not been specified, that uncertainty exists as to the likelihood of a class or classes being certified or the ultimate size of any class or classes if certified, and that there are significant factual and legal issues to be resolved, we are unable to make a reasonable estimate of the potential loss or range of losses, if any, that might arise from those matters.
In addition to these lawsuits, Intel stockholders filed multiple shareholder derivative lawsuits since January 2018 against certain current and former members of our Board of Directors and certain current and former officers, alleging that the defendants breached their duties to Intel in connection with the disclosure of the security vulnerabilities and the failure to take action in relation to alleged insider trading. The complaints sought to recover damages from the defendants on behalf of Intel. Some of the derivative actions were filed in the U.S. District Court for the Northern District of California and were consolidated, and the others were filed in the Superior Court of the State of California in San Mateo County and were consolidated. The federal court granted defendants' motion to dismiss in August 2018 on the ground that plaintiffs failed to plead facts sufficient to show they were excused from making a pre-lawsuit demand on the Board. The federal court granted plaintiffs leave to amend their complaint, but subsequently dismissed the cases in January 2019 at plaintiffs' request. The California Superior Court entered judgment in defendants' favor in August 2020 after granting defendants' motions to dismiss plaintiffs' consolidated complaint and three successive amended complaints, all for failure to plead facts sufficient to show plaintiffs were excused from making pre-lawsuit demand on the Board. Plaintiffs filed a notice of appeal of the California court's judgment in October 2020.
In January 2021, another Intel stockholder filed a derivative lawsuit in the Superior Court in San Mateo County against certain current and former officers and members of our Board of Directors. The lawsuit asserts claims similar to those dismissed in August 2020, except that it alleges that the stockholder made a pre-lawsuit demand on our Board of Directors and that the demand was wrongfully refused. In May 2021, the court granted defendants' motion to stay the action pending the outcome of any litigation plaintiff may choose to file in Delaware where Intel’s bylaws require such claims be filed.
| | | | | | | | | | | |
| Financial Statements | Notes to Financial Statements | 19 |
Institute of Microelectronics, Chinese Academy of Sciences v. Intel China, Ltd., et al.
In February 2018, the Institute of Microelectronics of the Chinese Academy of Sciences (IMECAS) sued Intel China, Ltd., Dell China, Ltd. (Dell), and Beijing JingDong Century Information Technology, Ltd. (JD) for patent infringement in the Beijing High Court. IMECAS alleges that Intel’s Core series processors infringe Chinese patent CN 102956457 (’457 Patent). The complaint demands an injunction and damages of at least RMB 200 million plus the cost of litigation. A trial date is not yet set. In March 2018, Dell tendered indemnity to Intel, which Intel granted in April 2018. JD also tendered indemnity to Intel, which Intel granted in October 2018. In March 2018, Intel filed an invalidation request on the ‘457 patent with the Chinese Patent Review Board (PRB). The PRB held an oral hearing in September 2018 and in February 2019 upheld the validity of the challenged claims. Intel filed a complaint in April 2019 with the Beijing Intellectual Property Court challenging the February 2019 PRB ruling. The Beijing IP Court has since scheduled a hearing for July 2021. In January 2020, Intel filed a second invalidation request on the ‘457 patent with the PRB, for which the PRB heard oral argument in July 2020 and in November 2020 held the challenged apparatus claims invalid. IMECAS filed a complaint in February 2021 with the Beijing IP Court challenging the November 2020 PRB ruling. In December 2020, Intel filed a third invalidation request on the ’457 patent with the PRB, which heard oral argument in June 2021. In September 2018 and March 2019, Intel filed petitions with the U.S. Patent & Trademark Office (USPTO) requesting institution of inter partes review (IPR) of U.S. Patent No. 9,070,719, the U.S. counterpart to the ‘457 patent. The USPTO denied institution of Intel’s petitions in March and October 2019, respectively. In April 2019, Intel filed a request for rehearing and a petition for a Precedential Opinion Panel (POP) in the USPTO to challenge the denial of its first IPR petition, and in November 2019 Intel filed a request for rehearing on the second IPR petition. In January 2020, the USPTO denied the POP petition on the first IPR petition. In June 2020, the Patent Trial and Appeal Board denied Intel's rehearing requests on both petitions.
In October 2019, IMECAS filed second and third lawsuits, in the Beijing IP Court, alleging infringement of Chinese Patent No. CN 102386226 (‘226 Patent) based on the manufacturing and sale of Intel’s Core i3 microprocessors. Defendants in the second case are Lenovo (Beijing) Co., Ltd. (Lenovo) and Beijing Jiayun Huitong Technology Development Co. Ltd. (BJHT). Defendants in the third case are Intel Corp., Intel China Co., Ltd., the Intel China Beijing Branch, Beijing Digital China Co., Ltd. (Digital China), and JD. Both complaints demand injunctions plus litigation costs. The complaint in the second lawsuit reserves the right to claim damages in unspecified amounts. The complaint in the third lawsuit claims damages of RMB 10 million. Intel China's jurisdictional challenge was denied in June 2021. No trial proceedings have occurred or are yet scheduled in these lawsuits. In December 2019, Lenovo tendered indemnity to Intel, which Intel granted in March 2020. In July 2020, Intel and Lenovo filed invalidation requests on the '226 patent with the Chinese PRB. The PRB heard oral argument in December 2020, during which IMECAS proposed amendments to two claims. The PRB ruled in April 2021 on both invalidation requests, finding the two amended claims as well as the unamended claims not invalid. Intel and Lenovo filed complaints in July 2021 with the Beijing IP Court challenging the April 2021 PRB rulings. Given the procedural posture and the nature of these cases, the unspecified nature and extent of damages claimed by IMECAS, and uncertainty regarding the availability of injunctive relief under applicable law, we are unable to make a reasonable estimate of the potential loss or range of losses, if any, arising from these matters. We dispute IMECAS’s claims and intend to vigorously defend against them.
VLSI Technology LLC v. Intel
In October 2017, VLSI filed a complaint against Intel in the U.S. District Court for the Northern District of California alleging infringement of eight patents acquired from NXP Semiconductors, N.V. (NXP). The patents, which originated at Freescale Semiconductor, Inc. and NXP B.V., are U.S. Patent Nos. 7,268,588; 7,675,806; 7,706,207; 7,709,303; 8,004,922; 8,020,014; 8,268,672; and 8,566,836. VLSI accuses various FPGA and processor products of infringement. VLSI estimated its damages to be as high as $7.1 billion, and its complaint further sought enhanced damages, future royalties, attorneys’ fees, costs, and interest. In May, June, September, and October 2018, Intel filed IPR petitions challenging the patentability of certain claims in all eight of the patents in-suit. The PTAB instituted review of six patents and denied institution on two patents. As a result of the institution decisions, the parties stipulated to stay the District Court action in March 2019. In December 2019 and February 2020, the PTAB found all claims of the '588 and '303 patents, and some claims of the '922 patent, to be unpatentable. The PTAB found the challenged claims of the '014, '672, and '207 patents to be patentable. Intel moved for a continuation of the stay in March 2020 as it appealed certain rulings by the PTAB. In June 2020, the District Court issued an order continuing the stay through August 2021 and setting trial for December 2022. The Federal Circuit has thus far affirmed the PTAB’s decisions as to the ‘207 and ‘672 patents, and reversed the PTAB’s decision as to the ‘014 patent.
In June 2018, VLSI filed a second suit against Intel, in U.S. District Court for the District of Delaware, alleging infringement by various Intel processors of five additional patents acquired from NXP: U.S. Patent Nos. 6,212,663; 7,246,027; 7,247,552; 7,523,331; and 8,081,026. VLSI accused Intel of willful infringement and seeks an injunction or, in the alternative, ongoing royalties, enhanced damages, attorneys’ fees and costs, and interest. In March 2019, the District Court dismissed VLSI’s claims for willful infringement as to all the patents-in-suit except the ‘027 patent, and also dismissed VLSI’s allegations of indirect infringement as to the ‘633, ‘331, and ‘026 patents. In June 2019, Intel filed requests for inter partes review of the patentability of claims in all five patents-in-suit. In January 2020, the District Court vacated an earlier November 2020 trial date based on agreement of the parties; no trial date is currently set. In January 2020, VLSI said that it was no longer asserting any claims of the ‘633 patent. In January and February 2020, the PTAB instituted review of the '552, '633, '331, and '026 patents, but declined to institute review on the '027 patent. As a result, Intel moved for stay of the District Court proceedings. In May 2020, the District Court stayed the case as to the '026 and '552 patents but allowed the case to proceed on the '027 and '331 patents. In January 2021, the PTAB invalidated certain asserted claims of the ‘026 patent, and in February the PTAB invalidated all asserted claims of the ‘552 patent. Intel filed a notice of appeal regarding the PTAB’s decision as to the ‘026 patent in March 2021, and the case remains stayed as to that patent and the '552 patent. For the '027 and '331 patents, VLSI is seeking damages of approximately $4.13 billion plus enhanced damages for the '027 patent.
| | | | | | | | | | | |
| Financial Statements | Notes to Financial Statements | 20 |
In March 2019, VLSI filed a third suit against Intel, also in U.S. District Court for the District of Delaware, alleging infringement of six more patents acquired from NXP: U.S. Patent Nos. 6,366,522; 6,663,187; 7,292,485; 7,606,983; 7,725,759; and 7,793,025. In April 2019, VLSI voluntarily dismissed this Delaware case without prejudice. In April 2019, VLSI filed three new infringement suits against Intel in the U.S. District Court for the Western District of Texas (WDTX) accusing various Intel processors of infringement. The three suits collectively assert the same six patents from the voluntarily dismissed Delaware case plus two additional patents acquired from NXP, U.S. Patent Nos. 7,523,373 and 8,156,357. VLSI accuses Intel of willful infringement and seeks an injunction or, in the alternative, ongoing royalties, enhanced damages, attorneys’ fees and costs, and interest. In the first Texas case, VLSI asserted the ‘373 and ‘759 patents (in December 2020 the court granted Intel summary judgment of non-infringement on the ‘357 patent, which had also been asserted in the first Texas case). That case went to trial in February 2021, and the jury awarded a “lump sum” to VLSI of $1.5 billion for literal infringement of the ‘373 patent and $675 million for infringement under the doctrine of equivalents of the ‘759 patent. The jury found that Intel had not willfully infringed either patent. Intel plans to challenge the verdict in post-trial motions and on appeal. The second Texas case went to trial in April 2021, and the jury found that Intel does not infringe the ‘522 and ‘187 patents. VLSI had sought approximately $3 billion for alleged infringement of those patents, plus enhanced damages for willful infringement. The third case is scheduled for trial in December 2021, and VLSI seeks over $1.9 billion for alleged infringement of the ‘983, ‘025 and ‘485 patents, plus enhanced damages for willful infringement. In October and November 2019, and in February 2020, Intel filed IPR petitions on certain asserted claims across six of the patents-in-suit in WDTX. Between May and October 2020, the PTAB denied all of these requests and Intel requested a rehearing, as well as review from the POP as to all petitions. All requests for POP review were denied in October and December 2020, and all requests for rehearing were denied as to all petitions between December 2020 and February 2021. Intel filed notices of appeal regarding the discretionary denials for all petitions in February and March of 2021, and VLSI moved to dismiss those appeals in March 2021. The Court dismissed the appeals in May 2021, and Intel petitioned for hearing en banc in June 2021.
In May 2019, VLSI filed a case in Shenzhen Intermediate People’s Court against Intel, Intel (China) Co., Ltd., Intel Trading (Shanghai) Co., Ltd., and Intel Products (Chengdu) Co., Ltd. VLSI asserts Chinese Patent 201410094015.9 accusing certain Intel Core processors of infringement. VLSI requests an injunction as well as RMB 1 million in damages and RMB 300 thousand in expenses. Defendants filed an invalidation petition in October 2019 with the PRB, and a hearing date in September 2021 has been set before the PRB. In May 2020, defendants filed a motion to stay the trial court proceedings pending a determination on invalidity. The court held the first evidentiary hearing in November 2020 and the second in July 2021. The court also held trial proceedings in the hearing in July 2021 and concluded that further trial proceedings were needed but would be stayed pending the outcome of defendants’ invalidity challenge at the PRB.
In May 2019, VLSI filed a second case in Shanghai Intellectual Property Court against Intel (China) Co., Ltd., Intel Trading (Shanghai) Co., Ltd., and Intel Products (Chengdu) Co., Ltd. VLSI asserts Chinese Patent 201080024173.7. VLSI accuses certain Intel Core processors and seeks an injunction, as well as RMB 1 million in damages and RMB 300 thousand in expenses. Defendants filed with the PRB an invalidation petition in October 2019. A hearing date in September 2021 has been set before the PRB. In June 2020, defendants filed a motion to stay the trial court proceedings pending a determination on invalidity. The court held its first evidentiary hearing in September 2020. The court held a second evidentiary hearing in December 2020, and a trial the same month. At trial, VLSI dropped its monetary damages claim, but still requested expenses (RMB 300 thousand) and an injunction. The court held a second evidentiary hearing in December 2020. The court has not yet issued a decision following the trial. Rather, the court stayed the case in December 2020 pending a determination on invalidity by the PRB.
In November 2019, Intel, along with Apple Inc., filed a complaint against Fortress Investment Group LLC, Fortress Credit Co. LLC, Uniloc 2017 LLC, Uniloc USA, Inc., Uniloc Luxembourg S.A.R.L., VLSI, INVT SPE LLC, Inventergy Global, Inc., DSS Technology Management, Inc., IXI IP, LLC, and Seven Networks, LLC. Plaintiffs allege violations of Section 1 of the Sherman Act by certain defendants, Section 7 of the Clayton Act by certain defendants, and California Business and Professions Code section 17200 by all defendants based on defendants' unlawful aggregation of patents. In February 2020, defendants moved to dismiss plaintiffs' complaint. In July 2020, the court granted defendants’ motion to dismiss with leave to amend. The court dismissed antitrust claims related to two DSS patents with prejudice. The plaintiffs filed an amended complaint in August 2020, and defendants moved to dismiss in September 2020. The court heard defendants' motion to dismiss the amended complaint in December 2020 and dismissed plaintiffs’ amended complaint in January 2021, with leave to further amend. In December 2020, the court granted a joint motion by Apple and Seven Networks to dismiss with prejudice Apple’s claims against Seven Networks. Plaintiffs filed a second amended complaint in March 2021. Defendants moved to dismiss the Second Amended Complaint in May 2021. That motion will be heard in September 2021. Apple withdrew from the case and dismissed its claims in June 2021.
In June 2020, affiliates controlled by Fortress Investment Group, which also controls VLSI, acquired Finjan Holdings, Inc. Intel had signed a “Settlement, Release and Patent License Agreement” with Finjan in 2012, acquiring a license to the patents of Finjan and its affiliates, current or future, through a capture period of November 20, 2022. The agreement also contains covenants wherein Finjan agrees to cause its affiliates to comply with the agreement. As such, Intel maintains that it now has a license to the patents of VLSI, which has become a Finjan affiliate, and that Finjan must cause VLSI to dismiss its suits against Intel. In August 2020, Intel started dispute resolution proceedings under the agreement. As a part of this dispute resolution process, Intel and Finjan held a mediation in December 2020, but failed to resolve their differences. Intel filed suit to enforce its rights under the License Agreement with Finjan in January 2021 in Delaware Chancery Court. In March 2021, defendants filed motions to dismiss the Chancery Court proceedings. The court heard those motions in May 2021, but has not yet ruled on them. In September 2020, Intel filed motions to stay the Texas, Delaware, and Shanghai matters pending resolution of its dispute with Finjan. In November 2020, Intel filed a motion to stay the Shenzhen matter pending resolution of its dispute with Finjan. In November 2020, the Delaware court denied Intel’s motion to stay. The other stay motions remain pending. Finally, Intel filed a motion to amend its answer in the Texas matters to add a license defense in November 2020, and filed a motion to amend its answer in the Delaware matter to add a license defense in February 2021. The Texas court has not yet ruled on Intel’s motion to amend, but the Delaware court granted Intel’s motion in July 2021.
| | | | | | | | | | | |
| Financial Statements | Notes to Financial Statements | 21 |
After consideration of the verdicts in the WDTX cases and the additional pending lawsuits filed by VLSI, Intel accrued a charge of $2.2 billion in the first quarter of 2021. We dispute VLSI’s claims and intend to vigorously defend against them.
Litigation Related to 7nm Product Delay Announcement
Starting in July 2020, five securities class action lawsuits were filed in the U.S. District Court for the Northern District of California against Intel and certain current and former officers based on Intel’s July 2020 announcement of 7nm product delays. The plaintiffs, who purport to represent classes of acquirers of Intel stock between October 2019 and July 2020, generally allege that the defendants violated securities laws by making false or misleading statements about the timeline for 7nm products in light of subsequently announced delays. In October 2020, the court consolidated the lawsuits and appointed lead plaintiffs, and in January 2021 the lead plaintiffs filed a consolidated complaint. Defendants moved to dismiss the consolidated complaint in March 2021. We dispute the claims described above and intend to defend the lawsuits vigorously. Given the procedural posture and the nature of those cases, including that the pending proceedings are in the early stages, that alleged damages have not been specified, that uncertainty exists as to the likelihood of a class or classes being certified or the ultimate size of any class or classes if certified, and that there are significant factual and legal issues to be resolved, we are unable to make a reasonable estimate of the potential loss or range of losses, if any, that might arise from those matters.
| | | | | | | | | | | |
| Financial Statements | Notes to Financial Statements | 22 |
We use terms throughout our document that are specific to Intel or that are abbreviations that may not be commonly known or used. Below is a list of these terms used in our document.
| | | | | | | | |
| Term | | Definition |
| | |
| | |
| | |
| 2009 Debentures | | 3.25% junior subordinated convertible debentures due 2039 |
| | |
| | |
| | |
| | |
| | |
| | |
| 5G | | The fifth-generation mobile network, which is expected to bring dramatic improvements in network speeds and latency, and which we view as a transformative technology and opportunity for many industries |
| | |
| ADAS | | Advanced driver-assistance systems |
| Adjacent products | | All of our non-platform products for CCG, DCG, and IOTG, such as modem, Ethernet and silicon photonics, as well as Mobileye, NSG, and PSG products. Combined with our platform products, adjacent products form comprehensive platform solutions to meet customer needs |
| | |
| | |
| ASIC | | Application-specific integrated circuit |
| ASP | | Average selling price |
| | |
| AV | | Autonomous vehicle |
| | |
| | |
| CCG | | Client Computing Group operating segment |
| | |
| | |
| | |
| CODM | | Chief operating decision maker |
| | |
| COVID-19 | | The infectious disease caused by the most recently discovered coronavirus (aka SARS-CoV-2), which was declared a global pandemic by the World Health Organization |
| CPU | | Processor or central processing unit |
| | |
| | |
| | |
| DCG | | Data Center Group operating segment |
| EC | | European Commission |
| | |
| | |
| | |
| | |
| | |
| | |
| Form 10-K | | Annual Report on Form 10-K |
| Form 10-Q | | Quarterly Report on Form 10-Q |
| FPGA | | Field-programmable gate array |
| | |
| | |
| | |
| | |
| | |
| | |
| Internet of Things | | The Internet of Things market in which we sell our IOTG and Mobileye products |
| | |
| IOTG | | Internet of Things Group operating segment |
| | |
| IP | | Intellectual property |
| | |
| | |
| |
| | |
| | |
| | |
| | |
| | |
| | |
| | |
| | |
| MD&A | | Management's Discussion & Analysis |
| | |
| MG&A | | Marketing, general and administrative |
| | |
| | |
| NAND | | NAND flash memory |
| nm | | Nanometer |
| NSG | | Non-Volatile Memory Solutions Group operating segment |
| | |
| | |
| OEM | | Original equipment manufacturer |
| | |
| | |
| | |
| | |
| | |
| Platform products | | A microprocessor (CPU) and chipset, a stand-alone SoC, or a multichip package, based on Intel architecture. Platform products are primarily used in solutions sold through the CCG, DCG, and IOTG segments |
| | |
| | |
| | |
| PSG | | Programmable Solutions Group operating segment |
| | |
| | |
| R&D | | Research and development |
| | |
| | |
| | |
| RSU | | Restricted stock unit |
| | |
| | |
| | |
| | |
| SEC | | U.S. Securities and Exchange Commission |
| | |
| SoC | | A System-on-a-Chip, which integrates most of the components of a computer or other electronic system into a single silicon chip. We offer a range of SoC platform products in CCG, DCG, and IOTG. In our DCG business, we offer SoCs across many market segments for a variety of applications, including products targeted for 5G base stations and network infrastructure |
| | |
| | |
| SSD | | Solid-state drive |
| | |
| | |
| | |
| | |
| | |
| | |
| | |
| | |
| | |
| U.S. GAAP | | U.S. Generally Accepted Accounting Principles |
| VLSI | | VLSI Technology LLC |
| | |
| | |
| | |
| | |
| | |
| | | | | | | | | | | |
| Financial Statements | Notes to Financial Statements | 23 |
| | | | | |
| Management's Discussion and Analysis | |
| |
For additional key highlights of our results of operations, see "A Quarter in Review."
Client Computing Group
The PC is more essential than ever, enriching lives by helping people focus, create, and connect with friends, family, and coworkers around the world. Working with our partners across the industry, we intend to continue to advance PC experiences with innovations like our Intel® Evo™ platform which delivers exceptional mobile computing experiences for PC customers. As the largest business unit at Intel, CCG is investing more heavily in the PC, ramping its capabilities even more aggressively, and designing the PC experience even more deliberately, including delivering a predictable cadence of leadership products. As a result, we are able to fuel innovation across Intel, providing an important source of IP, scale, and cash flow.
| | | | | | | | | | | |
| CCG Revenue $B | | CCG Operating Income $B |
Revenue in Q2 2021 was up 6% compared to Q2 2020, and YTD 2021 revenue was up 7% compared to YTD 2020. Revenue increased due to continued strong demand in notebook and strength in desktop driven by consumer and commercial recovery from COVID-19 lows, with lower notebook and desktop ASPs due to strength in the consumer and education market segments. Adjacent revenue was down compared to Q2 2020 and compared to YTD 2020 due to the continued ramp down from the exit of our 5G smartphone modem and Home Gateway Platform businesses, partially offset by strength in our wireless business.
We expect strong demand for PCs will continue to be tempered by ongoing industry-wide component and substrate constraints.
| | | | | | | | | | | | | | | | | | | | | | | | | | | | | | | | |
| | Q2 2021 vs. Q2 2020 | | YTD 2021 vs. YTD 2020 |
| (In Millions) | | % | | $ Impact | | % | | $ Impact |
| | | | | | | | | | |
Desktop platform volume | | up | 15% | | $ | 391 | | | up | 5% | | $ | 337 | |
Desktop platform ASP | | down | (5)% | | (124) | | | down | (5)% | | (266) | |
Notebook platform volume | | up | 40% | | 2,303 | | | up | 47% | | 5,490 | |
Notebook platform ASP | | down | (17)% | | (1,404) | | | down | (20)% | | (3,489) | |
Adjacent products and other | | | | | (553) | | | | | | (629) | |
| | | | | | | | | | |
| Total change in revenue | | | | | $ | 613 | | | | | | $ | 1,443 | |
Operating income in Q2 2021 increased 32% from Q2 2020, with an operating margin of 37%. Operating income YTD 2021 increased 12%, with an operating margin of 38%.
| | | | | | | | |
| (In Millions) | | |
| $ | 3,760 | | | Q2 2021 CCG Operating Income |
| 540 | | | Lower platform unit cost due to cost improvements in 10nm |
| 530 | | | Lower period charges driven by absence of reserves taken on non-qualified platform products in Q2 2020, partially offset by sell-through of other reserves in 2020 |
| 185 | | | Higher gross margin from platform revenue |
| (210) | | | Higher operating expenses |
| (65) | | | Higher period charges primarily associated with the ramp down of 14nm |
| (55) | | | Lower adjacent product margin driven by exit of our 5G smartphone modem and Home Gateway Platform businesses |
| (7) | | | Other |
| $ | 2,842 | | | Q2 2020 CCG Operating Income |
| | |
| $ | 7,880 | | | YTD 2021 CCG Operating Income |
| 615 | | | Lower period charges driven by absence of reserves, including reserves taken on non-qualified platform products in 2020, partially offset by sell-through of other reserves in 2020 |
| 540 | | | Lower platform unit cost due to cost improvements in 10nm |
| 75 | | | Higher adjacent product margin |
| 70 | | | Higher gross margin from platform revenue |
| (320) | | | Higher operating expenses |
| (165) | | | Higher period charges primarily associated with the ramp down of 14nm |
| | |
| | |
| (2) | | | Other |
| $ | 7,067 | | | YTD 2020 CCG Operating Income |
Data Center Group
DCG develops workload-optimized platforms for compute, storage, and network functions. With unmatched scale, portfolio breadth, and ecosystem support, we are uniquely positioned to enable the world to unleash the potential of data, unlocking value for people, business, and society on a global scale. Market segments include cloud service providers, enterprise and government, and communications service providers. We serve the global appetite for cloud computing and enable transformation of the network and edge. In 2021, our DCG operating segment includes the results of our Intel Optane memory business.
| | | | | | | | | | | |
| DCG Revenue $B | | DCG Operating Income $B |
Revenue in Q2 2021 was down 9% on lower ASPs in a competitive environment, and on lower platform volume compared to a strong, COVID-driven Q2 2020. Revenue was also impacted by lower adjacent revenue, primarily due to accelerated 5G networking related purchases in Q2 2020, partially offset by growth in Optane and Ethernet in Q2 2021. Year over year, the cloud service providers market segment was down 20%, communications service providers was down 6%, and the enterprise and government market segment was up 6%.
Revenue YTD 2021 was down 15% compared to YTD 2020 on lower ASPs in a competitive environment, and on lower platform volume compared to a strong, COVID-driven YTD 2020.
| | | | | | | | | | | | | | | | | | | | | | | | | | | | | | | | |
| | Q2 2021 vs. Q2 2020 | | YTD 2021 vs. YTD 2020 |
| (In Millions) | | % | | $ Impact | | % | | $ Impact |
| | | | | | | | | | |
| Platform volume | | down | (1)% | | $ | (72) | | | down | (7)% | | $ | (893) | |
| Platform ASP | | down | (7)% | | (406) | | | down | (10)% | | (1,201) | |
| Adjacent products | | down | (20)% | | (184) | | | up | —% | | 3 | |
| | | | | | | | | | |
| Total change in revenue | | | | | $ | (662) | | | | | | $ | (2,091) | |
| | | | | | | | | | |
| | | | | | | | | | |
| | | | | | | | | | |
| | | | | | | | | | |
| | | | | | | | | | |
| | |
Operating income in Q2 2021 decreased 37% from Q2 2020, with an operating margin of 30%. Operating income YTD 2021 decreased 51%, with an operating margin of 27%.
| | | | | | | | |
(In Millions) | | |
| $ | 1,941 | | | Q2 2021 DCG Operating Income |
| (465) | | | Lower gross margin from platform revenue |
| (375) | | | Higher operating expenses |
| (165) | | | Higher platform unit cost primarily from increased mix of 10nm products |
| (115) | | | Higher period charges primarily associated with the ramp up of 7nm |
| (75) | | | Higher period charges primarily associated with the ramp down of 14nm |
| 40 | | | Higher adjacent gross margin |
| | |
| | |
| (3) | | | Other |
| $ | 3,099 | | | Q2 2020 DCG Operating Income |
| | |
| $ | 3,214 | | | YTD 2021 DCG Operating Income |
| (1,975) | | | Lower gross margin from platform revenue |
| (615) | | | Higher operating expenses |
| (360) | | | Higher platform unit cost primarily from increased mix of 10nm products |
| (240) | | | Higher period charges primarily associated with ramp up of 7nm |
| (180) | | | Higher period charges primarily associated with the ramp down of 14nm |
| | |
| | |
| | |
| (7) | | | Other |
| $ | 6,591 | | | YTD 2020 DCG Operating Income |
Internet of Things
More industries are harnessing the power of data to create business value, innovate, and grow. This requires that intelligence move closer to the edge, allowing data to be acted on where it is created. Working with our partners, we are using our architecture, accelerators, and software to develop and scale a growing Internet of Things portfolio and ecosystem. Our Internet of Things portfolio is comprised of our IOTG and Mobileye businesses.
IOTG develops high-performance compute platforms that solve for technology and business use cases that can scale across vertical industries and embedded markets. Our customers include retailers, manufacturers, health and life sciences, governments, and education providers. We reduce complexity in the ecosystem with a common architecture and software to help enable our customers to create and process data at the edge to analyze it faster and to act on it sooner.
Mobileye is the global leader in driving assistance and self-driving solutions. Our product portfolio employs a broad set of technologies, covering computer vision and machine learning-based sensing, data analysis, localization, mapping, and driving policy technology for ADAS and AVs. Mobileye's ADAS products form the building blocks for higher levels of autonomy. Our customers and strategic partners include major global OEMs, Tier 1 automotive system integrators, fleet managers, and transportation operators.
| | | | | | | | | | | |
| Internet of Things Revenue $B | | Internet of Things Operating Income $B |
| | | | | | | | | | | | | | | | | | | | | | | |
| ■ IOTG | ■ Mobileye | | | ■ IOTG | ■ Mobileye | |
| | |
Revenue and Operating Income Summary |
IOTG revenue was $984 million, up $314 million, driven by higher demand for IOTG platform products amid recovery from the economic impacts of COVID-19. Operating income was $287 million, up $217 million year over year.
Mobileye revenue was $327 million, up $181 million driven by improvement in global vehicle production year over year. Operating income was $109 million, up $113 million year over year.
IOTG revenue was $1.9 billion, up $345 million, driven by higher demand for IOTG platform products amid recovery from the economic impacts of COVID-19, partially offset by lower ASPs. Operating income was $499 million, up $186 million.
Mobileye revenue was $704 million, up $304 million, driven by improvement in global vehicle production compared to the same period in 2020. Operating income was $256 million, up $172 million.
Non-Volatile Memory Solutions Group
On October 19, 2020, we signed an agreement with SK hynix Inc. (SK hynix) to divest our NAND memory business. The transaction will occur over two closings as described in detail in "Note 8: Acquisitions and Divestitures" in Notes to Consolidated Condensed Financial Statements.
Our NAND business continues to develop storage solutions using our innovative Intel® 3D NAND Technology. Our data center products are optimized to deliver world-class performance and drive lower total cost of ownership, and our client SSDs provide a fast and productive computing environment for a variety of segments. Our Intel Optane memory business is expressly excluded from the sale to SK hynix, and beginning in 2021, the results of our Intel Optane memory business are included in our DCG operating segment, and our NSG operating segment is composed entirely of our NAND memory business.
| | | | | | | | | | | |
| NSG Revenue $B | | NSG Operating Income $B |
| | |
Revenue and Operating Income Summary |
Revenue was $1.1 billion, down $561 million from Q2 2020, driven by $323 million lower ASPs due to market softness and pricing pressure, $123 million lower volume primarily due to raw material constraints, and due to the transfer of the Intel Optane memory business to DCG ($116 million in Q2 2020). Operating income was $402 million, up $80 million from Q2 2020 due to $401 million improvements in unit cost, primarily driven by the absence of depreciation expense from NAND property, plant and equipment that is held for sale, partially offset by $437 million lower revenue on ASP decline. Operating income also benefited from the transfer of the Intel Optane memory business from Q2 2021 NSG results (a loss of $101 million in Q2 2020).
Revenue was $2.2 billion, down $792 million, driven by $657 million lower ASPs due to market softness and pricing pressure, and due to the transfer of the Intel Optane memory business to DCG ($212 million YTD 2020), partially offset by $77 million higher volume on strong demand. Operating income was $573 million, up $317 million from YTD 2020, due to $687 million improvements in unit cost, primarily driven by the absence of depreciation expense from NAND property, plant and equipment that is held for sale, and $286 million of lower period charges, partially offset by $748 million lower revenue on ASP decline. Operating income also benefited from the transfer of the Intel Optane memory business from YTD 2021 NSG results (a loss of $357 million YTD 2020).
Programmable Solutions Group
PSG offers programmable semiconductors, primarily FPGAs, structured ASICs, and related products, for a broad range of applications across our embedded, communications, and cloud and enterprise market segments. Our product portfolio delivers FPGA acceleration in tandem with Intel microprocessors, which enables us to combine the benefits of our broad portfolio of technologies to allow more flexibility for systems to operate with increased efficiency and higher performance.
| | | | | | | | | | | |
| PSG Revenue $B | | PSG Operating Income $B |
| | |
Revenue and Operating Income Summary |
Revenue was $486 million, down $15 million due to customer inventory digestion, and PSG was also impacted by supply constraints. Operating income was $82 million, up $2 million.
Revenue was $972 million, down $48 million due to customer inventory digestion, and PSG was also impacted by supply constraints. Operating income was $170 million, down $7 million.
| | | | | |
| Consolidated Results of Operations | |
| |
| | | | | | | | | | | | | | | | | | | | | | | | | | | | | | | | | | | | | | | | | | | | | | | | | | |
| | Three Months Ended | | Six Months Ended |
| | Q2 2021 | | Q2 2020 | | YTD 2021 | | YTD 2020 |
| (In Millions, Except Per Share Amounts) | | Amount | | % of Net
Revenue | | Amount | | % of Net
Revenue | | Amount | | % of Net
Revenue | | Amount | | % of Net
Revenue |
| Net revenue | | $ | 19,631 | | | 100.0 | % | | $ | 19,728 | | | 100.0 | % | | $ | 39,304 | | | 100.0 | % | | $ | 39,556 | | | 100.0 | % |
| Cost of sales | | 8,425 | | | 42.9 | % | | 9,221 | | | 46.7 | % | | 17,244 | | | 43.9 | % | | 17,033 | | | 43.1 | % |
| Gross margin | | 11,206 | | | 57.1 | % | | 10,507 | | | 53.3 | % | | 22,060 | | | 56.1 | % | | 22,523 | | | 56.9 | % |
| Research and development | | 3,715 | | | 18.9 | % | | 3,354 | | | 17.0 | % | | 7,338 | | | 18.7 | % | | 6,629 | | | 16.8 | % |
| Marketing, general and administrative | | 1,599 | | | 8.1 | % | | 1,447 | | | 7.3 | % | | 2,927 | | | 7.4 | % | | 2,988 | | | 7.6 | % |
| Restructuring and other charges | | 346 | | | 1.8 | % | | 9 | | | — | % | | 2,555 | | | 6.5 | % | | 171 | | | 0.4 | % |
| Operating income | | 5,546 | | | 28.3 | % | | 5,697 | | | 28.9 | % | | 9,240 | | | 23.5 | % | | 12,735 | | | 32.2 | % |
| Gains (losses) on equity investments, net | | 295 | | | 1.5 | % | | 267 | | | 1.4 | % | | 663 | | | 1.7 | % | | 156 | | | 0.4 | % |
| Interest and other, net | | (96) | | | (0.5) | % | | (29) | | | (0.1) | % | | (252) | | | (0.6) | % | | (342) | | | (0.9) | % |
| Income before taxes | | 5,745 | | | 29.3 | % | | 5,935 | | | 30.1 | % | | 9,651 | | | 24.6 | % | | 12,549 | | | 31.7 | % |
| Provision for taxes | | 684 | | | 3.5 | % | | 830 | | | 4.2 | % | | 1,229 | | | 3.1 | % | | 1,783 | | | 4.5 | % |
| Net income | | $ | 5,061 | | | 25.8 | % | | $ | 5,105 | | | 25.9 | % | | $ | 8,422 | | | 21.4 | % | | $ | 10,766 | | | 27.2 | % |
| | | | | | | | | | | | | | | | |
| Earnings per share—diluted | | $ | 1.24 | | | | | $ | 1.19 | | | | | $ | 2.06 | | | | | $ | 2.50 | | | |
Revenue
Q2 2021 vs. Q2 2020
Our Q2 2021 revenue was $19.6 billion, down $97 million from Q2 2020. DCG revenue declined 9% on lower ASPs in a competitive environment, and on lower platform volume compared to a strong, COVID-driven Q2 2020. DCG revenue was also impacted by lower adjacent revenue, primarily due to accelerated 5G networking related purchases in Q2 2020. NSG was down 34% due to lower ASPs and lower volume. CCG was up 6% year over year due to continued strength in notebook demand and recovery in desktop demand, with lower notebook and desktop ASPs due to strength in the consumer and education market segments. IOTG and Mobileye were both up on higher demand amid recovery from the economic impacts of COVID-19.
YTD 2021 vs. YTD 2020
Our YTD 2021 revenue was $39.3 billion, down $252 million or 1% from YTD 2020. DCG declined 15% on lower ASPs in a competitive environment, and on lower platform volume compared to a strong, COVID-driven YTD 2020. NSG was down 26% due to lower ASPs, partially offset by strong demand. CCG was up 7% due to continued strength in notebook demand and recovery in desktop demand, with lower notebook and desktop ASPs due to strength in the consumer and education market segments. Our "all other" revenue increased primarily due to $584 million from a prepaid supply agreement settled in Q1 2021. IOTG and Mobileye were both up 22% and 76%, respectively, on higher demand amid recovery from the economic impacts of COVID-19.
Gross Margin
We derived a substantial majority of our overall gross margin from the sale of platform products in the CCG and DCG operating segments. Our overall gross margin dollars in Q2 2021 increased by $699 million, or 7% compared to Q2 2020.
(Percentages in chart indicate gross margin as a percentage of total revenue)
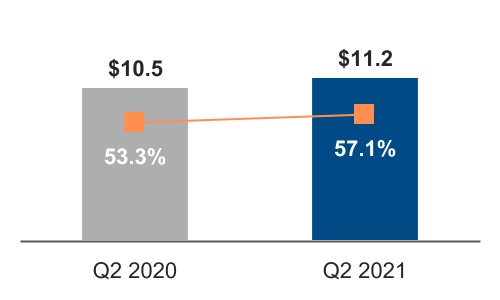
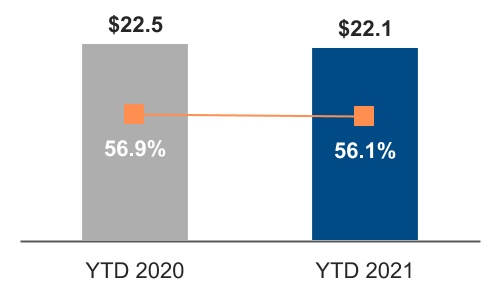
| | | | | | | | |
| (In Millions) | | |
| $ | 11,206 | | | Q2 2021 Gross Margin |
| 590 | | | Lower period charges driven by absence of reserves taken on non-qualified platform products in Q2 2020, partially offset by sell-through of other reserves |
| 380 | | | Lower platform unit cost due to cost improvements in 10nm |
| 180 | | | Higher gross margin from adjacent businesses primarily due to increased volume amidst improvement in global vehicle production |
| (145) | | | Higher period charges primarily associated with the ramp up of 7nm |
| (140) | | | Higher period charges associated with the ramp down of 14nm |
| (95) | | | Lower gross margin from platform revenue |
| | |
| | |
| | |
| | |
| | |
| (71) | | | Other |
| $ | 10,507 | | | Q2 2020 Gross Margin |
| | |
| $ | 22,060 | | | YTD 2021 Gross Margin |
| (1,720) | | | Lower gross margin from platform revenue |
| (350) | | | Higher period charges associated with the ramp down of 14nm |
| (260) | | | Higher period charges primarily associated with the ramp up of 7nm |
| 675 | | | Lower period charges driven by absence of reserves taken on non-qualified platform products in Q2 2020, partially offset by sell-through of other reserves |
| 585 | | | Prepaid supply agreement settled and recognized to revenue in Q1 2021 |
| 530 | | | Higher gross margin from adjacent businesses primarily due to higher margins on wireless and connectivity, improved NAND unit cost and increased volume amidst improvement in global vehicle production |
| 175 | | | Lower platform unit cost due to cost improvements in 10nm |
| | |
| (98) | | | Other |
| $ | 22,523 | | | YTD 2020 Gross Margin |
Operating Expenses
Total R&D and MG&A expenses for Q2 2021 were $5.3 billion, up 11% from Q2 2020, and $10.3 billion for YTD 2021, up 7% from YTD 2020. These expenses represent 27.1% of revenue for Q2 2021 and 24.3% of revenue for Q2 2020, and 26.1% of revenue for YTD 2021 and 24.3% of revenue for YTD 2020.
| | | | | | | | | | | |
| Research and Development $B | | Marketing, General, and Administrative $B |
| |
(Percentages indicate expenses as a percentage of total revenue)
Q2 2021 vs. Q2 2020
| | | | | |
| R&D increased by $361 million, or 10.8%, driven by the following: |
| |
| + | Investments in CCG, DCG, and Mobileye |
| + | Investments in our process technology |
| - | Incentive-based cash compensation |
| |
| |
YTD 2021 vs. YTD 2020
| | | | | | | |
| R&D spending increased by $709 million, or 10.7%, driven by the following: | | |
| | | |
| + | Investments in CCG, DCG, and Mobileye | | |
| + | Investments in our process technology | | |
| - | Incentive-based cash compensation | | |
| | | |
| | | |
| | |
Marketing, General, and Administrative |
Q2 2021 vs. Q2 2020
| | | | | |
| MG&A increased by $152 million, or 10.5%, driven by the following: |
| |
| + | Increase in corporate spending |
| - | Incentive-based cash compensation |
| |
| |
| |
YTD 2021 vs. YTD 2020
| | | | | | | |
| MG&A spending decreased by $61 million, or 2.0%, driven by the following: | | |
| | | |
| - | Corporate spending efficiencies | | |
| - | Incentive-based cash compensation | | |
| | | |
| | | |
| | | |
Gains (Losses) on Equity Investments and Interest and Other, Net
| | | | | | | | | | | | | | | | | | | | | | | | | | | | | | |
(In Millions) | | Q2 2021 | | Q2 2020 | | YTD 2021 | | YTD 2020 | | | | |
| Ongoing mark-to-market adjustments on marketable equity securities | | $ | 138 | | | $ | 165 | | | $ | (153) | | | $ | 62 | | | | | |
| Observable price adjustments on non-marketable equity securities | | 72 | | | 58 | | | 623 | | | 137 | | | | | |
| Impairment charges | | (35) | | | (51) | | | (73) | | | (193) | | | | | |
Sale of equity investments and other | | 120 | | | 95 | | | 266 | | | 150 | | | | | |
| Gains (losses) on equity investments, net | | $ | 295 | | | $ | 267 | | | $ | 663 | | | $ | 156 | | | | | |
| | | | | | | | | | | | |
Interest and other, net | | $ | (96) | | | $ | (29) | | | $ | (252) | | | $ | (342) | | | | | |
Gains (losses) on equity investments, net
Ongoing mark-to-market adjustments during the first six months of 2021 were primarily related to our interest in Montage Technology, Co. Ltd. During the first six months of 2020, ongoing mark-to-market adjustments were primarily driven by our interest in Cloudera Inc.
In the first quarter of 2021, we recognized $471 million in observable price adjustments in our investment in Beijing Unisoc Technology Ltd.
Interest and other, net
During the first six months of 2020, we paid $1.1 billion to fully satisfy conversion obligations for $372 million of our $2.0 billion 2009 Debentures and recognized a loss of $109 million in interest and other, net and $750 million as a reduction in stockholders' equity related to the conversion feature.
Restructuring and Other Charges
| | | | | | | | | | | | | | | | | | | | | | | | | | | |
| (In Millions) | | Q2 2021 | | Q2 2020 | | YTD 2021 | | YTD 2020 | |
| Employee severance and benefit arrangements | | $ | 15 | | | $ | 1 | | | $ | 22 | | | $ | 106 | | |
| | | | | | | | | |
| Litigation charges and other | | 49 | | | — | | | 2,251 | | | 57 | | |
| Asset impairment charges | | 282 | | | 8 | | | 282 | | | 8 | | |
| Total restructuring and other charges | | $ | 346 | | | $ | 9 | | | $ | 2,555 | | | $ | 171 | | |
Litigation charges and other includes a charge of $2.2 billion in the first three months of 2021 related to the VLSI litigation, and Asset impairment charges includes impairments related to the shutdown of two of our non-strategic businesses in Q2 2021. Refer to "Note 6: Restructuring and Other Charges" and "Note 13: Contingencies" within Notes to Consolidated Condensed Financial Statements for further information.
Provision for Taxes
| | | | | | | | | | | | | | | | | | | | | | | | | | |
(In Millions) | | Q2 2021 | | Q2 2020 | | YTD 2021 | | YTD 2020 |
Income before taxes | | $ | 5,745 | | | $ | 5,935 | | | $ | 9,651 | | | $ | 12,549 | |
Provision for taxes | | $ | 684 | | | $ | 830 | | | $ | 1,229 | | | $ | 1,783 | |
Effective tax rate | | 11.9 | % | | 14.0 | % | | 12.7 | % | | 14.2 | % |
For the first six months of 2021, the decrease in the effective tax rate was primarily due to a higher U.S. tax benefit derived from sales to non-U.S. customers and tax incentives realized in non-U.S. jurisdictions.
Liquidity and Capital Resources
We consider the following when assessing our liquidity and capital resources:
| | | | | | | | | | | | | | |
(In Millions) | | Jun 26, 2021 | | Dec 26, 2020 |
Cash and cash equivalents | | $ | 4,746 | | | $ | 5,865 | |
| Short-term investments | | 3,014 | | | 2,292 | |
| Trading assets | | 17,097 | | | 15,738 | |
| Other long-term investments | | 1,262 | | | 2,192 | |
| Loans receivable and other | | 374 | | | 947 | |
Total cash and investments1 | | $ | 26,493 | | | $ | 27,034 | |
| | | | |
| | | | |
| Total debt | | $ | 35,409 | | | $ | 36,401 | |
Cash generated by operations is our primary source of liquidity. When assessing our sources of liquidity, we include our total cash and investments1 as shown in the preceding table. We maintain a diverse investment portfolio that we continually analyze based on issuer, industry, and country. Substantially all of our investments in debt instruments and financing receivables are in investment-grade securities.
In the first quarter of 2021, we entered into a $5.0 billion variable-rate revolving credit facility which matures in March 2026. Other potential sources of liquidity include our commercial paper program and our automatic shelf registration statement on file with the SEC, pursuant to which we may offer an unspecified amount of debt, equity, and other securities. Under our commercial paper program, we have an ongoing authorization from our Board of Directors to borrow up to $10.0 billion. As of June 26, 2021, we had no outstanding commercial paper or borrowings on the revolving credit facility.
In the first quarter of 2021, we repurchased the remaining $2.4 billion in shares of our planned $20.0 billion share repurchases announced in October 2019.
We believe we have sufficient sources of funding to meet our business requirements in the next 12 months, including capital expenditures for worldwide manufacturing and assembly and test; working capital requirements; and acquisitions, strategic investments, and dividends.
| | | | | | | | | | | | | | | | | |
| Cash from Operations $B | | Capital Expenditures $B | | Cash to Stockholders $B |
| | | | | | | | | | | | | | |
| | Six Months Ended |
(In Millions) | | Jun 26, 2021 | | Jun 27, 2020 |
| Net cash provided by operating activities | | $ | 14,294 | | | $ | 17,315 | |
Net cash used for investing activities | | (9,451) | | | (14,346) | |
Net cash provided by (used for) financing activities | | (5,962) | | | 1,573 | |
| | | | |
| Net increase (decrease) in cash and cash equivalents | | $ | (1,119) | | | $ | 4,542 | |
Operating Activities
Cash provided by operating activities is net income adjusted for certain non-cash items and changes in assets and liabilities.
For the first six months of 2021 compared to the first six months of 2020, the decrease in cash provided by operations was primarily driven by lower net income, net of non-cash adjustments including the Corporate VLSI charge, a prepaid supply agreement payment in the first quarter of 2021, and income taxes.
1 See "Non-GAAP Financial Measures" within MD&A.
Investing Activities
Investing cash flows consist primarily of capital expenditures, investment purchases, sales, maturities, and disposals, and proceeds from divestitures and cash used for acquisitions.
Cash used for investing activities was lower in the first six months of 2021 compared to the first six months of 2020, primarily driven by an increase in sales and maturities for available-for-sale debt investments and trading assets, and a decrease in purchases of available-for-sale debt investments, partially offset by an increase in purchases of trading assets and increased capital expenditures.
Financing Activities
Financing cash flows consist primarily of repurchases of common stock, payment of dividends to stockholders, issuance and repayment of short-term and long-term debt, and proceeds from the sale of shares of common stock through employee equity incentive plans.
Cash was used for financing activities in the first six months of 2021 compared to cash provided by financing activities in the first six months of 2020 due to a decrease in cash provided by long-term debt issuances, partially offset by a decrease in repurchases of common stock and a decrease in repayment of debt and debt conversion.
Non-GAAP Financial Measures
In addition to disclosing financial results in accordance with U.S. GAAP, this document contains references to the non-GAAP financial measures below. We believe these non-GAAP financial measures provide investors with useful supplemental information about our operating performance, enable comparison of financial trends and results between periods where certain items may vary independent of business performance, and allow for greater transparency with respect to key metrics used by management in operating our business and measuring our performance. Certain of these non-GAAP financial measures are used in our performance-based RSUs and our annual cash bonus plan.
Our non-GAAP financial measures reflect adjustments based on one or more of the following items, as well as the related income tax effects where applicable. Income tax effects have been calculated using an appropriate tax rate for each adjustment. These non-GAAP financial measures should not be considered a substitute for, or superior to, financial measures calculated in accordance with U.S. GAAP, and the financial results calculated in accordance with U.S. GAAP and reconciliations from these results should be carefully evaluated.
| | | | | | | | |
| Non-GAAP adjustment or measure | Definition | Usefulness to management and investors |
| NAND memory business | Our NAND memory business is subject to a pending sale to SK hynix, as announced in October 2020. | We exclude the impact of our NAND memory business in certain non-GAAP measures because these adjustments reflect how management currently views the core operations of the company. While the sale of the NAND memory business is still pending and subject to closing conditions, management does not currently view the business as part of the company’s core operations or its long-term strategic direction. We believe these adjustments provide investors with a useful view, through the eyes of management, of the company’s core business model and how management currently evaluates core operational performance. We believe they also provide investors with an additional means to understand the potential impact of the divestiture over time. In making these adjustments, we have not made any changes to our methods for measuring and calculating revenue or other financial statement amounts. |
| Acquisition-related adjustments | Amortization of acquisition-related intangible assets consists of amortization of intangible assets such as developed technology, brands, and customer relationships acquired in connection with business combinations. Charges related to the amortization of these intangibles are recorded within both cost of sales and MG&A in our U.S. GAAP financial statements. Amortization charges are recorded over the estimated useful life of the related acquired intangible asset, and thus are generally recorded over multiple years. | We exclude amortization charges for our acquisition-related intangible assets for purposes of calculating certain non-GAAP measures because these charges are inconsistent in size and are significantly impacted by the timing and valuation of our acquisitions. These adjustments facilitate a useful evaluation of our current operating performance and comparison to our past operating performance and provide investors with additional means to evaluate cost and expense trends. |
| Restructuring and other charges | Restructuring charges are costs associated with a formal restructuring plan and are primarily related to employee severance and benefit arrangements. Other charges include goodwill and asset impairments, pension charges, and costs associated with restructuring activity. | We exclude restructuring and other charges, including any adjustments to charges recorded in prior periods, for purposes of calculating certain non-GAAP measures because these costs do not reflect our core operating performance. These adjustments facilitate a useful evaluation of our core operating performance and comparisons to past operating results and provide investors with additional means to evaluate expense trends. |
| | |
| Ongoing mark-to-market on marketable equity securities | After the initial mark-to-market adjustment is recorded upon a security becoming marketable, gains and losses are recognized from ongoing mark-to-market adjustments of our marketable equity securities. | We exclude these ongoing gains and losses for purposes of calculating certain non-GAAP measures because we do not believe this volatility correlates to our core operational performance. These adjustments facilitate a useful evaluation of our current operating performance and comparisons to past operating results. |
| Free cash flow | We reference a non-GAAP financial measure of free cash flow, which is used by management when assessing our sources of liquidity, capital resources, and quality of earnings. Free cash flow is operating cash flow adjusted to exclude additions to property, plant and equipment. | This non-GAAP financial measure is helpful in understanding our capital requirements and provides an additional means to evaluate the cash flow trends of our business. In calculating free cash flow, we do not subtract additions to held for sale NAND property, plant and equipment because the additions are not representative of our long-term capital requirements and we expect these assets to be sold. |
| Total cash and investments | Total cash and investments is used by management when assessing our sources of liquidity, which includes cash and cash equivalents, short-term investments, trading assets, other long-term investments, and loans receivable and other. | This non-GAAP measure is helpful in understanding our capital resources and liquidity position. |
Following are the reconciliations of our most comparable U.S. GAAP measures to our non-GAAP measures presented:
| | | | | | | | | | | | | | | | | | |
| | Three Months Ended | | |
(In Millions, Except Per Share Amounts) | | Jun 26, 2021 | | Jun 27, 2020 | | | | |
| | | | | | | | |
| | | | | | | | |
| | | | | | | | |
| | | | | | | | |
| | | | | | | | |
| | | | | | | | |
| | | | | | | | |
| Net revenue | | $ | 19,631 | | | $ | 19,728 | | | | | |
| NAND memory business | | (1,098) | | | (1,544) | | | | | |
| Non-GAAP net revenue | | $ | 18,533 | | | $ | 18,184 | | | | | |
| | | | | | | | |
| Operating income | | $ | 5,546 | | | $ | 5,697 | | | | | |
| Acquisition-related adjustments | | 366 | | | 352 | | | | | |
| | | | | | | | |
| | | | | | | | |
| | | | | | | | |
| | | | | | | | |
| Restructuring and other charges | | 346 | | | 9 | | | | | |
| NAND memory business | | (402) | | | (423) | | | | | |
| Non-GAAP operating income | | $ | 5,856 | | | $ | 5,635 | | | | | |
| | | | | | | | |
| Operating margin | | 28.3 | % | | 28.9 | % | | | | |
| Acquisition-related adjustments | | 1.9 | % | | 1.8 | % | | | | |
| | | | | | | | |
| | | | | | | | |
| | | | | | | | |
| | | | | | | | |
| Restructuring and other charges | | 1.8 | % | | — | % | | | | |
| NAND memory business | | (0.3) | % | | 0.4 | % | | | | |
Non-GAAP operating margin1 | | 31.6 | % | | 31.0 | % | | | | |
| | | | | | | | |
| | | | | | | | |
| | | | | | | | |
| | | | | | | | |
| | | | | | | | |
| | | | | | | | |
| | | | | | | | |
| | | | | | | | |
| | | | | | | | |
| | | | | | | | |
| | | | | | | | |
| | | | | | | | |
| | | | | | | | |
| | | | | | | | |
| Earnings per share—diluted | | $ | 1.24 | | | $ | 1.19 | | | | | |
| Acquisition-related adjustments | | 0.09 | | | 0.08 | | | | | |
| | | | | | | | |
| | | | | | | | |
| | | | | | | | |
| Restructuring and other charges | | 0.08 | | | — | | | | | |
| | | | | | | | |
| | | | | | | | |
| Ongoing mark-to-market on marketable equity securities | | (0.03) | | | (0.04) | | | | | |
| | | | | | | | |
| NAND memory business | | (0.09) | | | (0.10) | | | | | |
| Income tax effects | | (0.01) | | | 0.01 | | | | | |
| | | | | | | | |
| Non-GAAP earnings per share—diluted | | $ | 1.28 | | | $ | 1.14 | | | | | |
1 Our reconciliation of GAAP to non-GAAP operating margin percentage reflects the exclusion of our NAND memory business from net revenue.
| | | | | | | | | | | | | | |
| | Six Months Ended |
| (In Millions) | | Jun 26, 2021 | | Jun 27, 2020 |
| Net cash provided by operating activities | | $ | 14,294 | | | $ | 17,315 | |
| Additions to property, plant and equipment | | (7,574) | | | (6,676) | |
| Free cash flow | | $ | 6,720 | | | $ | 10,639 | |
| | | | |
| Net cash used for investing activities | | $ | (9,451) | | | $ | (14,346) | |
| Net cash provided by (used for) financing activities | | $ | (5,962) | | | $ | 1,573 | |
| | | | |
| | | | |
Quantitative and Qualitative Disclosures About Market Risk
We are affected by changes in currency exchange and interest rates, as well as equity and commodity prices. Our risk management programs are designed to reduce, but may not entirely eliminate, the impacts of these risks. For discussion about market risk and sensitivity analysis related to changes in currency exchange rates, interest rates, equity prices, and commodity prices refer to "Quantitative and Qualitative Disclosures About Market Risk" within MD&A in our 2020 Form 10-K.
Risk Factors
The risks described in "Risk Factors" within Other Key Information in our 2020 Form 10-K and our Form 10-Q for Q1 2021 could materially and adversely affect our business, financial condition, and results of operations, and the trading price of our common stock could decline. These risk factors do not identify all risks that we face—our operations could also be affected by factors that are not presently known to us or that we currently consider to be immaterial to our operations. Due to risks and uncertainties, known and unknown, our past financial results may not be a reliable indicator of future performance and historical trends should not be used to anticipate results or trends in future periods. Refer also to the other information set forth in this Form 10-Q, including in the Forward-Looking Statements, MD&A, and Consolidated Condensed Financial Statements and Supplemental Details sections.
Controls and Procedures
Inherent Limitations on Effectiveness of Controls
Our management, including the principal executive officer and principal financial officer, does not expect that our disclosure controls and procedures or our internal control over financial reporting will prevent or detect all errors and all fraud. A control system, no matter how well-designed and operated, can provide only reasonable, not absolute, assurance that the control system’s objectives will be met. The design of a control system must reflect the fact that there are resource constraints, and the benefits of controls must be considered relative to their costs. Further, because of the inherent limitations in all control systems, no evaluation of controls can provide absolute assurance that misstatements due to error or fraud will not occur or that all control issues and instances of fraud, if any, have been detected.
Evaluation of Disclosure Controls and Procedures
Based on management’s evaluation (with the participation of our principal executive officer and principal financial officer), as of the end of the period covered by this report, our principal executive officer and principal financial officer have concluded that our disclosure controls and procedures (as defined in Rules 13a-15(e) and 15d-15(e) under the Securities Exchange Act of 1934, as amended (the Exchange Act)), are effective to provide reasonable assurance that information required to be disclosed by us in reports that we file or submit under the Exchange Act is recorded, processed, summarized, and reported within the time periods specified in SEC rules and forms, and is accumulated and communicated to management, including our principal executive officer and principal financial officer, as appropriate, to allow timely decisions regarding required disclosure.
Changes in Internal Control Over Financial Reporting
There were no changes to our internal control over financial reporting (as defined in Rules 13a-15(f) and 15d-15(f) under the Exchange Act) that occurred during the quarter ended June 26, 2021 that have materially affected, or are reasonably likely to materially affect, our internal control over financial reporting.
Issuer Purchases of Equity Securities
We have an ongoing authorization, originally approved by our Board of Directors in 2005 and subsequently amended, to repurchase shares of our common stock in open market or negotiated transactions. No shares were repurchased during the quarter ending June 26, 2021. As of June 26, 2021, we were authorized to repurchase up to $110.0 billion, of which $7.2 billion remained available.
We issue RSUs as part of our equity incentive plans. In our Consolidated Condensed Financial Statements, we treat shares of common stock withheld for tax purposes on behalf of our employees in connection with the vesting of RSUs as common stock repurchases because they reduce the number of shares that would have been issued upon vesting. These withheld shares of common stock are not considered common stock repurchases under our authorized common stock repurchase program.
Disclosure Pursuant to Section 13(r) of the Securities Exchange Act of 1934
Section 13(r) of the Exchange Act requires an issuer to disclose certain information in its periodic reports if it or any of its affiliates knowingly engaged in certain activities, transactions or dealings with individuals or entities subject to specific U.S. economic sanctions during the reporting period, even when the activities, transactions, or dealings are conducted in compliance with applicable law. On March 2, 2021, the U.S. Secretary of State designated the Federal Security Service of the Russian Federation (FSB) as a party subject to one such sanction. From time to time, our local subsidiary is required to engage with the FSB as a licensing authority and file documents in order to conduct business within the Russian Federation. All such dealings are explicitly authorized by General License 1B issued by the U.S. Department of the Treasury’s Office of Foreign Assets Control, and there are no gross revenues or net profits directly associated with any such dealings by us with the FSB. We plan to continue these activities as required to conduct business in the Russian Federation to the extent permitted by applicable law.
Exhibits
| | | | | | | | | | | | | | | | | | | | | | | | | | | | | | | | | | | | | | |
| | | | | Incorporated by Reference | | |
Exhibit
Number | | Exhibit Description | | Form | | File Number | | Exhibit | | Filing
Date | | Filed or
Furnished
Herewith |
| 3.1 | | | | 8-K | | 000-06217 | | 3.1 | | 5/22/2006 | | |
| 3.2 | | | | 8-K | | 000-06217 | | 3.2 | | 3/16/2021 | | |
10.1† | | | | | | | | | | | | X |
| 31.1 | | | | | | | | | | | | X |
| 31.2 | | | | | | | | | | | | X |
| | | | | | | | | | | | |
| 32.1 | | | | | | | | | | | | X |
| 101.INS | | XBRL Instance Document - the instance document does not appear in the Interactive Data File because its XBRL tags are embedded within the Inline XBRL document | | | | | | | | | | X |
| 101.SCH | | XBRL Taxonomy Extension Schema Document | | | | | | | | | | X |
| 101.CAL | | XBRL Taxonomy Extension Calculation Linkbase Document | | | | | | | | | | X |
| 101.DEF | | XBRL Taxonomy Extension Definition Linkbase Document | | | | | | | | | | X |
| 101.LAB | | XBRL Taxonomy Extension Label Linkbase Document | | | | | | | | | | X |
| 101.PRE | | XBRL Taxonomy Extension Presentation Linkbase Document | | | | | | | | | | X |
| 104 | | Cover Page Interactive Data File - formatted in Inline XBRL and included as Exhibit 101 | | | | | | | | | | X |
† Management contracts or compensation plans or arrangements in which directors or executive officers are eligible to participate.
Form 10-Q Cross-Reference Index
| | | | | | | | |
| Item Number | Item | |
| Part I - Financial Information | |
| Item 1. | Financial Statements | |
| Item 2. | Management's Discussion and Analysis of Financial Condition and Results of Operations: | |
| Results of operations | |
| Liquidity and capital resources | |
| | |
| Off-balance sheet arrangements | (a) |
| Contractual obligations | (b) |
| Item 3. | Quantitative and Qualitative Disclosures About Market Risk | |
| Item 4. | Controls and Procedures | |
| | |
| Part II - Other Information | |
| Item 1. | Legal Proceedings | |
| Item 1A. | Risk Factors | |
| Item 2. | Unregistered Sales of Equity Securities and Use of Proceeds | |
| Item 3. | Defaults Upon Senior Securities | Not applicable |
| Item 4. | Mine Safety Disclosures | Not applicable |
| Item 5. | Other Information | |
| Disclosure Pursuant to Section 13(r) of the Securities Exchange Act of 1934 | |
| Item 6. | Exhibits | |
| | |
| Signatures | | |
(a) As of June 26, 2021, we did not have any significant off-balance sheet arrangements, as previously defined in Item 303(a)(4)(ii) of SEC Regulation S-K.
(b) There were no material changes to our significant contractual obligations from those disclosed in our 2020 Form 10-K.
Signatures
Pursuant to the requirements of the Securities Exchange Act of 1934, the registrant has duly caused this report to be signed on its behalf by the undersigned thereunto duly authorized.
| | | | | | | | | | | | | | | | | |
| | | INTEL CORPORATION
(Registrant) |
| | | | | |
| Date: | July 22, 2021 | | By: | | /s/ GEORGE S. DAVIS |
| | | | | George S. Davis |
| | | | | Executive Vice President, Chief Financial Officer and Principal Financial Officer |
| | | | | |
| Date: | July 22, 2021 | | By: | | /s/ KEVIN T. MCBRIDE |
| | | | | Kevin T. McBride |
| | | | | Vice President of Finance, Corporate Controller and Principal Accounting Officer |