April 2, 20220000050863December 312022Q1FALSE87,09685,2944,0894,0704,0894,0700.370.700.370.705.000000508632021-12-262022-04-0200000508632022-04-02xbrli:sharesiso4217:USD00000508632020-12-272021-03-270000050863us-gaap:RetainedEarningsMember2021-12-262022-04-02iso4217:USDxbrli:shares00000508632021-12-2500000508632020-12-2600000508632021-03-270000050863us-gaap:CommonStockIncludingAdditionalPaidInCapitalMember2021-12-250000050863us-gaap:AccumulatedOtherComprehensiveIncomeMember2021-12-250000050863us-gaap:RetainedEarningsMember2021-12-250000050863us-gaap:AccumulatedOtherComprehensiveIncomeMember2021-12-262022-04-020000050863us-gaap:CommonStockIncludingAdditionalPaidInCapitalMember2021-12-262022-04-020000050863us-gaap:CommonStockIncludingAdditionalPaidInCapitalMember2022-04-020000050863us-gaap:AccumulatedOtherComprehensiveIncomeMember2022-04-020000050863us-gaap:RetainedEarningsMember2022-04-020000050863us-gaap:CommonStockIncludingAdditionalPaidInCapitalMember2020-12-260000050863us-gaap:AccumulatedOtherComprehensiveIncomeMember2020-12-260000050863us-gaap:RetainedEarningsMember2020-12-260000050863us-gaap:RetainedEarningsMember2020-12-272021-03-270000050863us-gaap:AccumulatedOtherComprehensiveIncomeMember2020-12-272021-03-270000050863us-gaap:CommonStockIncludingAdditionalPaidInCapitalMember2020-12-272021-03-270000050863us-gaap:CommonStockIncludingAdditionalPaidInCapitalMember2021-03-270000050863us-gaap:AccumulatedOtherComprehensiveIncomeMember2021-03-270000050863us-gaap:RetainedEarningsMember2021-03-270000050863intc:ClientComputingGroupMemberus-gaap:OperatingSegmentsMemberintc:DesktopMember2021-12-262022-04-020000050863intc:ClientComputingGroupMemberus-gaap:OperatingSegmentsMemberintc:DesktopMember2020-12-272021-03-270000050863intc:ClientComputingGroupMemberus-gaap:OperatingSegmentsMemberintc:NotebookMember2021-12-262022-04-020000050863intc:ClientComputingGroupMemberus-gaap:OperatingSegmentsMemberintc:NotebookMember2020-12-272021-03-270000050863intc:ClientComputingGroupMemberintc:OtherProductOrServiceMemberus-gaap:OperatingSegmentsMember2021-12-262022-04-020000050863intc:ClientComputingGroupMemberintc:OtherProductOrServiceMemberus-gaap:OperatingSegmentsMember2020-12-272021-03-270000050863intc:ClientComputingGroupMemberus-gaap:OperatingSegmentsMember2021-12-262022-04-020000050863intc:ClientComputingGroupMemberus-gaap:OperatingSegmentsMember2020-12-272021-03-270000050863us-gaap:OperatingSegmentsMemberintc:DatacenterAndAIMember2021-12-262022-04-020000050863us-gaap:OperatingSegmentsMemberintc:DatacenterAndAIMember2020-12-272021-03-270000050863us-gaap:OperatingSegmentsMemberintc:NetworkAndEdgeMember2021-12-262022-04-020000050863us-gaap:OperatingSegmentsMemberintc:NetworkAndEdgeMember2020-12-272021-03-270000050863intc:AcceleratedComputingSystemsAndGraphicsMemberus-gaap:OperatingSegmentsMember2021-12-262022-04-020000050863intc:AcceleratedComputingSystemsAndGraphicsMemberus-gaap:OperatingSegmentsMember2020-12-272021-03-270000050863intc:MobileyeMemberus-gaap:OperatingSegmentsMember2021-12-262022-04-020000050863intc:MobileyeMemberus-gaap:OperatingSegmentsMember2020-12-272021-03-270000050863us-gaap:OperatingSegmentsMemberintc:IntelFoundryServicesMember2021-12-262022-04-020000050863us-gaap:OperatingSegmentsMemberintc:IntelFoundryServicesMember2020-12-272021-03-270000050863us-gaap:OperatingSegmentsMemberus-gaap:AllOtherSegmentsMember2021-12-262022-04-020000050863us-gaap:OperatingSegmentsMemberus-gaap:AllOtherSegmentsMember2020-12-272021-03-270000050863us-gaap:OperatingSegmentsMember2021-12-262022-04-020000050863us-gaap:OperatingSegmentsMember2020-12-272021-03-270000050863intc:ClientComputingGroupMember2021-12-262022-04-020000050863intc:ClientComputingGroupMember2020-12-272021-03-270000050863intc:DatacenterAndAIMember2021-12-262022-04-020000050863intc:DatacenterAndAIMember2020-12-272021-03-270000050863intc:NetworkAndEdgeMember2021-12-262022-04-020000050863intc:NetworkAndEdgeMember2020-12-272021-03-270000050863intc:AcceleratedComputingSystemsAndGraphicsMember2021-12-262022-04-020000050863intc:AcceleratedComputingSystemsAndGraphicsMember2020-12-272021-03-270000050863intc:MobileyeMember2021-12-262022-04-020000050863intc:MobileyeMember2020-12-272021-03-270000050863intc:IntelFoundryServicesMember2021-12-262022-04-020000050863intc:IntelFoundryServicesMember2020-12-272021-03-270000050863us-gaap:AllOtherSegmentsMember2021-12-262022-04-020000050863us-gaap:AllOtherSegmentsMember2020-12-272021-03-270000050863us-gaap:IntersegmentEliminationMember2021-12-262022-04-020000050863us-gaap:IntersegmentEliminationMember2020-12-272021-03-270000050863intc:NANDMemoryBusinessMember2021-12-262022-04-020000050863intc:EcFineMember2021-12-262022-04-020000050863us-gaap:AvailableforsaleSecuritiesMember2022-04-020000050863us-gaap:AvailableforsaleSecuritiesMember2021-12-250000050863us-gaap:AvailableforsaleSecuritiesMember2021-12-262022-04-020000050863us-gaap:AvailableforsaleSecuritiesMember2020-12-272021-03-270000050863intc:McAfeeMember2021-12-25xbrli:pure0000050863intc:McAfeeMember2021-12-262022-04-020000050863intc:BejingUnisocTechnologyLtdMember2020-12-272021-03-270000050863intc:BejingUnisocTechnologyLtdMember2022-04-020000050863intc:BejingUnisocTechnologyLtdMember2021-12-250000050863intc:TowerSemiconductorLtdMembersrt:ScenarioForecastMember2021-12-262022-12-310000050863intc:NANDMemoryBusinessMember2020-10-192020-10-190000050863intc:NANDMemoryBusinessMember2021-12-292021-12-290000050863intc:NANDMemoryBusinessMembersrt:ScenarioForecastMember2025-03-012025-03-310000050863intc:NANDMemoryBusinessMember2022-04-0200000508632021-12-290000050863intc:NANDMemoryBusinessMember2020-10-310000050863intc:NANDMemoryBusinessDivestitureMember2022-04-020000050863intc:NANDMemoryBusinessDivestitureMembersrt:ScenarioForecastMembersrt:AffiliatedEntityMember2021-12-262022-12-310000050863intc:VariableRateRevolvingCreditFacilityMemberus-gaap:RevolvingCreditFacilityMember2022-04-020000050863us-gaap:CommercialPaperMember2022-04-020000050863us-gaap:FairValueMeasurementsRecurringMemberus-gaap:CashEquivalentsMemberus-gaap:CorporateDebtSecuritiesMemberus-gaap:FairValueInputsLevel1Member2022-04-020000050863us-gaap:FairValueMeasurementsRecurringMemberus-gaap:CashEquivalentsMemberus-gaap:CorporateDebtSecuritiesMemberus-gaap:FairValueInputsLevel2Member2022-04-020000050863us-gaap:FairValueMeasurementsRecurringMemberus-gaap:CashEquivalentsMemberus-gaap:FairValueInputsLevel3Memberus-gaap:CorporateDebtSecuritiesMember2022-04-020000050863us-gaap:FairValueMeasurementsRecurringMemberus-gaap:CashEquivalentsMemberus-gaap:CorporateDebtSecuritiesMember2022-04-020000050863us-gaap:FairValueMeasurementsRecurringMemberus-gaap:CashEquivalentsMemberus-gaap:CorporateDebtSecuritiesMemberus-gaap:FairValueInputsLevel1Member2021-12-250000050863us-gaap:FairValueMeasurementsRecurringMemberus-gaap:CashEquivalentsMemberus-gaap:CorporateDebtSecuritiesMemberus-gaap:FairValueInputsLevel2Member2021-12-250000050863us-gaap:FairValueMeasurementsRecurringMemberus-gaap:CashEquivalentsMemberus-gaap:FairValueInputsLevel3Memberus-gaap:CorporateDebtSecuritiesMember2021-12-250000050863us-gaap:FairValueMeasurementsRecurringMemberus-gaap:CashEquivalentsMemberus-gaap:CorporateDebtSecuritiesMember2021-12-250000050863us-gaap:FairValueMeasurementsRecurringMemberus-gaap:FixedIncomeSecuritiesMemberus-gaap:CashEquivalentsMemberus-gaap:FairValueInputsLevel1Member2022-04-020000050863us-gaap:FairValueMeasurementsRecurringMemberus-gaap:FixedIncomeSecuritiesMemberus-gaap:CashEquivalentsMemberus-gaap:FairValueInputsLevel2Member2022-04-020000050863us-gaap:FairValueMeasurementsRecurringMemberus-gaap:FixedIncomeSecuritiesMemberus-gaap:CashEquivalentsMemberus-gaap:FairValueInputsLevel3Member2022-04-020000050863us-gaap:FairValueMeasurementsRecurringMemberus-gaap:FixedIncomeSecuritiesMemberus-gaap:CashEquivalentsMember2022-04-020000050863us-gaap:FairValueMeasurementsRecurringMemberus-gaap:FixedIncomeSecuritiesMemberus-gaap:CashEquivalentsMemberus-gaap:FairValueInputsLevel1Member2021-12-250000050863us-gaap:FairValueMeasurementsRecurringMemberus-gaap:FixedIncomeSecuritiesMemberus-gaap:CashEquivalentsMemberus-gaap:FairValueInputsLevel2Member2021-12-250000050863us-gaap:FairValueMeasurementsRecurringMemberus-gaap:FixedIncomeSecuritiesMemberus-gaap:CashEquivalentsMemberus-gaap:FairValueInputsLevel3Member2021-12-250000050863us-gaap:FairValueMeasurementsRecurringMemberus-gaap:FixedIncomeSecuritiesMemberus-gaap:CashEquivalentsMember2021-12-250000050863us-gaap:FairValueMeasurementsRecurringMemberus-gaap:CashEquivalentsMemberus-gaap:FairValueInputsLevel1Memberintc:GovernmentDebtSecuritiesMember2022-04-020000050863us-gaap:FairValueMeasurementsRecurringMemberus-gaap:CashEquivalentsMemberus-gaap:FairValueInputsLevel2Memberintc:GovernmentDebtSecuritiesMember2022-04-020000050863us-gaap:FairValueMeasurementsRecurringMemberus-gaap:CashEquivalentsMemberus-gaap:FairValueInputsLevel3Memberintc:GovernmentDebtSecuritiesMember2022-04-020000050863us-gaap:FairValueMeasurementsRecurringMemberus-gaap:CashEquivalentsMemberintc:GovernmentDebtSecuritiesMember2022-04-020000050863us-gaap:FairValueMeasurementsRecurringMemberus-gaap:CashEquivalentsMemberus-gaap:FairValueInputsLevel1Memberintc:GovernmentDebtSecuritiesMember2021-12-250000050863us-gaap:FairValueMeasurementsRecurringMemberus-gaap:CashEquivalentsMemberus-gaap:FairValueInputsLevel2Memberintc:GovernmentDebtSecuritiesMember2021-12-250000050863us-gaap:FairValueMeasurementsRecurringMemberus-gaap:CashEquivalentsMemberus-gaap:FairValueInputsLevel3Memberintc:GovernmentDebtSecuritiesMember2021-12-250000050863us-gaap:FairValueMeasurementsRecurringMemberus-gaap:CashEquivalentsMemberintc:GovernmentDebtSecuritiesMember2021-12-250000050863us-gaap:FairValueMeasurementsRecurringMemberus-gaap:CashEquivalentsMemberus-gaap:FairValueInputsLevel1Member2022-04-020000050863us-gaap:FairValueMeasurementsRecurringMemberus-gaap:CashEquivalentsMemberus-gaap:FairValueInputsLevel2Member2022-04-020000050863us-gaap:FairValueMeasurementsRecurringMemberus-gaap:CashEquivalentsMemberus-gaap:FairValueInputsLevel3Member2022-04-020000050863us-gaap:FairValueMeasurementsRecurringMemberus-gaap:CashEquivalentsMember2022-04-020000050863us-gaap:FairValueMeasurementsRecurringMemberus-gaap:CashEquivalentsMemberus-gaap:FairValueInputsLevel1Member2021-12-250000050863us-gaap:FairValueMeasurementsRecurringMemberus-gaap:CashEquivalentsMemberus-gaap:FairValueInputsLevel2Member2021-12-250000050863us-gaap:FairValueMeasurementsRecurringMemberus-gaap:CashEquivalentsMemberus-gaap:FairValueInputsLevel3Member2021-12-250000050863us-gaap:FairValueMeasurementsRecurringMemberus-gaap:CashEquivalentsMember2021-12-250000050863us-gaap:FairValueMeasurementsRecurringMemberus-gaap:CorporateDebtSecuritiesMemberus-gaap:FairValueInputsLevel1Memberus-gaap:ShortTermInvestmentsMember2022-04-020000050863us-gaap:FairValueMeasurementsRecurringMemberus-gaap:CorporateDebtSecuritiesMemberus-gaap:FairValueInputsLevel2Memberus-gaap:ShortTermInvestmentsMember2022-04-020000050863us-gaap:FairValueMeasurementsRecurringMemberus-gaap:FairValueInputsLevel3Memberus-gaap:CorporateDebtSecuritiesMemberus-gaap:ShortTermInvestmentsMember2022-04-020000050863us-gaap:FairValueMeasurementsRecurringMemberus-gaap:CorporateDebtSecuritiesMemberus-gaap:ShortTermInvestmentsMember2022-04-020000050863us-gaap:FairValueMeasurementsRecurringMemberus-gaap:CorporateDebtSecuritiesMemberus-gaap:FairValueInputsLevel1Memberus-gaap:ShortTermInvestmentsMember2021-12-250000050863us-gaap:FairValueMeasurementsRecurringMemberus-gaap:CorporateDebtSecuritiesMemberus-gaap:FairValueInputsLevel2Memberus-gaap:ShortTermInvestmentsMember2021-12-250000050863us-gaap:FairValueMeasurementsRecurringMemberus-gaap:FairValueInputsLevel3Memberus-gaap:CorporateDebtSecuritiesMemberus-gaap:ShortTermInvestmentsMember2021-12-250000050863us-gaap:FairValueMeasurementsRecurringMemberus-gaap:CorporateDebtSecuritiesMemberus-gaap:ShortTermInvestmentsMember2021-12-250000050863us-gaap:FairValueMeasurementsRecurringMemberus-gaap:FixedIncomeSecuritiesMemberus-gaap:FairValueInputsLevel1Memberus-gaap:ShortTermInvestmentsMember2022-04-020000050863us-gaap:FairValueMeasurementsRecurringMemberus-gaap:FixedIncomeSecuritiesMemberus-gaap:FairValueInputsLevel2Memberus-gaap:ShortTermInvestmentsMember2022-04-020000050863us-gaap:FairValueMeasurementsRecurringMemberus-gaap:FixedIncomeSecuritiesMemberus-gaap:FairValueInputsLevel3Memberus-gaap:ShortTermInvestmentsMember2022-04-020000050863us-gaap:FairValueMeasurementsRecurringMemberus-gaap:FixedIncomeSecuritiesMemberus-gaap:ShortTermInvestmentsMember2022-04-020000050863us-gaap:FairValueMeasurementsRecurringMemberus-gaap:FixedIncomeSecuritiesMemberus-gaap:FairValueInputsLevel1Memberus-gaap:ShortTermInvestmentsMember2021-12-250000050863us-gaap:FairValueMeasurementsRecurringMemberus-gaap:FixedIncomeSecuritiesMemberus-gaap:FairValueInputsLevel2Memberus-gaap:ShortTermInvestmentsMember2021-12-250000050863us-gaap:FairValueMeasurementsRecurringMemberus-gaap:FixedIncomeSecuritiesMemberus-gaap:FairValueInputsLevel3Memberus-gaap:ShortTermInvestmentsMember2021-12-250000050863us-gaap:FairValueMeasurementsRecurringMemberus-gaap:FixedIncomeSecuritiesMemberus-gaap:ShortTermInvestmentsMember2021-12-250000050863us-gaap:FairValueMeasurementsRecurringMemberus-gaap:FairValueInputsLevel1Memberintc:GovernmentDebtSecuritiesMemberus-gaap:ShortTermInvestmentsMember2022-04-020000050863us-gaap:FairValueMeasurementsRecurringMemberus-gaap:FairValueInputsLevel2Memberintc:GovernmentDebtSecuritiesMemberus-gaap:ShortTermInvestmentsMember2022-04-020000050863us-gaap:FairValueMeasurementsRecurringMemberus-gaap:FairValueInputsLevel3Memberintc:GovernmentDebtSecuritiesMemberus-gaap:ShortTermInvestmentsMember2022-04-020000050863us-gaap:FairValueMeasurementsRecurringMemberintc:GovernmentDebtSecuritiesMemberus-gaap:ShortTermInvestmentsMember2022-04-020000050863us-gaap:FairValueMeasurementsRecurringMemberus-gaap:FairValueInputsLevel1Memberintc:GovernmentDebtSecuritiesMemberus-gaap:ShortTermInvestmentsMember2021-12-250000050863us-gaap:FairValueMeasurementsRecurringMemberus-gaap:FairValueInputsLevel2Memberintc:GovernmentDebtSecuritiesMemberus-gaap:ShortTermInvestmentsMember2021-12-250000050863us-gaap:FairValueMeasurementsRecurringMemberus-gaap:FairValueInputsLevel3Memberintc:GovernmentDebtSecuritiesMemberus-gaap:ShortTermInvestmentsMember2021-12-250000050863us-gaap:FairValueMeasurementsRecurringMemberintc:GovernmentDebtSecuritiesMemberus-gaap:ShortTermInvestmentsMember2021-12-250000050863us-gaap:FairValueMeasurementsRecurringMemberus-gaap:FairValueInputsLevel1Memberus-gaap:OtherCurrentAssetsMember2022-04-020000050863us-gaap:FairValueMeasurementsRecurringMemberus-gaap:FairValueInputsLevel2Memberus-gaap:OtherCurrentAssetsMember2022-04-020000050863us-gaap:FairValueMeasurementsRecurringMemberus-gaap:FairValueInputsLevel3Memberus-gaap:OtherCurrentAssetsMember2022-04-020000050863us-gaap:FairValueMeasurementsRecurringMemberus-gaap:OtherCurrentAssetsMember2022-04-020000050863us-gaap:FairValueMeasurementsRecurringMemberus-gaap:FairValueInputsLevel1Memberus-gaap:OtherCurrentAssetsMember2021-12-250000050863us-gaap:FairValueMeasurementsRecurringMemberus-gaap:FairValueInputsLevel2Memberus-gaap:OtherCurrentAssetsMember2021-12-250000050863us-gaap:FairValueMeasurementsRecurringMemberus-gaap:FairValueInputsLevel3Memberus-gaap:OtherCurrentAssetsMember2021-12-250000050863us-gaap:FairValueMeasurementsRecurringMemberus-gaap:OtherCurrentAssetsMember2021-12-250000050863us-gaap:EquitySecuritiesMemberus-gaap:FairValueMeasurementsRecurringMemberus-gaap:FairValueInputsLevel1Member2022-04-020000050863us-gaap:EquitySecuritiesMemberus-gaap:FairValueMeasurementsRecurringMemberus-gaap:FairValueInputsLevel2Member2022-04-020000050863us-gaap:EquitySecuritiesMemberus-gaap:FairValueMeasurementsRecurringMemberus-gaap:FairValueInputsLevel3Member2022-04-020000050863us-gaap:EquitySecuritiesMemberus-gaap:FairValueMeasurementsRecurringMember2022-04-020000050863us-gaap:EquitySecuritiesMemberus-gaap:FairValueMeasurementsRecurringMemberus-gaap:FairValueInputsLevel1Member2021-12-250000050863us-gaap:EquitySecuritiesMemberus-gaap:FairValueMeasurementsRecurringMemberus-gaap:FairValueInputsLevel2Member2021-12-250000050863us-gaap:EquitySecuritiesMemberus-gaap:FairValueMeasurementsRecurringMemberus-gaap:FairValueInputsLevel3Member2021-12-250000050863us-gaap:EquitySecuritiesMemberus-gaap:FairValueMeasurementsRecurringMember2021-12-250000050863us-gaap:FairValueMeasurementsRecurringMemberus-gaap:OtherNoncurrentAssetsMemberus-gaap:FairValueInputsLevel1Member2022-04-020000050863us-gaap:FairValueMeasurementsRecurringMemberus-gaap:OtherNoncurrentAssetsMemberus-gaap:FairValueInputsLevel2Member2022-04-020000050863us-gaap:FairValueMeasurementsRecurringMemberus-gaap:OtherNoncurrentAssetsMemberus-gaap:FairValueInputsLevel3Member2022-04-020000050863us-gaap:FairValueMeasurementsRecurringMemberus-gaap:OtherNoncurrentAssetsMember2022-04-020000050863us-gaap:FairValueMeasurementsRecurringMemberus-gaap:OtherNoncurrentAssetsMemberus-gaap:FairValueInputsLevel1Member2021-12-250000050863us-gaap:FairValueMeasurementsRecurringMemberus-gaap:OtherNoncurrentAssetsMemberus-gaap:FairValueInputsLevel2Member2021-12-250000050863us-gaap:FairValueMeasurementsRecurringMemberus-gaap:OtherNoncurrentAssetsMemberus-gaap:FairValueInputsLevel3Member2021-12-250000050863us-gaap:FairValueMeasurementsRecurringMemberus-gaap:OtherNoncurrentAssetsMember2021-12-250000050863us-gaap:FairValueMeasurementsRecurringMemberus-gaap:FairValueInputsLevel1Member2022-04-020000050863us-gaap:FairValueMeasurementsRecurringMemberus-gaap:FairValueInputsLevel2Member2022-04-020000050863us-gaap:FairValueMeasurementsRecurringMemberus-gaap:FairValueInputsLevel3Member2022-04-020000050863us-gaap:FairValueMeasurementsRecurringMember2022-04-020000050863us-gaap:FairValueMeasurementsRecurringMemberus-gaap:FairValueInputsLevel1Member2021-12-250000050863us-gaap:FairValueMeasurementsRecurringMemberus-gaap:FairValueInputsLevel2Member2021-12-250000050863us-gaap:FairValueMeasurementsRecurringMemberus-gaap:FairValueInputsLevel3Member2021-12-250000050863us-gaap:FairValueMeasurementsRecurringMember2021-12-250000050863us-gaap:FairValueMeasurementsRecurringMemberus-gaap:OtherCurrentLiabilitiesMemberus-gaap:FairValueInputsLevel1Member2022-04-020000050863us-gaap:FairValueMeasurementsRecurringMemberus-gaap:OtherCurrentLiabilitiesMemberus-gaap:FairValueInputsLevel2Member2022-04-020000050863us-gaap:FairValueMeasurementsRecurringMemberus-gaap:FairValueInputsLevel3Memberus-gaap:OtherCurrentLiabilitiesMember2022-04-020000050863us-gaap:FairValueMeasurementsRecurringMemberus-gaap:OtherCurrentLiabilitiesMember2022-04-020000050863us-gaap:FairValueMeasurementsRecurringMemberus-gaap:OtherCurrentLiabilitiesMemberus-gaap:FairValueInputsLevel1Member2021-12-250000050863us-gaap:FairValueMeasurementsRecurringMemberus-gaap:OtherCurrentLiabilitiesMemberus-gaap:FairValueInputsLevel2Member2021-12-250000050863us-gaap:FairValueMeasurementsRecurringMemberus-gaap:FairValueInputsLevel3Memberus-gaap:OtherCurrentLiabilitiesMember2021-12-250000050863us-gaap:FairValueMeasurementsRecurringMemberus-gaap:OtherCurrentLiabilitiesMember2021-12-250000050863us-gaap:FairValueMeasurementsRecurringMemberus-gaap:OtherNoncurrentLiabilitiesMemberus-gaap:FairValueInputsLevel1Member2022-04-020000050863us-gaap:FairValueMeasurementsRecurringMemberus-gaap:OtherNoncurrentLiabilitiesMemberus-gaap:FairValueInputsLevel2Member2022-04-020000050863us-gaap:FairValueMeasurementsRecurringMemberus-gaap:OtherNoncurrentLiabilitiesMemberus-gaap:FairValueInputsLevel3Member2022-04-020000050863us-gaap:FairValueMeasurementsRecurringMemberus-gaap:OtherNoncurrentLiabilitiesMember2022-04-020000050863us-gaap:FairValueMeasurementsRecurringMemberus-gaap:OtherNoncurrentLiabilitiesMemberus-gaap:FairValueInputsLevel1Member2021-12-250000050863us-gaap:FairValueMeasurementsRecurringMemberus-gaap:OtherNoncurrentLiabilitiesMemberus-gaap:FairValueInputsLevel2Member2021-12-250000050863us-gaap:FairValueMeasurementsRecurringMemberus-gaap:OtherNoncurrentLiabilitiesMemberus-gaap:FairValueInputsLevel3Member2021-12-250000050863us-gaap:FairValueMeasurementsRecurringMemberus-gaap:OtherNoncurrentLiabilitiesMember2021-12-250000050863us-gaap:FairValueMeasurementsNonrecurringMember2022-04-020000050863us-gaap:FairValueMeasurementsNonrecurringMember2021-12-250000050863us-gaap:FairValueMeasurementsNonrecurringMemberus-gaap:FairValueInputsLevel2Memberus-gaap:CarryingReportedAmountFairValueDisclosureMember2022-04-020000050863us-gaap:FairValueMeasurementsNonrecurringMemberus-gaap:FairValueInputsLevel2Memberus-gaap:CarryingReportedAmountFairValueDisclosureMember2021-12-250000050863us-gaap:AccumulatedNetInvestmentGainLossIncludingPortionAttributableToNoncontrollingInterestMember2021-12-250000050863us-gaap:AccumulatedNetGainLossFromCashFlowHedgesIncludingPortionAttributableToNoncontrollingInterestMember2021-12-250000050863us-gaap:AccumulatedDefinedBenefitPlansAdjustmentNetGainLossIncludingPortionAttributableToNoncontrollingInterestMember2021-12-250000050863us-gaap:AccumulatedTranslationAdjustmentMember2021-12-250000050863us-gaap:AccumulatedNetInvestmentGainLossIncludingPortionAttributableToNoncontrollingInterestMember2021-12-262022-04-020000050863us-gaap:AccumulatedNetGainLossFromCashFlowHedgesIncludingPortionAttributableToNoncontrollingInterestMember2021-12-262022-04-020000050863us-gaap:AccumulatedDefinedBenefitPlansAdjustmentNetGainLossIncludingPortionAttributableToNoncontrollingInterestMember2021-12-262022-04-020000050863us-gaap:AccumulatedTranslationAdjustmentMember2021-12-262022-04-020000050863us-gaap:AccumulatedNetInvestmentGainLossIncludingPortionAttributableToNoncontrollingInterestMember2022-04-020000050863us-gaap:AccumulatedNetGainLossFromCashFlowHedgesIncludingPortionAttributableToNoncontrollingInterestMember2022-04-020000050863us-gaap:AccumulatedDefinedBenefitPlansAdjustmentNetGainLossIncludingPortionAttributableToNoncontrollingInterestMember2022-04-020000050863us-gaap:AccumulatedTranslationAdjustmentMember2022-04-020000050863us-gaap:ForeignExchangeContractMember2022-04-020000050863us-gaap:ForeignExchangeContractMember2021-12-250000050863us-gaap:InterestRateContractMember2022-04-020000050863us-gaap:InterestRateContractMember2021-12-250000050863us-gaap:OtherContractMember2022-04-020000050863us-gaap:OtherContractMember2021-12-250000050863us-gaap:ForeignExchangeContractMemberus-gaap:OtherAssetsMemberus-gaap:DesignatedAsHedgingInstrumentMember2022-04-020000050863us-gaap:ForeignExchangeContractMemberus-gaap:OtherLiabilitiesMemberus-gaap:DesignatedAsHedgingInstrumentMember2022-04-020000050863us-gaap:ForeignExchangeContractMemberus-gaap:OtherAssetsMemberus-gaap:DesignatedAsHedgingInstrumentMember2021-12-250000050863us-gaap:ForeignExchangeContractMemberus-gaap:OtherLiabilitiesMemberus-gaap:DesignatedAsHedgingInstrumentMember2021-12-250000050863us-gaap:OtherAssetsMemberus-gaap:DesignatedAsHedgingInstrumentMemberus-gaap:InterestRateContractMember2022-04-020000050863us-gaap:OtherLiabilitiesMemberus-gaap:DesignatedAsHedgingInstrumentMemberus-gaap:InterestRateContractMember2022-04-020000050863us-gaap:OtherAssetsMemberus-gaap:DesignatedAsHedgingInstrumentMemberus-gaap:InterestRateContractMember2021-12-250000050863us-gaap:OtherLiabilitiesMemberus-gaap:DesignatedAsHedgingInstrumentMemberus-gaap:InterestRateContractMember2021-12-250000050863us-gaap:OtherAssetsMemberus-gaap:DesignatedAsHedgingInstrumentMember2022-04-020000050863us-gaap:OtherLiabilitiesMemberus-gaap:DesignatedAsHedgingInstrumentMember2022-04-020000050863us-gaap:OtherAssetsMemberus-gaap:DesignatedAsHedgingInstrumentMember2021-12-250000050863us-gaap:OtherLiabilitiesMemberus-gaap:DesignatedAsHedgingInstrumentMember2021-12-250000050863us-gaap:ForeignExchangeContractMemberus-gaap:NondesignatedMemberus-gaap:OtherAssetsMember2022-04-020000050863us-gaap:ForeignExchangeContractMemberus-gaap:OtherLiabilitiesMemberus-gaap:NondesignatedMember2022-04-020000050863us-gaap:ForeignExchangeContractMemberus-gaap:NondesignatedMemberus-gaap:OtherAssetsMember2021-12-250000050863us-gaap:ForeignExchangeContractMemberus-gaap:OtherLiabilitiesMemberus-gaap:NondesignatedMember2021-12-250000050863us-gaap:NondesignatedMemberus-gaap:OtherAssetsMemberus-gaap:InterestRateContractMember2022-04-020000050863us-gaap:OtherLiabilitiesMemberus-gaap:NondesignatedMemberus-gaap:InterestRateContractMember2022-04-020000050863us-gaap:NondesignatedMemberus-gaap:OtherAssetsMemberus-gaap:InterestRateContractMember2021-12-250000050863us-gaap:OtherLiabilitiesMemberus-gaap:NondesignatedMemberus-gaap:InterestRateContractMember2021-12-250000050863us-gaap:OtherContractMemberus-gaap:NondesignatedMemberus-gaap:OtherAssetsMember2022-04-020000050863us-gaap:OtherLiabilitiesMemberus-gaap:OtherContractMemberus-gaap:NondesignatedMember2022-04-020000050863us-gaap:OtherContractMemberus-gaap:NondesignatedMemberus-gaap:OtherAssetsMember2021-12-250000050863us-gaap:OtherLiabilitiesMemberus-gaap:OtherContractMemberus-gaap:NondesignatedMember2021-12-250000050863us-gaap:NondesignatedMemberus-gaap:OtherAssetsMember2022-04-020000050863us-gaap:OtherLiabilitiesMemberus-gaap:NondesignatedMember2022-04-020000050863us-gaap:NondesignatedMemberus-gaap:OtherAssetsMember2021-12-250000050863us-gaap:OtherLiabilitiesMemberus-gaap:NondesignatedMember2021-12-250000050863us-gaap:OtherAssetsMember2022-04-020000050863us-gaap:OtherLiabilitiesMember2022-04-020000050863us-gaap:OtherAssetsMember2021-12-250000050863us-gaap:OtherLiabilitiesMember2021-12-250000050863us-gaap:ForeignExchangeContractMember2021-12-262022-04-020000050863us-gaap:ForeignExchangeContractMember2020-12-272021-03-270000050863us-gaap:FairValueHedgingMemberus-gaap:OtherNonoperatingIncomeExpenseMember2021-12-262022-04-020000050863us-gaap:InterestRateContractMember2021-12-262022-04-020000050863us-gaap:InterestRateContractMember2020-12-272021-03-270000050863us-gaap:FairValueHedgingMemberus-gaap:LongTermDebtMemberus-gaap:InterestRateSwapMember2022-04-020000050863us-gaap:FairValueHedgingMemberus-gaap:LongTermDebtMemberus-gaap:InterestRateSwapMember2021-12-250000050863us-gaap:FairValueHedgingMemberus-gaap:LongTermDebtMemberus-gaap:InterestRateSwapMember2021-12-262022-04-020000050863us-gaap:FairValueHedgingMemberus-gaap:LongTermDebtMemberus-gaap:InterestRateSwapMember2020-12-272021-12-250000050863us-gaap:NondesignatedMember2021-12-262022-04-020000050863us-gaap:ForeignExchangeContractMemberus-gaap:OtherNonoperatingIncomeExpenseMemberus-gaap:NondesignatedMember2021-12-262022-04-020000050863us-gaap:ForeignExchangeContractMemberus-gaap:OtherNonoperatingIncomeExpenseMemberus-gaap:NondesignatedMember2020-12-272021-03-270000050863us-gaap:OtherNonoperatingIncomeExpenseMemberus-gaap:NondesignatedMemberus-gaap:InterestRateContractMember2021-12-262022-04-020000050863us-gaap:OtherNonoperatingIncomeExpenseMemberus-gaap:NondesignatedMemberus-gaap:InterestRateContractMember2020-12-272021-03-270000050863us-gaap:OtherContractMemberus-gaap:NondesignatedMemberintc:VariousMember2021-12-262022-04-020000050863us-gaap:OtherContractMemberus-gaap:NondesignatedMemberintc:VariousMember2020-12-272021-03-270000050863us-gaap:NondesignatedMember2020-12-272021-03-270000050863intc:EcFineMember2009-05-012009-05-31iso4217:EUR0000050863us-gaap:SeniorNotesMember2022-04-02
UNITED STATES SECURITIES AND EXCHANGE COMMISSION
Washington, D.C. 20549
FORM 10-Q
(Mark One)
| | | | | | | | | | | |
| | ☑ | QUARTERLY REPORT PURSUANT TO SECTION 13 OR 15(d) OF THE SECURITIES EXCHANGE ACT OF 1934 |
| | For the quarterly period ended | April 2, 2022 |
Or
| | | | | | | | |
| | ☐ | TRANSITION REPORT PURSUANT TO SECTION 13 OR 15(d) OF THE SECURITIES EXCHANGE ACT OF 1934 |
| | For the transition period from to |
Commission File Number 000-06217
INTEL CORPORATION
(Exact name of registrant as specified in its charter)
| | | | | | | | | | | | | | |
| Delaware | | | 94-1672743 |
| (State or other jurisdiction of incorporation or organization) | | (I.R.S. Employer Identification No.) |
| | | | |
| 2200 Mission College Boulevard, | Santa Clara, | California | | 95054-1549 |
| (Address of principal executive offices) | | (Zip Code) |
(408) 765-8080
(Registrant’s telephone number, including area code)
N/A
(Former name, former address and former fiscal year, if changed since last report)
Securities registered pursuant to Section 12(b) of the Act:
| | | | | | | | |
| Title of each class | Trading Symbol(s) | Name of each exchange on which registered |
| Common stock, $0.001 par value | INTC | Nasdaq Global Select Market |
Indicate by check mark whether the registrant (1) has filed all reports required to be filed by Section 13 or 15(d) of the Securities Exchange Act of 1934 during the preceding 12 months (or for such shorter period that the registrant was required to file such reports), and (2) has been subject to such filing requirements for the past 90 days. Yes ☑ No ¨
Indicate by check mark whether the registrant has submitted electronically every Interactive Data File required to be submitted pursuant to Rule 405 of Regulation S-T (§232.405 of this chapter) during the preceding 12 months (or for such shorter period that the registrant was required to submit such files). Yes ☑ No ¨
Indicate by check mark whether the registrant is a large accelerated filer, an accelerated filer, a non-accelerated filer, a smaller reporting company, or an emerging growth company. See the definitions of “large accelerated filer,” “accelerated filer,” “smaller reporting company,” and "emerging growth company" in Rule 12b-2 of the Exchange Act.
| | | | | | | | | | | | | | | | | |
| Large Accelerated Filer | | Accelerated filer | | Non-accelerated filer | | Smaller reporting company | Emerging growth company |
☑
| | ¨ | | ¨ | | ☐ | ☐ |
| | | | | | | |
If an emerging growth company, indicate by check mark if the registrant has elected not to use the extended transition period for complying with any new or revised financial accounting standards provided pursuant to Section 13(a) of the Exchange Act. ¨
Indicate by check mark whether the registrant is a shell company (as defined in Rule 12b-2 of the Exchange Act). Yes ☐ No ☑
As of April 2, 2022, the registrant had outstanding 4,089 million shares of common stock.
Table of Contents
The Organization of Our Quarterly Report on Form 10-Q
The order and presentation of content in our Form 10-Q differs from the traditional SEC Form 10-Q format. Our format is designed to improve readability and better present how we organize and manage our business. See "Form 10-Q Cross-Reference Index" within Other Key Information for a cross-reference index to the traditional SEC Form 10-Q format.
We have defined certain terms and abbreviations used throughout our Form 10-Q in "Key Terms" within Consolidated Condensed Financial Statements and Supplemental Details.
The preparation of our Consolidated Condensed Financial Statements is in conformity with U.S. GAAP. Our Form 10-Q includes key metrics that we use to measure our business, some of which are non-GAAP measures. See "Non-GAAP Financial Measures" within MD&A for an explanation of these measures and why management uses them and believes they provide investors with useful supplemental information.
| | | | | | | | | | | |
| | | Page |
Forward-Looking Statements | |
| |
A Quarter in Review | |
Consolidated Condensed Financial Statements and Supplemental Details | |
| Consolidated Condensed Statements of Income | |
| Consolidated Condensed Statements of Comprehensive Income | |
| Consolidated Condensed Balance Sheets | |
| Consolidated Condensed Statements of Cash Flows | |
| Consolidated Condensed Statements of Stockholders' Equity | |
| Notes to Consolidated Condensed Financial Statements | |
| Key Terms | |
| | | |
Management's Discussion and Analysis | |
| | |
| | |
| Segment Trends and Results | |
| | | |
| | | |
| | | |
| | | |
| | | |
| Consolidated Results of Operations | |
| Liquidity and Capital Resources | |
| | |
| | |
| Non-GAAP Financial Measures | |
| | | |
Other Key Information | |
| Quantitative and Qualitative Disclosures about Market Risk | |
| Risk Factors | |
| Controls and Procedures | |
| | |
| Issuer Purchases of Equity Securities | |
| Disclosure Pursuant to Section 13(r) of the Securities Exchange Act of 1934 | |
| Exhibits | |
| Form 10-Q Cross-Reference Index | |
Forward-Looking Statements
This Form 10-Q contains forward-looking statements that involve a number of risks and uncertainties. Words such as "anticipate," "expect," "intend," "aim," "strive," "objective," "goals," "plans," "ambitions," "opportunity," "outlook," "predict," "future," "to be," "roadmap," "achieve," "grow," "committed," "believes," "seeks," "targets," "milestones," "estimated," "continues," "likely," "possible," "may," "might," "potentially," "will," "would," "should," "could," "on track," "positioned," and variations of such words and similar expressions are intended to identify such forward-looking statements. In addition, any statements that refer to Intel’s strategy and its anticipated benefits, including updates to our reporting structure; Intel's process and packaging technology, roadmap, and schedules, including future node performance and other metrics; manufacturing expansion and financing plans; investment plans, and impacts of investment plans, including in the U.S. and abroad; future responses to and effects of COVID-19, including manufacturing, transportation, and operational restrictions or disruptions, such as the recent Shanghai port shutdown; future economic conditions; projections of our future financial performance; future business, social, and environmental performance, goals, measures and strategies; our anticipated growth and trends in our businesses and operations; projected growth and trends in markets relevant to our businesses; business plans; future products, services and technology, and the expected regulation, availability, production and benefits of such products, services and technology; projected costs and yield trends; product and manufacturing plans, goals, timelines, ramps, progress and future product and process leadership and performance; geopolitical conditions, including the impacts of Russia's war on Ukraine and the suspension of our operations; expected timing and impact of acquisitions, divestitures, and other significant transactions, including statements relating to the pending acquisitions of Tower Semiconductor Ltd. and Granulate Cloud Solutions Ltd, the sale of our NAND memory business, and the proposed initial public offering of Mobileye; expected completion of restructuring activities; availability, uses, sufficiency, and cost of capital and of capital resources, including expected returns to stockholders such as dividends and share repurchases, and the expected timing of future repurchases; our valuation; future production capacity and product supply; supply expectations, including regarding constraints, limitations, pricing and industry shortages; the future purchase, use, and availability of products, components and services supplied by third parties, including third-party IP and manufacturing services; tax- and accounting-related expectations; LIBOR-related expectations; our role in the Rapid Assured Microelectronics Prototypes - Commercial program; uncertain events or assumptions, including statements relating to TAM, product or customer demand or market opportunity; and other characterizations of future events or circumstances are forward-looking statements. Such statements are based on management's expectations as of the date of this filing, unless an earlier date is specified, and involve many risks and uncertainties that could cause our actual results to differ materially from those expressed or implied in our forward-looking statements. Such risks and uncertainties include those described throughout this report and our 2021 Form 10-K, particularly in "Risk Factors" within Other Key Information. Given these risks and uncertainties, readers are cautioned not to place undue reliance on such forward-looking statements. Readers are urged to carefully review and consider the various disclosures made in this Form 10-Q and in other documents we file from time to time with the SEC that disclose risks and uncertainties that may affect our business. Unless specifically indicated otherwise, the forward-looking statements in this Form 10-Q do not reflect the potential impact of any divestitures, mergers, acquisitions, or other business combinations that have not been completed as of the date of this filing. In addition, the forward-looking statements in this Form 10-Q are made as of the date of this filing, unless an earlier date is specified, including expectations based on third-party information and projections that management believes to be reputable, and Intel does not undertake, and expressly disclaims any duty, to update such statements, whether as a result of new information, new developments, or otherwise, except to the extent that disclosure may be required by law.
Intel, the Intel logo, and Intel Core are trademarks of Intel Corporation or its subsidiaries in the U.S. and/or other countries.
* Other names and brands may be claimed as the property of others.
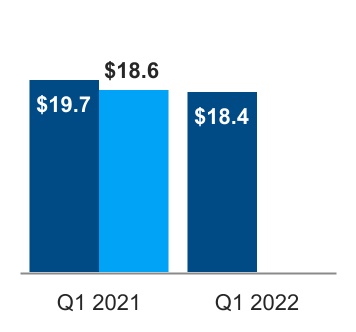
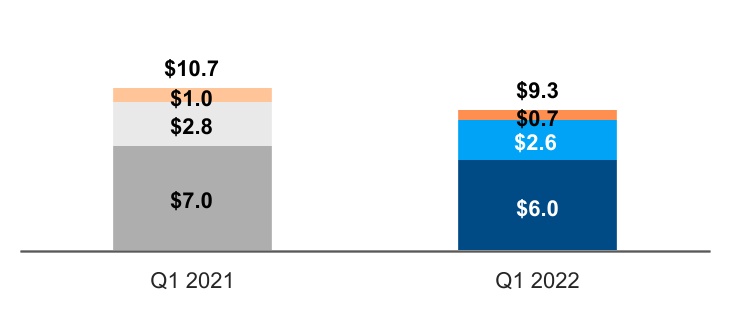
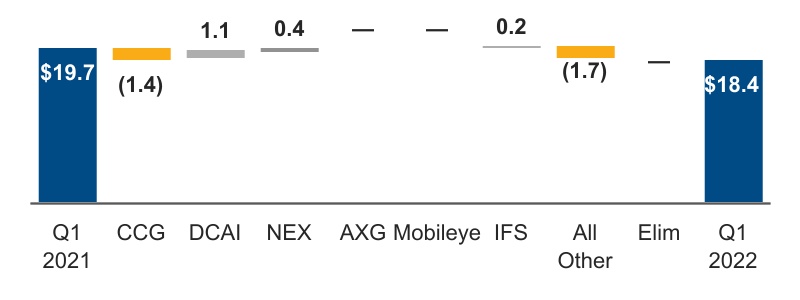
Total revenue of $18.4 billion was down $1.3 billion year over year as CCG decreased 13% and DCAI increased 22%. CCG was down on lower notebook and desktop volume, partially offset by higher notebook and desktop ASPs, and lower revenue due to the continued ramp down from the exit of our 5G smartphone modem business. DCAI revenue increased on higher server volume due to strength in hyperscale products and continued recovery from COVID-driven lows in Q1 2021, partially offset by lower server ASPs. NEX revenue increased on strong demand for cloud networking and edge products. Refer to Note 2: Operating Segments within Notes to Consolidated Condensed Financial Statements for further information about the recent changes to our operating segments.
| | | | | | | | | | | | | | | | | | | | |
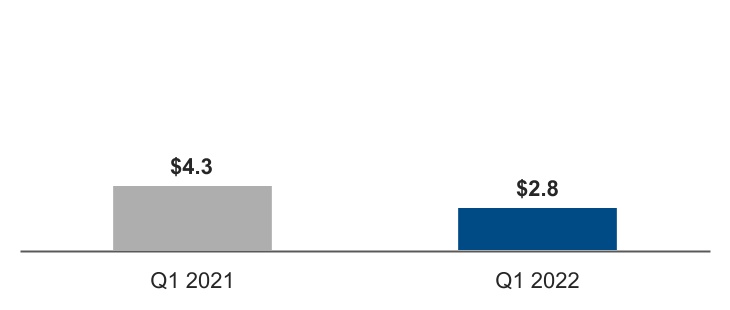
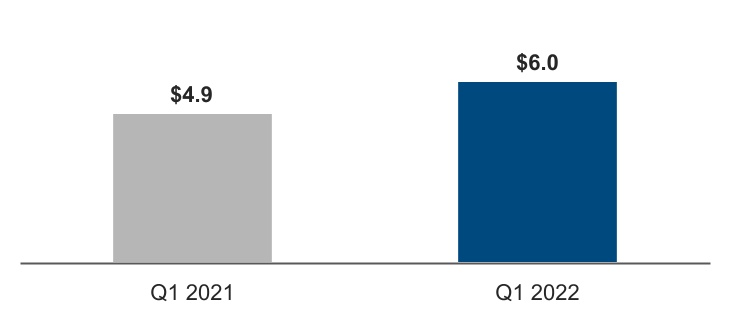
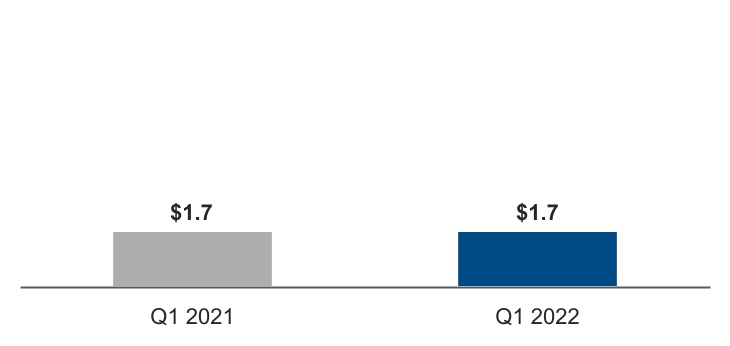
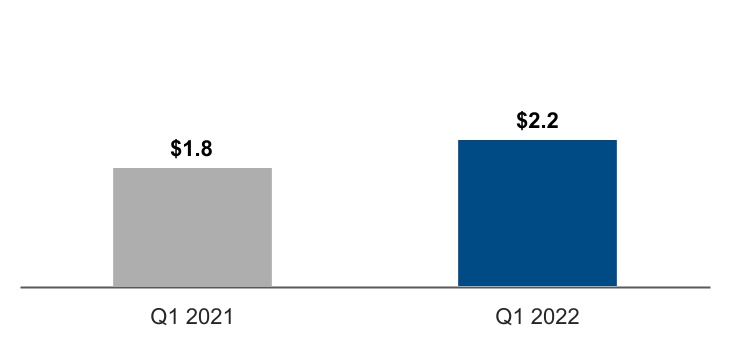
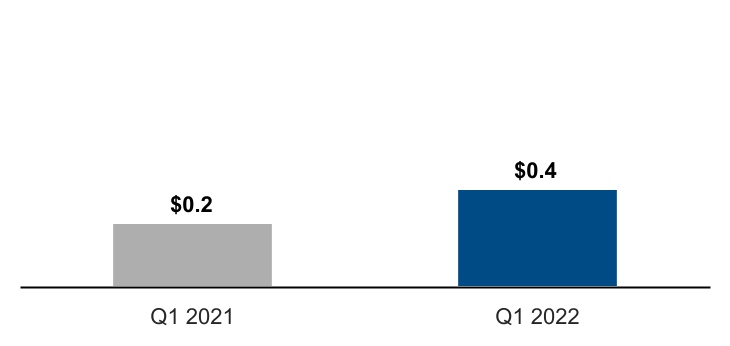
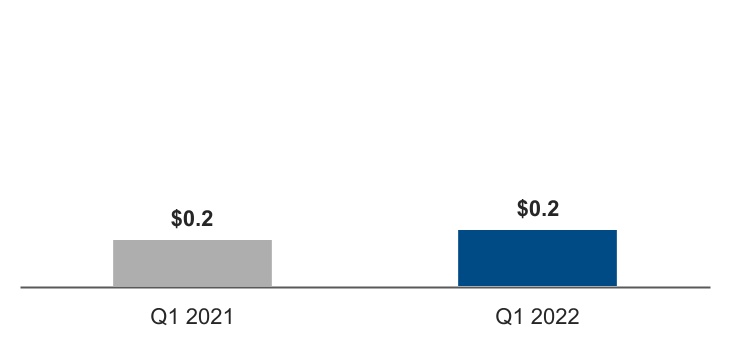
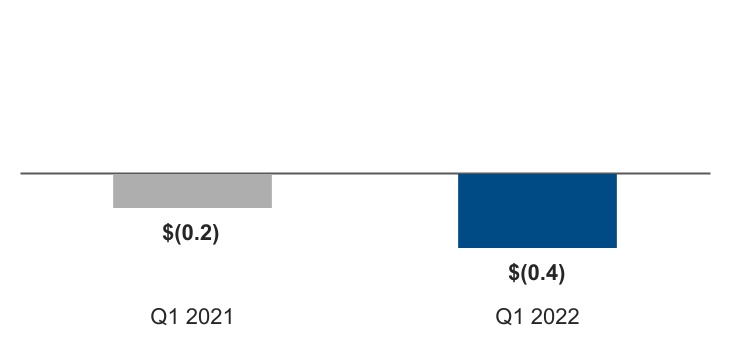
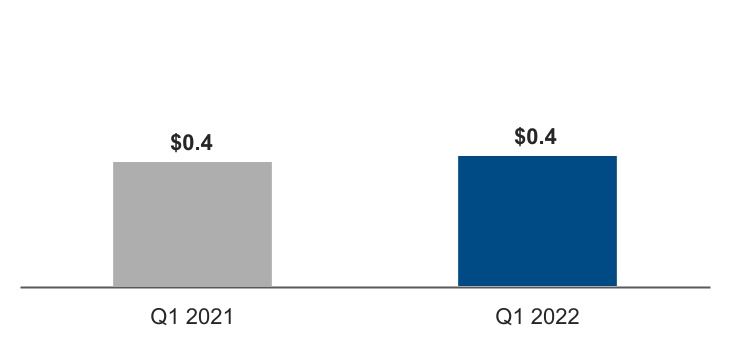
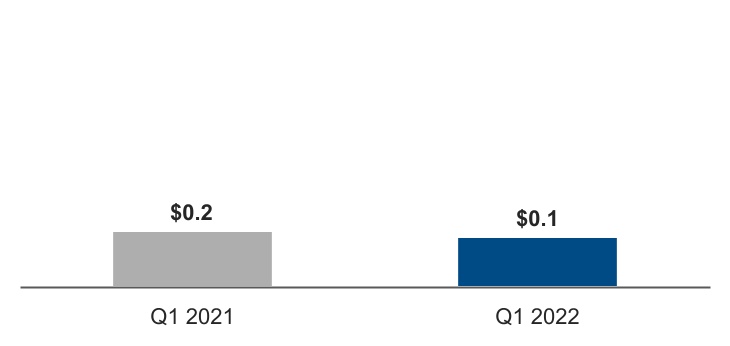
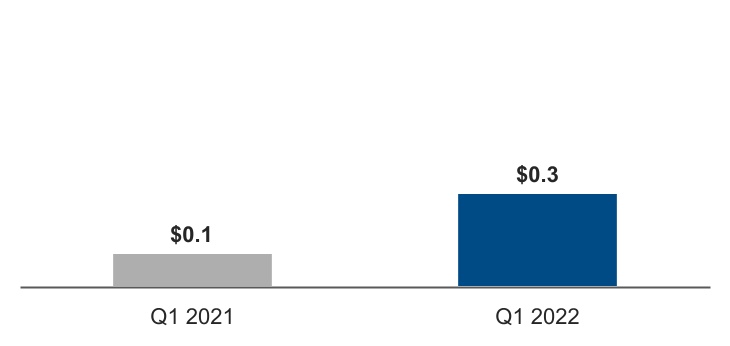
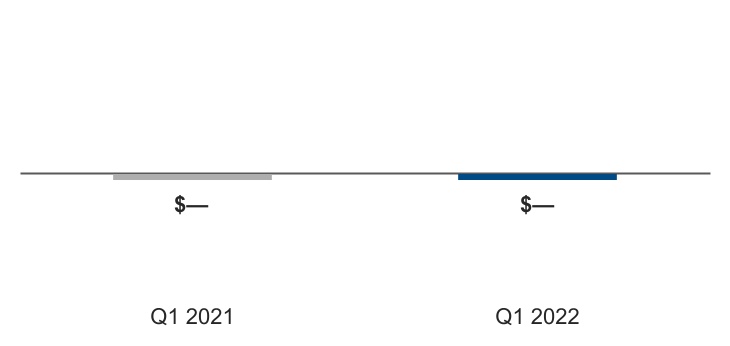
| Revenue | | Gross Margin | | Diluted EPS | | Cash Flows |
■ GAAP $B ■ Non-GAAP $B | | ■ GAAP ■ Non-GAAP | | ■ GAAP ■ Non-GAAP | | ■ Operating Cash Flow $B ■ Adjusted Free Cash Flow $B |
| | | | | | | | | | | | | | | | | | | | | | | | | | | | | | | | | | | | | | | | | | | | |
| | | | | | |
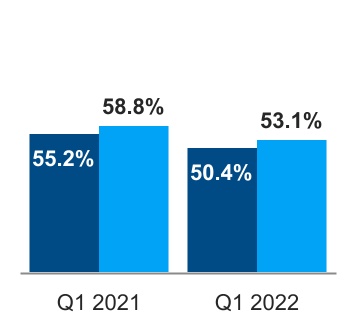
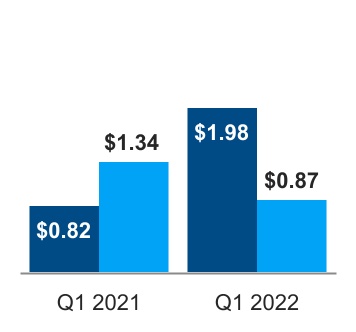
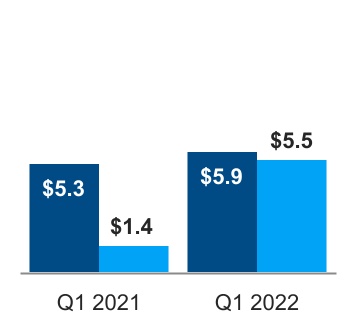
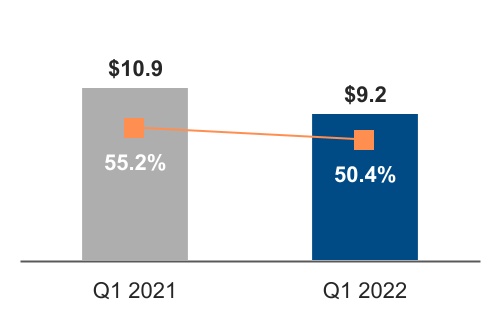
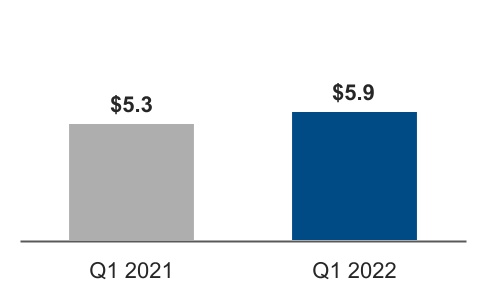
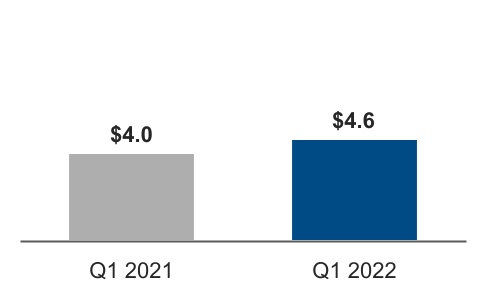
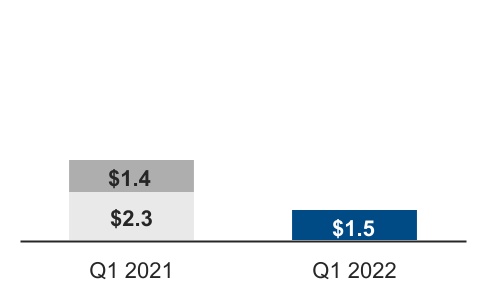
| $18.4B | | 50.4% | | 53.1% | | $1.98 | | $0.87 | | $5.9B | | $5.5B |
| GAAP | | GAAP | | non-GAAP1 | | GAAP | | non-GAAP1 | | GAAP | | non-GAAP1 |
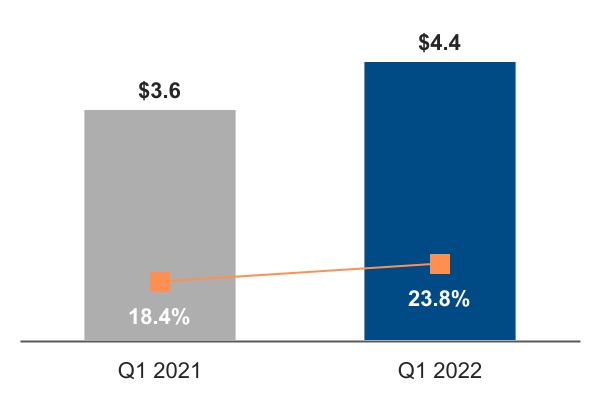
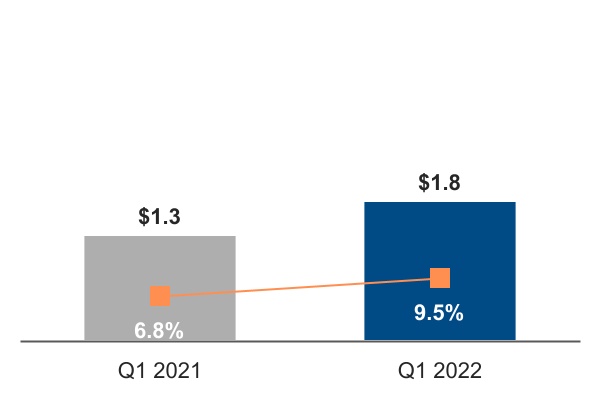
| Revenue down $1.3B or 7% from Q1 2021 | | Gross margin down 4.8 ppts from Q1 2021 | | Gross margin down 5.7 ppt from Q1 2021 | | Diluted EPS up $1.15 or 141% from Q1 2021 | | Diluted EPS down $0.47 or 35% from Q1 2021 | | Operating cash flow up $543M or 10% from Q1 2021 | | Adjusted free cash flow up $4.2B or 303% from Q1 2021 |
| | | | | | | | | | | | |
Lower revenue in CCG and lack of Corporate revenue from a prepaid customer supply agreement in Q1 2021; higher revenue in DCAI and NEX. Non-GAAP Q1 2021 revenue excludes historical results of the divested NAND business. | | Lower gross margin from higher unit cost and higher period charges from ramp of Intel 4, partially offset by changes in revenue. Non-GAAP gross margin excludes amortization of acquisition-related intangibles, share-based compensation, and historical results of the divested NAND business. | | Higher EPS from gains on the sale of McAfee and on the NAND divestiture, and the benefit from the EC fine reversal, partially offset by higher operating expenses from additional investment and a higher effective tax rate. Non-GAAP results incrementally exclude Restructuring and other charges, (Gains) losses from divestiture, (Gains) losses on equity investments, net, the tax reform adjustment, and the tax effects of non-GAAP adjustments. | | Higher operating cash flow driven by decrease in cash used in net working capital and benefit from the EC fine reversal, offset by lower income after adjusting for non-cash items, including the gain on the sale of McAfee and pre-tax gain from the divestiture of our NAND business. Adjusted free cash flow increased due to the proceeds on the sale of McAfee. |
Key Developments
▪We announced our plans to invest up to €80 billion in the European Union over the next decade across the semiconductor value chain – from R&D to manufacturing to state-of-the art packaging technologies. We plan to invest up to an initial €17 billion into a leading-edge semiconductor fab mega-site in Germany, to create a new R&D and design hub in France, and to invest in R&D, manufacturing and foundry services in Ireland, Italy, Poland and Spain.
▪We entered into a definitive agreement to acquire Tower Semiconductor Ltd., a leading foundry for analog semiconductor solutions. The acquisition is expected to advance our IDM 2.0 strategy by accelerating our global end-to-end foundry business.
▪We announced an agreement to acquire Granulate Cloud Solutions Ltd, an Israel-based developer of real-time continuous optimization software. The acquisition of Granulate should help cloud and data center customers maximize compute workload performance and reduce infrastructure and cloud costs.
▪We continue to progress on our previously announced intention to take Mobileye public in the US via an IPO.
1 See "Non-GAAP Financial Measures" within MD&A.
2 See "Key Terms" within Consolidated Condensed Financial Statements and Supplemental Details.
| | | | | |
Consolidated Condensed Statements of Income | |
| |
| | | | | | | | | | | | | | | | | | |
| | | Three Months Ended | | |
(In Millions, Except Per Share Amounts; Unaudited) | | Apr 2, 2022 | | Mar 27, 2021 | | | | |
| Net revenue | | $ | 18,353 | | | $ | 19,673 | | | | | |
| Cost of sales | | 9,109 | | | 8,819 | | | | | |
| Gross margin | | 9,244 | | | 10,854 | | | | | |
| Research and development | | 4,362 | | | 3,623 | | | | | |
| Marketing, general and administrative | | 1,752 | | | 1,328 | | | | | |
| Restructuring and other charges | | (1,211) | | | 2,209 | | | | | |
| Operating expenses | | 4,903 | | | 7,160 | | | | | |
| Operating income | | 4,341 | | | 3,694 | | | | | |
| Gains (losses) on equity investments, net | | 4,323 | | | 368 | | | | | |
| Interest and other, net | | 997 | | | (156) | | | | | |
| Income before taxes | | 9,661 | | | 3,906 | | | | | |
| Provision for taxes | | 1,548 | | | 545 | | | | | |
| Net income | | $ | 8,113 | | | $ | 3,361 | | | | | |
| Earnings per share—basic | | $ | 1.99 | | | $ | 0.83 | | | | | |
| Earnings per share—diluted | | $ | 1.98 | | | $ | 0.82 | | | | | |
| | | | | | | | |
| Weighted average shares of common stock outstanding: | | | | | | | | |
| Basic | | 4,079 | | | 4,056 | | | | | |
| Diluted | | 4,107 | | | 4,096 | | | | | |
See accompanying notes.
| | | | | | | | | | | |
| Financial Statements | Consolidated Condensed Statements of Income | 3 |
| | | | | |
Consolidated Condensed Statements of Comprehensive Income | |
| |
| | | | | | | | | | | | | | | | | | |
| | Three Months Ended | | |
(In Millions; Unaudited) | | Apr 2, 2022 | | Mar 27, 2021 | | | | |
| Net income | | $ | 8,113 | | | $ | 3,361 | | | | | |
| Changes in other comprehensive income, net of tax: | | | | | | | | |
| | | | | | | | |
| | | | | | | | |
| Net unrealized holding gains (losses) on derivatives | | (115) | | | (350) | | | | | |
| Actuarial valuation and other pension benefits (expenses), net | | 18 | | | 13 | | | | | |
| Translation adjustments and other | | (25) | | | (15) | | | | | |
| Other comprehensive income (loss) | | (122) | | | (352) | | | | | |
| Total comprehensive income | | $ | 7,991 | | | $ | 3,009 | | | | | |
See accompanying notes.
| | | | | | | | | | | |
| Financial Statements | Consolidated Condensed Statements of Comprehensive Income | 4 |
| | | | | |
Consolidated Condensed Balance Sheets | |
| |
| | | | | | | | | | | | | | |
(In Millions) | | Apr 2, 2022 | | Dec 25, 2021 |
| | (unaudited) | | |
| Assets | | | | |
| Current assets: | | | | |
| Cash and cash equivalents | | $ | 6,215 | | | $ | 4,827 | |
| Short-term investments | | 32,481 | | | 24,426 | |
| | | | |
| Accounts receivable | | 7,074 | | | 9,457 | |
| Inventories | | 11,935 | | | 10,776 | |
| Assets held for sale | | 236 | | | 6,942 | |
| Other current assets | | 4,627 | | | 2,130 | |
| Total current assets | | 62,568 | | | 58,558 | |
| | | | |
| Property, plant and equipment, net of accumulated depreciation of $87,096 ($85,294 as of December 25, 2021) | | 66,718 | | | 63,245 | |
| Equity investments | | 6,036 | | | 6,298 | |
| | | | |
| Goodwill | | 27,011 | | | 26,963 | |
| Identified intangible assets, net | | 6,813 | | | 7,270 | |
| Other long-term assets | | 7,210 | | | 6,072 | |
| Total assets | | $ | 176,356 | | | $ | 168,406 | |
| | | | |
| Liabilities and stockholders’ equity | | | | |
| Current liabilities: | | | | |
| Short-term debt | | $ | 4,459 | | | $ | 4,591 | |
| Accounts payable | | 7,210 | | | 5,747 | |
| Accrued compensation and benefits | | 2,731 | | | 4,535 | |
| | | | |
| | | | |
| Other accrued liabilities | | 14,922 | | | 12,589 | |
| Total current liabilities | | 29,322 | | | 27,462 | |
| | | | |
| Debt | | 32,788 | | | 33,510 | |
| | | | |
| Income taxes payable | | 4,372 | | | 4,305 | |
| Deferred income taxes | | 1,547 | | | 2,667 | |
| Other long-term liabilities | | 5,191 | | | 5,071 | |
| Contingencies (Note 12) | | | | |
| | | | |
| Stockholders’ equity: | | | | |
| | | | |
| Common stock and capital in excess of par value, 4,089 issued and outstanding (4,070 issued and outstanding as of December 25, 2021) | | 29,244 | | | 28,006 | |
| Accumulated other comprehensive income (loss) | | (1,002) | | | (880) | |
| Retained earnings | | 74,894 | | | 68,265 | |
| Total stockholders’ equity | | 103,136 | | | 95,391 | |
| Total liabilities and stockholders’ equity | | $ | 176,356 | | | $ | 168,406 | |
See accompanying notes.
| | | | | | | | | | | |
| Financial Statements | Consolidated Condensed Balance Sheets | 5 |
| | | | | |
Consolidated Condensed Statements of Cash Flows | |
| |
| | | | | | | | | | | | | | |
| | Three Months Ended |
(In Millions; Unaudited) | | Apr 2, 2022 | | Mar 27, 2021 |
| | | | |
| Cash and cash equivalents, beginning of period | | $ | 4,827 | | | $ | 5,865 | |
| Cash flows provided by (used for) operating activities: | | | | |
| Net income | | 8,113 | | | 3,361 | |
| Adjustments to reconcile net income to net cash provided by operating activities: | | | | |
| Depreciation | | 2,847 | | | 2,454 | |
| Share-based compensation | | 707 | | | 425 | |
| | | | |
| Restructuring and other charges | | 17 | | | 2,209 | |
| Amortization of intangibles | | 501 | | | 448 | |
| (Gains) losses on equity investments, net | | (4,325) | | | (299) | |
| (Gains) losses on divestitures | | (1,121) | | | — | |
| | | | |
| | | | |
| Changes in assets and liabilities: | | | | |
| Accounts receivable | | 2,384 | | | (426) | |
| Inventories | | (1,147) | | | 180 | |
| Accounts payable | | (128) | | | 303 | |
| Accrued compensation and benefits | | (1,884) | | | (1,283) | |
| Prepaid customer supply agreements | | (6) | | | (1,566) | |
| Income taxes | | 1,219 | | | 383 | |
| Other assets and liabilities | | (1,286) | | | (841) | |
| Total adjustments | | (2,222) | | | 1,987 | |
| Net cash provided by operating activities | | 5,891 | | | 5,348 | |
| Cash flows provided by (used for) investing activities: | | | | |
| Additions to property, plant and equipment | | (4,604) | | | (3,972) | |
| Additions to held for sale NAND property, plant and equipment | | (193) | | | (416) | |
| | | | |
| | | | |
| Purchases of short-term investments | | (19,091) | | | (6,574) | |
| Maturities and sales of short-term investments | | 10,490 | | | 8,009 | |
| | | | |
| | | | |
| | | | |
| Sales of equity investments | | 4,682 | | | 86 | |
| | | | |
| | | | |
| | | | |
| Proceeds from divestitures | | 6,544 | | | — | |
| Other investing | | (468) | | | 866 | |
| Net cash used for investing activities | | (2,640) | | | (2,001) | |
| Cash flows provided by (used for) financing activities: | | | | |
| | | | |
| | | | |
| | | | |
| Payments on finance leases | | (299) | | | — | |
| | | | |
| | | | |
| Proceeds from sales of common stock through employee equity incentive plans | | 589 | | | 565 | |
| Repurchase of common stock | | — | | | (2,301) | |
| | | | |
| | | | |
| Payment of dividends to stockholders | | (1,487) | | | (1,411) | |
| | | | |
| | | | |
| | | | |
| Other financing | | (666) | | | (873) | |
| Net cash provided by (used for) financing activities | | (1,863) | | | (4,020) | |
| | | | |
| Net increase (decrease) in cash and cash equivalents | | 1,388 | | | (673) | |
| Cash and cash equivalents, end of period | | $ | 6,215 | | | $ | 5,192 | |
| | | | |
| Supplemental disclosures: | | | | |
| Acquisition of property, plant, and equipment included in accounts payable and accrued liabilities | | $ | 2,949 | | | $ | 2,472 | |
| | | | |
| | | | |
| Cash paid during the period for: | | | | |
| Interest, net of capitalized interest | | $ | 177 | | | $ | 161 | |
| Income taxes, net of refunds | | $ | 335 | | | $ | 172 | |
| | | | |
| | | | |
| | | | |
See accompanying notes.
| | | | | | | | | | | |
| Financial Statements | Consolidated Condensed Statements of Cash Flows | 6 |
| | | | | |
Consolidated Condensed Statements of Stockholders' Equity | |
| |
| | | | | | | | | | | | | | | | | | | | | | | | | | | | | | | | |
| | Common Stock and Capital in Excess of Par Value | | Accumulated Other Comprehensive Income (Loss) | | Retained Earnings1 | | Total |
| (In Millions, Except Per Share Amounts; Unaudited) | | Shares | | Amount | | | |
| Three Months Ended | | | | | | | | | | |
| | | | | | | | | | |
| Balance as of December 25, 2021 | | 4,070 | | | $ | 28,006 | | | $ | (880) | | | $ | 68,265 | | | $ | 95,391 | |
| Net income | | — | | | — | | | — | | | 8,113 | | | 8,113 | |
| Other comprehensive income (loss) | | — | | | — | | | (122) | | | — | | | (122) | |
| Employee equity incentive plans and other | | 20 | | | 589 | | | — | | | — | | | 589 | |
| Share-based compensation | | — | | | 707 | | | — | | | — | | | 707 | |
| | | | | | | | | | |
| | | | | | | | | | |
| | | | | | | | | | |
| Repurchase of common stock | | — | | | — | | | — | | | — | | | — | |
| | | | | | | | | | |
| Restricted stock unit withholdings | | (1) | | | (58) | | | — | | | 3 | | | (55) | |
| Cash dividends declared ($0.37 per share) | | — | | | — | | | — | | | (1,487) | | | (1,487) | |
| Balance as of April 2, 2022 | | 4,089 | | | $ | 29,244 | | | $ | (1,002) | | | $ | 74,894 | | | $ | 103,136 | |
| | | | | | | | | | |
| Balance as of December 26, 2020 | | 4,062 | | | $ | 25,556 | | | $ | (751) | | | $ | 56,268 | | | $ | 81,073 | |
| | | | | | | | | | |
| | | | | | | | | | |
| Net income | | — | | | — | | | — | | | 3,361 | | | 3,361 | |
| Other comprehensive income (loss) | | — | | | — | | | (352) | | | — | | | (352) | |
| Employee equity incentive plans and other | | 17 | | | 565 | | | — | | | — | | | 565 | |
| Share-based compensation | | — | | | 425 | | | — | | | — | | | 425 | |
| Temporary equity reduction | | — | | | — | | | — | | | — | | | — | |
| | | | | | | | | | |
| | | | | | | | | | |
| Repurchase of common stock | | (40) | | | (249) | | | — | | | (2,166) | | | (2,415) | |
| | | | | | | | | | |
| Restricted stock unit withholdings | | (1) | | | (25) | | | — | | | (4) | | | (29) | |
| Cash dividends declared ($0.70 per share) | | — | | | — | | | — | | | (2,821) | | | (2,821) | |
| | | | | | | | | | |
| Balance as of March 27, 2021 | | 4,038 | | | $ | 26,272 | | | $ | (1,103) | | | $ | 54,638 | | | $ | 79,807 | |
| | | | | | | | | | |
| | | | | | | | | | |
| | | | | | | | | | |
| | | | | | | | | | |
| | | | | | | | | | |
| | | | | | | | | | |
| | | | | | | | | | |
| | | | | | | | | | |
| | | | | | | | | | |
| | | | | | | | | | |
| | | | | | | | | | |
| | | | | | | | | | |
| | | | | | | | | | |
| | | | | | | | | | |
| | | | | | | | | | |
| | | | | | | | | | |
| | | | | | | | | | |
| | | | | | | | | | |
| | | | | | | | | | |
| | | | | | | | | | |
| | | | | | | | | | |
| | | | | | | | | | |
| | | | | | | | | | |
| | | | | | | | | | |
| | | | | | | | | | |
| | | | | | | | | | |
| | | | | | | | | | |
| | | | | | | | | | |
| | | | | | | | | | |
1The retained earnings balance as of December 26, 2020 includes an opening balance adjustment made as a result of the adoption of a new accounting standard in 2021.
See accompanying notes.
| | | | | | | | | | | |
| Financial Statements | Consolidated Condensed Statements of Stockholders' Equity | 7 |
| | | | | |
Notes to Consolidated Condensed Financial Statements | |
| |
| | | | | |
| Note 1 : | Basis of Presentation |
We prepared our interim Consolidated Condensed Financial Statements that accompany these notes in conformity with U.S. GAAP, consistent in all material respects with those applied in our 2021 Form 10-K.
We have made estimates and judgments affecting the amounts reported in our Consolidated Condensed Financial Statements and the accompanying notes. The actual results that we experience may differ materially from our estimates. The interim financial information is unaudited, and reflects all normal adjustments that are, in our opinion, necessary to provide a fair statement of results for the interim periods presented. This report should be read in conjunction with the Consolidated Financial Statements in our 2021 Form 10-K where we include additional information about our policies and the methods and assumptions used in our estimates.
In the first quarter of 2022, we reclassified the presentation of cash paid and received under our credit support annex agreements with derivative counterparties within our Consolidated Condensed Statement of Cash Flows. These reclassifications better reflect the economic intent of the credit support annex agreements, and result in changes to amounts previously reported for net cash provided by (used for) operating, investing, and financing activities.
In the first quarter of 2022, we reclassified the presentation of certain marketable debt investments within our Consolidated Condensed Balance Sheets, combining all marketable debt investments with original contractual maturities of three months or more into Short-term investments as they represent the investment of cash available for current operations. These reclassifications simplify our Consolidated Condensed Balance Sheets and result in changes to amounts previously reported as Short-term investments, Trading assets and Other long-term investments.
| | | | | |
| Note 2 : | Operating Segments |
We previously announced several organizational changes that would accelerate the execution and innovation of our Company by allowing us to capture growth in both large traditional markets and high-growth emerging markets. This includes reorganization of our business units to capture this growth and to provide increased transparency, focus and accountability. As a result, we modified our segment reporting in Q1 2021 to align to the previously announced business reorganization. All prior-period segment data has been retrospectively adjusted to reflect the way we internally manage and monitor operating segment performance starting in fiscal year 2022.
We now manage our business through the following operating segments:
▪Client Computing (CCG)
▪Datacenter and AI (DCAI)
▪Network and Edge (NEX)
▪Accelerated Computing Systems and Graphics (AXG)
▪Mobileye
▪Intel Foundry Services (IFS)
We derive a substantial majority of our revenue from our principal products that incorporate various components and technologies, including a microprocessor and chipset, a stand-alone SoC, or a multichip package, which is based on Intel® architecture.
CCG, DCAI and NEX are our reportable operating segments. AXG, Mobileye, and IFS do not meet the quantitative thresholds to qualify as reportable operating segments; however, we have elected to disclose the results of these non-reportable operating segments. AXG revenue includes integrated graphics royalties from our CCG and NEX operating segments and are recorded as if the sales or transfers were to third parties at prices that approximate market-based selling prices. When we enter into federal contracts, they are aligned to the sponsoring operating segment.
We have sales and marketing, manufacturing, engineering, finance, and administration groups. Expenses for these groups are generally allocated to the operating segments.
We have an "all other" category that includes revenue, expenses, and charges such as:
▪historical results of operations from divested businesses;
▪results of operations of start-up businesses that support our initiatives;
▪amounts included within restructuring and other charges;
▪employee benefits, compensation, and other expenses not allocated to the operating segments (beginning the first quarter of 2022, this includes all of our stock-based compensation); and
▪acquisition-related costs, including amortization and any impairment of acquisition-related intangibles and goodwill.
| | | | | | | | | | | |
| Financial Statements | Notes to Financial Statements | 8 |
The CODM, who is our CEO, allocates resources to and assesses the performance of each operating segment using information about the operating segment's revenue and operating income (loss). The CODM does not evaluate operating segments using discrete asset information and we do not identify or allocate assets by operating segments. Based on the interchangeable nature of our manufacturing and assembly and test assets, most of the related depreciation expense is not directly identifiable within our operating segments, as it is included in overhead cost pools and subsequently absorbed into inventory as each product passes through our manufacturing process. Because our products are then sold across multiple operating segments, it is impracticable to determine the total depreciation expense included as a component of each operating segment's operating income (loss) results. We do not allocate gains and losses from equity investments, interest and other income, share-based compensation, or taxes to operating segments. Although the CODM uses operating income to evaluate the segments, operating costs included in one segment may benefit other segments. The accounting policies for segment reporting are the same as for Intel as a whole. There have been no changes to our segment accounting policies disclosed in our 2021 Form 10-K except for the organizational changes and the change in allocation of stock-based compensation expense described above.
Net revenue and operating income (loss) for each period were as follows:
| | | | | | | | | | | | | | | | | | |
| | Three Months Ended | | |
(In Millions) | | Apr 2, 2022 | | Mar 27, 2021 | | | | |
| Operating segment revenue: | | | | | | | | |
| Client Computing | | | | | | | | |
| Desktop | | $ | 2,641 | | | $ | 2,770 | | | | | |
| Notebook | | 5,959 | | | 6,956 | | | | | |
| Other | | 694 | | | 997 | | | | | |
| | 9,294 | | | 10,723 | | | | | |
| | | | | | | | |
| Datacenter and AI | | 6,034 | | | 4,940 | | | | | |
| Network and Edge | | 2,213 | | | 1,799 | | | | | |
| Accelerated Computing Systems and Graphics | | 219 | | 181 | | | | | |
| Mobileye | | 394 | | | 377 | | | | | |
| Intel Foundry Services | | 283 | | | 103 | | | | | |
| All other | | 67 | | | 1,724 | | | | | |
| Total operating segment revenue | | $ | 18,504 | | | $ | 19,847 | | | | | |
| | | | | | | | |
| Operating income (loss): | | | | | | | | |
| Client Computing | | $ | 2,827 | | | $ | 4,288 | | | | | |
| Datacenter and AI | | 1,686 | | | 1,706 | | | | | |
| Network and Edge | | 366 | | | 243 | | | | | |
| Accelerated Computing Systems and Graphics | | (390) | | | (176) | | | | | |
| Mobileye | | 148 | | | 171 | | | | | |
| Intel Foundry Services | | (31) | | | (34) | | | | | |
| All other | | (265) | | | (2,504) | | | | | |
| Total operating income | | $ | 4,341 | | | $ | 3,694 | | | | | |
The following table presents intersegment revenue before eliminations:
| | | | | | | | | | | | | | |
| Total operating segment revenue | | $ | 18,504 | | | $ | 19,847 | |
| | | | |
| Less: Accelerated Computing Systems and Graphics intersegment revenue | | (151) | | | (174) | |
| Total net revenue | | $ | 18,353 | | | $ | 19,673 | |
| | | | | | | | | | | |
| Financial Statements | Notes to Financial Statements | 9 |
| | | | | |
| Note 3 : | Earnings Per Share |
We computed basic earnings per share of common stock based on the weighted average number of shares of common stock outstanding during the period. We computed diluted earnings per share of common stock based on the weighted average number of shares of common stock outstanding plus potentially dilutive shares of common stock outstanding during the period.
| | | | | | | | | | | | | | | | | | |
| | | Three Months Ended | | |
| (In Millions, Except Per Share Amounts) | | Apr 2, 2022 | | Mar 27, 2021 | | | | |
| Net income available to common stockholders | | $ | 8,113 | | | $ | 3,361 | | | | | |
| Weighted average shares of common stock outstanding—basic | | 4,079 | | | 4,056 | | | | | |
| Dilutive effect of employee equity incentive plans | | 28 | | | 40 | | | | | |
| | | | | | | | |
| Weighted average shares of common stock outstanding—diluted | | 4,107 | | | 4,096 | | | | | |
Earnings per share—basic
| | $ | 1.99 | | | $ | 0.83 | | | | | |
Earnings per share—diluted
| | $ | 1.98 | | | $ | 0.82 | | | | | |
Potentially dilutive shares of common stock from employee equity incentive plans are determined by applying the treasury stock method to the assumed exercise of outstanding stock options, the assumed vesting of outstanding RSUs, and the assumed issuance of common stock under the stock purchase plan.
Securities which would have been anti-dilutive are insignificant and are excluded from the computation of diluted earnings per share in all periods presented.
| | | | | |
| Note 4 : | Other Financial Statement Details |
Inventories
| | | | | | | | | | | | | | |
(In Millions) | | Apr 2, 2022 | | Dec 25, 2021 |
Raw materials | | $ | 1,596 | | | $ | 1,441 | |
Work in process | | 6,928 | | | 6,656 | |
Finished goods | | 3,411 | | | 2,679 | |
| Total inventories | | $ | 11,935 | | | $ | 10,776 | |
Interest and Other, Net
| | | | | | | | | | | | | | | | | | |
| | | Three Months Ended | | |
(In Millions) | | Apr 2, 2022 | | Mar 27, 2021 | | | | |
Interest income | | $ | 47 | | | $ | 37 | | | | | |
Interest expense | | (124) | | | (190) | | | | | |
Other, net | | 1,074 | | | (3) | | | | | |
| Total interest and other, net | | $ | 997 | | | $ | (156) | | | | | |
Interest expense in the preceding table is net of $142 million of interest capitalized in the first three months of 2022 ($97 million in the first three months of 2021). Other, net in the first three months of 2022, includes a gain of $1.1 billion resulting from the first closing of the divestiture of our NAND memory business.
| | | | | | | | | | | |
| Financial Statements | Notes to Financial Statements | 10 |
| | | | | |
| Note 5 : | Restructuring and Other Charges |
| | | | | | | | | | | | | | | | | | | |
| | Three Months Ended | | | |
| (In Millions) | | Apr 2, 2022 | | Mar 27, 2021 | | | | | |
| Employee severance and benefit arrangements | | $ | 5 | | | $ | 6 | | | | | | |
| | | | | | | | | |
| Litigation charges and other | | (1,216) | | | 2,203 | | | | | | |
| | | | | | | | | |
| Total restructuring and other charges | | $ | (1,211) | | | $ | 2,209 | | | | | | |
Litigation charges and other includes $1.2 billion in the first quarter of 2022 from the annulled penalty related to an EC fine that was recorded and paid in 2009, and a charge of $2.2 billion in the first quarter of 2021 related to the VLSI litigation. These are recorded as a Corporate benefit and charge, respectively, in the "all other" category presented in "Note 2: Operating Segments" within Notes to Consolidated Condensed Financial Statements. Refer to "Note 12: Contingencies" within Notes to Consolidated Condensed Financial Statements for further information on legal proceedings related to the EC fine and the VLSI litigation.
Short-term Investments
Short-term investments include marketable debt investments in corporate debt, government debt, and financial institution instruments. Government debt includes instruments such as non-U.S. government bonds and U.S. agency securities. Financial institution instruments include instruments issued or managed by financial institutions in various forms, such as commercial paper, fixed- and floating-rate bonds, money market fund deposits, and time deposits. As of April 2, 2022 and December 25, 2021, substantially all time deposits were issued by institutions outside the U.S.
For certain of our marketable debt investments, we economically hedge market risks at inception with a related derivative instrument or the marketable debt investment itself is used to economically hedge currency exchange rate risk from remeasurement. These hedged investments are reported at fair value with gains or losses from the investments and the related derivative instruments recorded in interest and other, net. The fair value of our hedged investments was $26.8 billion as of April 2, 2022 and $21.5 billion as of December 25, 2021. For hedged investments still held at the reporting date, we recorded net losses of $411 million in the first three months of 2022 ($372 million of net losses in the first three months of 2021). Net gains on the related derivatives were $377 million in the first three months of 2022 ($366 million of net gains in the first three months of 2021).
Our remaining unhedged marketable debt investments are reported at fair value, with unrealized gains or losses, net of tax, recorded in accumulated other comprehensive income (loss). The adjusted cost of these investments was $9.8 billion as of April 2, 2022 and $5.0 billion as of December 25, 2021, which approximated the fair value for these periods.
The fair value of marketable debt investments, by contractual maturity, as of April 2, 2022, was as follows:
| | | | | | | | |
(In Millions) | | Fair Value |
Due in 1 year or less | | $ | 26,683 | |
Due in 1–2 years | | 4,103 | |
Due in 2–5 years | | 4,275 | |
Due after 5 years | | 613 | |
Instruments not due at a single maturity date | | 859 | |
| Total | | $ | 36,533 | |
Equity Investments
| | | | | | | | | | | | | | |
(In Millions) | | Apr 2, 2022 | | Dec 25, 2021 |
Marketable equity securities | | $ | 1,764 | | | $ | 2,171 | |
Non-marketable equity securities | | 4,258 | | | 4,111 | |
Equity method investments | | 14 | | | 16 | |
| Total | | $ | 6,036 | | | $ | 6,298 | |
| | | | | | | | | | | |
| Financial Statements | Notes to Financial Statements | 11 |
The components of gains (losses) on equity investments, net for each period were as follows:
| | | | | | | | | | | | | | | | | | | | | | |
| | | Three Months Ended | | | | | |
(In Millions) | | Apr 2, 2022 | | Mar 27, 2021 | | | | | | | | |
Ongoing mark-to-market adjustments on marketable equity securities | | $ | (430) | | | $ | (291) | | | | | | | | | |
Observable price adjustments on non-marketable equity securities | | 71 | | | 551 | | | | | | | | | |
Impairment charges | | (23) | | | (38) | | | | | | | | | |
| Sale of equity investments and other¹ | | 4,705 | | | 146 | | | | | | | | | |
| Total gains (losses) on equity investments, net | | $ | 4,323 | | | $ | 368 | | | | | | | | | |
1 Sale of equity investments and other includes realized gains (losses) on sales of non-marketable equity investments, our share of equity method investees' gains (losses) and distributions, and initial fair value adjustments recorded upon a security becoming marketable.
Gains and losses for our marketable and non-marketable equity securities for each period were as follows:
| | | | | | | | | | | | | | | | | | | |
| | Three Months Ended | | | |
(In Millions) | | Apr 2, 2022 | | Mar 27, 2021 | | | | | |
Net gains (losses) recognized during the period on equity securities | | $ | (244) | | | $ | 311 | | | | | | |
| Less: Net (gains) losses recognized during the period on equity securities sold during the period | | (17) | | | (85) | | | | | | |
| Unrealized gains (losses) recognized during the reporting period on equity securities still held at the reporting date | | $ | (261) | | | $ | 226 | | | | | | |
McAfee Corp.
McAfee Corp. (McAfee) completed its initial public offering in October 2020. Due to our 41% ownership and significant influence as of December 25, 2021, we accounted for it as an equity method investment. We had no accounting carrying value as of December 25, 2021.
In Q1 2022, the sale of McAfee to an investor group was completed. We received $4.6 billion in cash for the sale of our remaining share of McAfee and recognized $4.6 billion of gains in Sale of equity investments and other.
Beijing Unisoc Technology Ltd.
We account for our interest in Beijing Unisoc Technology Ltd. (Unisoc) as a non-marketable equity security. In the first quarter of 2021, we recognized $471 million in observable price adjustments in our investment in Unisoc. As of April 2, 2022 the net book value of the investment is $1.1 billion ($1.1 billion as of December 25, 2021).
| | | | | |
| Note 7 : | Acquisitions and Divestitures |
Acquisitions
Pending acquisition of Tower Semiconductor
During the first quarter of 2022, we entered into a definitive agreement to acquire Tower Semiconductor Ltd. (Tower) in a cash for stock transaction expected to close in twelve months from the date of the agreement. Tower is a leading foundry for analog semiconductor solutions. The acquisition is expected to advance Intel's IDM 2.0 strategy by accelerating our global end-to-end foundry business. Tower will be included in our IFS operating segment. Upon completion of the acquisition, each issued and outstanding ordinary share of Tower will be converted into the right to receive $53.00 per share in cash, representing a total enterprise value of approximately $5.4 billion as of the agreement date. This transaction is subject to certain regulatory approvals and customary closing conditions. If the agreement is terminated under certain circumstances involving the failure to obtain required regulatory approvals, we will be obligated to pay Tower a termination fee of $353 million.
Divestitures
NAND Memory Business
In October 2020, we signed an agreement with SK hynix Inc. (SK hynix) to divest our NAND memory business for $9.0 billion in cash. The NAND memory business includes our NAND memory fabrication facility in Dalian, China and certain related equipment and tangible assets (the Fab Assets), our NAND SSD business (the NAND SSD Business), and our NAND memory technology and manufacturing business (the NAND OpCo Business). The transaction will be completed in two closings.
| | | | | | | | | | | |
| Financial Statements | Notes to Financial Statements | 12 |
The first closing was completed on December 29, 2021. At first closing, SK hynix paid $7.0 billion of consideration, with the remaining $2.0 billion to be received by the second closing of the transaction, expected to be no earlier than March 2025. In connection with the first closing, we recognized a pre-tax gain of $1.1 billion within interest and other, net, and tax expense of $545 million. Based on our ongoing obligation under the NAND wafer manufacturing and sale agreement, $583 million of the first closing consideration was deferred and will be recognized between the first and second closing within interest and other, net.
At the first closing, we sold to SK hynix the Fab Assets and the NAND SSD Business and transferred certain employees, IP, and other assets related to the NAND OpCo Business to separately created wholly owned subsidiaries of Intel. The equity interest of the NAND OpCo Business will transfer to SK hynix at the second closing. In connection with the first closing, we and certain affiliates of SK hynix also entered into a NAND wafer manufacturing and sale agreement, pursuant to which we will manufacture and sell to SK hynix NAND memory wafers to be manufactured using the Fab Assets in Dalian, China until the second closing. We have concluded based on the terms of the transaction agreements that the subsidiaries are variable interest entities for which we are not the primary beneficiary, because the governance structure of these entities does not allow us to direct the activities that would most significantly impact their economic performance. In line with this conclusion, we fully deconsolidated our ongoing interests in the NAND OpCo Business, and recorded receivables for the remaining proceeds of $1.9 billion, a portion of which is short-term and will be paid related to the transfer of inventory for processing under the NAND wafer manufacturing and sale agreement.
The carrying amounts of the major classes of NAND assets as of the first closing date included the following:
| | | | | | | | | | | | | | |
| (In Millions) | | | | Dec 29, 2021 |
| Inventories | | | | $ | 941 | |
| Property, plant and equipment, net | | | | 6,018 | |
| Total sold | | | | $ | 6,959 | |
The wafer manufacturing and sale agreement includes incentives and penalties that are contingent on the cost of operation and output of the NAND OpCo Business. These incentives and penalties present a maximum exposure of up to $500 million annually, and $1.5 billion in the aggregate. We are currently in negotiations with SK hynix to update the operating plan of the NAND OpCo Business in light of the current business environment and projections, which may impact the metrics associated with the incentives and penalties and our expectations of the performance of the NAND OpCo Business against those metrics.
Our transactions with the NAND OpCo Business between the first and second closings are considered related party transactions due to our equity interests and the wafer manufacturing and sales agreement. Related party transactions include certain assets that transferred at first closing between Intel and the NAND OpCo Business, or costs that we incurred on behalf of the NAND OpCo Business, for which we are entitled to be reimbursed. As of April 2, 2022, we have a receivable due to Intel of $787 million recorded within Other current assets on our Consolidated Condensed Balance Sheets. We will be reimbursed for costs of approximately $35 million per quarter for 2022 for corporate function services, which include human resources, information technology, finance, supply chain, and other compliance requirements associated with being wholly owned subsidiaries.
In March 2022, we amended our $5.0 billion variable-rate revolving credit facility agreement, extending the maturity date by one year to March 2027 and transitioning the interest terms from LIBOR to term SOFR. The revolving credit facility had no borrowings outstanding as of April 2, 2022.
We have an ongoing authorization from our Board of Directors to borrow up to $10.0 billion under our commercial paper program.
Our senior floating rate note pays interest quarterly and our senior fixed rate notes pay interest semiannually. We may redeem the fixed rate notes prior to their maturity at our option at specified redemption prices and subject to certain restrictions. The obligations under our notes rank equally in the right of payment with all of our other existing and future senior unsecured indebtedness and effectively rank junior to all liabilities of our subsidiaries.
| | | | | | | | | | | |
| Financial Statements | Notes to Financial Statements | 13 |
Assets and Liabilities Measured and Recorded at Fair Value on a Recurring Basis
| | | | | | | | | | | | | | | | | | | | | | | | | | | | | | | | | | | | | | | | | | | | | | | | | | | | |
| | Apr 2, 2022 | | Dec 25, 2021 | | |
| | Fair Value Measured and Recorded at Reporting Date Using | | | | Fair Value Measured and Recorded at Reporting Date Using | | | | |
(In Millions) | | Level 1 | | Level 2 | | Level 3 | | Total | | Level 1 | | Level 2 | | Level 3 | | Total | | |
Assets | | | | | | | | | | | | | | | | | | |
| Cash equivalents: | | | | | | | | | | | | | | | | | | |
| Corporate debt | | $ | — | | | $ | 1,671 | | | $ | — | | | $ | 1,671 | | | $ | — | | | $ | 65 | | | $ | — | | | $ | 65 | | | |
| Financial institution instruments¹ | | 745 | | | 1,436 | | | — | | | 2,181 | | | 1,216 | | | 763 | | | — | | | 1,979 | | | |
| Government debt² | | 200 | | | — | | | — | | | 200 | | | — | | | — | | | — | | | — | | | |
| Reverse repurchase agreements | | — | | | 1,695 | | | — | | | 1,695 | | | — | | | 1,595 | | | — | | | 1,595 | | | |
| Short-term investments: | | | | | | | | | | | | | | | | | | |
| Corporate debt | | — | | | 7,878 | | | — | | | 7,878 | | | — | | | 6,367 | | | — | | | 6,367 | | | |
| Financial institution instruments¹ | | 114 | | | 7,003 | | | — | | | 7,117 | | | 154 | | | 5,162 | | | — | | | 5,316 | | | |
| Government debt² | | 648 | | | 16,838 | | | — | | | 17,486 | | | 50 | | | 12,693 | | | — | | | 12,743 | | | |
| Other current assets: | | | | | | | | | | | | | | | | | | |
| Derivative assets | | 88 | | | 892 | | | — | | | 980 | | | 80 | | | 576 | | | — | | | 656 | | | |
| Loans receivable³ | | — | | | — | | | — | | | — | | | — | | | 152 | | | — | | | 152 | | | |
Marketable equity securities4 | | 1,694 | | | 70 | | | — | | | 1,764 | | | 1,854 | | | 317 | | | — | | | 2,171 | | | |
| Other long-term assets: | | | | | | | | | | | | | | | | | | |
| Derivative assets | | — | | | 194 | | | — | | | 194 | | | — | | 772 | | | 7 | | | 779 | | | |
| Loans receivable³ | | — | | | 73 | | | — | | | 73 | | | — | | 57 | | | — | | 57 | | | |
| Total assets measured and recorded at fair value | | $ | 3,489 | | | $ | 37,750 | | | $ | — | | | $ | 41,239 | | | $ | 3,354 | | | $ | 28,519 | | | $ | 7 | | | $ | 31,880 | | | |
| Liabilities | | | | | | | | | | | | | | | | | | |
| Other accrued liabilities: | | | | | | | | | | | | | | | | | | |
| Derivative liabilities | | $ | 17 | | | $ | 608 | | | $ | — | | | $ | 625 | | | $ | 4 | | | $ | 516 | | | $ | — | | | $ | 520 | | | |
| | | | | | | | | | | | | | | | | | |
| Other long-term liabilities: | | | | | | | | | | | | | | | | | | |
| Derivative liabilities | | — | | | 104 | | | 22 | | | 126 | | | — | | | 9 | | | — | | | 9 | | | |
| Total liabilities measured and recorded at fair value | | $ | 17 | | | $ | 712 | | | $ | 22 | | | $ | 751 | | | $ | 4 | | | $ | 525 | | | $ | — | | | $ | 529 | | | |
1Level 1 investments consist of money market funds. Level 2 investments consist primarily of commercial paper, certificates of deposit, time deposits, and notes and bonds issued by financial institutions.
2Level 1 investments consist primarily of U.S. Treasury securities. Level 2 investments consist primarily of U.S. agency notes and non-U.S. government debt.
3The fair value of our loans receivable for which we elected the fair value option did not significantly differ from the contractual principal balance.
4 Level 2 investments consist of marketable equity securities subject to security-specific restrictions.
Assets Measured and Recorded at Fair Value on a Non-Recurring Basis
Our non-marketable equity securities, equity method investments, and certain non-financial assets, such as intangible assets and property, plant and equipment, are recorded at fair value only if an impairment or observable price adjustment is recognized in the current period. If an observable price adjustment or impairment is recognized on our non-marketable equity securities during the period, we classify these assets as Level 3.
Financial Instruments Not Recorded at Fair Value on a Recurring Basis
Financial instruments not recorded at fair value on a recurring basis include non-marketable equity securities and equity method investments that have not been remeasured or impaired in the current period, grants receivable, reverse repurchase agreements with original maturities greater than three months, and issued debt.
| | | | | | | | | | | |
| Financial Statements | Notes to Financial Statements | 14 |
We classify the fair value of grants receivable and reverse repurchase agreements with original maturities greater than three months as Level 2. The estimated fair value of these financial instruments approximates their carrying value. The aggregate carrying value of grants receivable as of April 2, 2022 was $335 million (the aggregate carrying value as of December 25, 2021 was $317 million). The aggregate carrying value of reverse repurchase agreements with original maturities greater than three months as of April 2, 2022 was $400 million (the aggregate carrying value as of December 25, 2021 was $0).
We classify the fair value of issued debt (excluding commercial paper, drafts payable, and finance leases) as Level 2. The fair value of our issued debt was $38.1 billion as of April 2, 2022 ($41.5 billion as of December 25, 2021).
| | | | | |
| Note 10 : | Other Comprehensive Income (Loss) |
The changes in accumulated other comprehensive income (loss) by component and related tax effects in the first three months of 2022 were as follows:
| | | | | | | | | | | | | | | | | | | | | | | | | | | | | | |
| (In Millions) | | | | | | Unrealized Holding Gains (Losses) on Derivatives | | Actuarial Valuation and Other Pension Expenses | | Translation Adjustments and Other | | Total |
| Balance as of December 25, 2021 | | | | | | $ | 211 | | | $ | (1,114) | | | $ | 23 | | | $ | (880) | |
| Other comprehensive income (loss) before reclassifications | | | | | | (115) | | | 3 | | | (32) | | | (144) | |
| Amounts reclassified out of accumulated other comprehensive income (loss) | | | | | | (15) | | | 11 | | | — | | | (4) | |
| Tax effects | | | | | | 15 | | | 4 | | | 7 | | | 26 | |
| Other comprehensive income (loss) | | | | | | (115) | | | 18 | | | (25) | | | (122) | |
| Balance as of April 2, 2022 | | | | | | $ | 96 | | | $ | (1,096) | | | $ | (2) | | | $ | (1,002) | |
We estimate that we will reclassify approximately $73 million (before taxes) of net derivative losses included in accumulated other comprehensive income (loss) into earnings within the next 12 months.
| | | | | |
| Note 11 : | Derivative Financial Instruments |
Volume of Derivative Activity
Total gross notional amounts for outstanding derivatives at the end of each period were as follows:
| | | | | | | | | | | | | | | | |
(In Millions) | | Apr 2, 2022 | | Dec 25, 2021 | | |
Foreign currency contracts | | $ | 43,494 | | | $ | 38,024 | | | |
Interest rate contracts | | 15,785 | | | 15,209 | | | |
Other | | 2,317 | | | 2,517 | | | |
| Total | | $ | 61,596 | | | $ | 55,750 | | | |
| | | | | | | | | | | |
| Financial Statements | Notes to Financial Statements | 15 |
Fair Value of Derivative Instruments
| | | | | | | | | | | | | | | | | | | | | | | | | | |
| | Apr 2, 2022 | | Dec 25, 2021 |
(In Millions) | | Assets1 | | Liabilities2 | | Assets1 | | Liabilities2 |
Derivatives designated as hedging instruments: | | | | | | | | |
Foreign currency contracts3 | | $ | 87 | | | $ | 218 | | | $ | 80 | | | $ | 163 | |
Interest rate contracts | | 185 | | | 121 | | | 774 | | | — | |
Total derivatives designated as hedging instruments | | 272 | | | 339 | | | 854 | | | 163 | |
Derivatives not designated as hedging instruments: | | | | | | | | |
Foreign currency contracts3 | | 701 | | | 355 | | | 475 | | | 297 | |
Interest rate contracts | | 113 | | | 39 | | | 26 | | | 65 | |
Equity contracts | | 88 | | | 18 | | | 80 | | | 4 | |
| Total derivatives not designated as hedging instruments | | 902 | | | 412 | | | 581 | | | 366 | |
| Total derivatives | | $ | 1,174 | | | $ | 751 | | | $ | 1,435 | | | $ | 529 | |
1Derivative assets are recorded as other assets, current and non-current.
2Derivative liabilities are recorded as other liabilities, current and non-current.
3The majority of these instruments mature within 12 months.
Amounts Offset in the Consolidated Condensed Balance Sheets
The gross amounts of our derivative instruments and reverse repurchase agreements subject to master netting arrangements with various counterparties, and cash and non-cash collateral posted under such agreements at the end of each period were as follows:
| | | | | | | | | | | | | | | | | | | | | | | | | | | | | | | | | | | | | | |
| | Apr 2, 2022 |
| | | | | | | | Gross Amounts Not Offset in the Balance Sheet | | |
(In Millions) | | Gross Amounts Recognized | | Gross Amounts Offset in the Balance Sheet | | Net Amounts Presented in the Balance Sheet | | Financial Instruments | | Cash and Non-Cash Collateral Received or Pledged | | Net Amount |
Assets: | | | | | | | | | | | | |
| Derivative assets subject to master netting arrangements | | $ | 1,153 | | | $ | — | | | $ | 1,153 | | | $ | (472) | | | $ | (519) | | | $ | 162 | |
Reverse repurchase agreements | | 2,095 | | | — | | | 2,095 | | | — | | | (2,095) | | | — | |
| Total assets | | 3,248 | | | — | | | 3,248 | | | (472) | | | (2,614) | | | 162 | |
| Liabilities: | | | | | | | | | | | | |
| Derivative liabilities subject to master netting arrangements | | 618 | | | — | | | 618 | | | (472) | | | (122) | | | 24 | |
| Total liabilities | | $ | 618 | | | $ | — | | | $ | 618 | | | $ | (472) | | | $ | (122) | | | $ | 24 | |
| | | | | | | | | | | | | | | | | | | | | | | | | | | | | | | | | | | | | | |
| | Dec 25, 2021 |
| | | | | | | | Gross Amounts Not Offset in the Balance Sheet | | |
| (In Millions) | | Gross Amounts Recognized | | Gross Amounts Offset in the Balance Sheet | | Net Amounts Presented in the Balance Sheet | | Financial Instruments | | Cash and Non-Cash Collateral Received or Pledged | | Net Amount |
| Assets: | | | | | | | | | | | | |
| Derivative assets subject to master netting arrangements | | $ | 1,427 | | | $ | — | | | $ | 1,427 | | | $ | (332) | | | $ | (986) | | | $ | 109 | |
| Reverse repurchase agreements | | 1,595 | | | — | | | 1,595 | | | — | | | (1,595) | | | — | |
| Total assets | | 3,022 | | | — | | | 3,022 | | | (332) | | | (2,581) | | | 109 | |
| Liabilities: | | | | | | | | | | | | |
| Derivative liabilities subject to master netting arrangements | | 392 | | | — | | | 392 | | | (332) | | | (60) | | | — | |
| Total liabilities | | $ | 392 | | | $ | — | | | $ | 392 | | | $ | (332) | | | $ | (60) | | | $ | — | |
| | | | | | | | | | | |
| Financial Statements | Notes to Financial Statements | 16 |
We obtain and secure available collateral from counterparties against obligations, including securities lending transactions and reverse repurchase agreements, when we deem it appropriate.
Derivatives in Cash Flow Hedging Relationships
The before-tax net gains or losses attributed to cash flow hedges recognized in other comprehensive income (loss) were $115 million net losses in the first three months of 2022 ($334 million net losses in the first three months of 2021). Substantially all of our cash flow hedges were foreign currency contracts for all periods presented.
During the first three months of 2022 and 2021, the amounts excluded from effectiveness testing were insignificant.
Derivatives in Fair Value Hedging Relationships
The effects of derivative instruments designated as fair value hedges, recognized in interest and other, net for each period were as follows:
| | | | | | | | | | | | | | | | | | | | | | |
| | Gains (Losses) Recognized in Consolidated Condensed Statements of Income on Derivatives |
| | Three Months Ended | | | | |
(In Millions) | | Apr 2, 2022 | | Mar 27, 2021 | | | | | | | | |
Interest rate contracts | | $ | (711) | | | $ | (512) | | | | | | | | | |
Hedged items | | 711 | | | 512 | | | | | | | | | |
| Total | | $ | — | | | $ | — | | | | | | | | | |
The amounts recorded on the Consolidated Condensed Balance Sheets related to cumulative basis adjustments for fair value hedges for each period were as follows:
| | | | | | | | | | | | | | | | | | | | | | | | | | | |
| Line Item in the Consolidated Condensed Balance Sheet in Which the Hedged Item is Included | | Carrying Amount of the Hedged Item Asset/(Liabilities) | | Cumulative Amount of Fair Value Hedging Adjustment Included in the Carrying Amount Assets/(Liabilities) | |
(In Millions) | | Apr 2, 2022 | | Dec 25, 2021 | | Apr 2, 2022 | | Dec 25, 2021 | |
| Long-term debt | | $ | (12,061) | | | $ | (12,772) | | | $ | (64) | | | $ | (775) | | |
The total notional amount of pay-variable and receive-fixed interest rate swaps was $12.0 billion as of April 2, 2022 and as of December 25, 2021.
Derivatives Not Designated as Hedging Instruments
The effects of derivative instruments not designated as hedging instruments on the Consolidated Condensed Statements of Income for each period were as follows:
| | | | | | | | | | | | | | | | | | | | | | | | | | | | |
| | | | Three Months Ended | | | | |
(In Millions) | | Location of Gains (Losses)
Recognized in Income on Derivatives | | Apr 2, 2022 | | Mar 27, 2021 | | | | | | | | |
Foreign currency contracts | | Interest and other, net | | $ | 158 | | | $ | 234 | | | | | | | | | |
Interest rate contracts | | Interest and other, net | | 94 | | | 23 | | | | | | | | | |
Other | | Various | | (134) | | | 55 | | | | | | | | | |
| Total | | | | $ | 118 | | | $ | 312 | | | | | | | | | |
| | | | | | | | | | | |
| Financial Statements | Notes to Financial Statements | 17 |
Legal Proceedings
We are a party to various legal proceedings, including those noted in this section. In the first quarter of 2021, we accrued a charge of $2.2 billion related to litigation involving VLSI, described below. Excluding this charge, management at present believes that the ultimate outcome of these proceedings, individually and in the aggregate, will not materially harm our financial position, results of operations, cash flows, or overall trends; however, legal proceedings and related government investigations are subject to inherent uncertainties, and unfavorable rulings or other events could occur. Unfavorable resolutions could include substantial monetary damages. In addition, in matters for which injunctive relief or other conduct remedies are sought, unfavorable resolutions could include an injunction or other order prohibiting us from selling one or more products at all or in particular ways, precluding particular business practices, or requiring other remedies. An unfavorable outcome may result in a material adverse impact on our business, results of operations, financial position, and overall trends. We might also conclude that settling one or more such matters is in the best interests of our stockholders, employees, and customers, and any such settlement could include substantial payments. Except as specifically described below, we have not concluded that settlement of any of the legal proceedings noted in this section is appropriate at this time.
European Commission Competition Matter
In 2001, the European Commission (EC) commenced an investigation regarding claims by Advanced Micro Devices, Inc. (AMD) that we used unfair business practices to persuade customers to buy our microprocessors. We received numerous requests for information and documents from the EC and we responded to each of those requests. The EC issued a Statement of Objections in July 2007 and held a hearing on that Statement in March 2008. The EC issued a Supplemental Statement of Objections in July 2008. In May 2009, the EC issued a decision finding that we had violated Article 82 of the EC Treaty and Article 54 of the European Economic Area Agreement. In general, the EC found that we violated Article 82 (later renumbered as Article 102 by a new treaty) by offering alleged "conditional rebates and payments" that required our customers to purchase all or most of their x86 microprocessors from us. The EC also found that we violated Article 82 by making alleged "payments to prevent sales of specific rival products." The EC imposed a fine in the amount of €1.1 billion ($1.4 billion as of May 2009), which we subsequently paid during the third quarter of 2009, and ordered us to "immediately bring to an end the infringement referred to in" the EC decision.
The EC decision contained no specific direction on whether or how we should modify our business practices. Instead, the decision stated that we should "cease and desist" from further conduct that, in the EC's opinion, would violate applicable law. We took steps, which are subject to the EC's ongoing review, to comply with that decision pending appeal. We had discussions with the EC to better understand the decision and to explain changes to our business practices.
We appealed the EC decision to the Court of First Instance (which has been renamed the General Court) in July 2009. The hearing of our appeal took place in July 2012. In June 2014, the General Court rejected our appeal in its entirety. In August 2014, we filed an appeal with the European Court of Justice. In November 2014, Intervener Association for Competitive Technologies filed comments in support of Intel’s grounds of appeal. The EC and interveners filed briefs in November 2014, we filed a reply in February 2015, and the EC filed a rejoinder in April 2015. The Court of Justice held oral argument in June 2016. In October 2016, Advocate General Wahl, an advisor to the Court of Justice, issued a non-binding advisory opinion that favored Intel on a number of grounds. The Court of Justice issued its decision in September 2017, setting aside the judgment of the General Court and sending the case back to the General Court to examine whether the rebates at issue were capable of restricting competition. The General Court appointed a panel of five judges to consider our appeal of the EC’s 2009 decision in light of the Court of Justice’s clarifications of the law. In November 2017, the parties filed initial “Observations” about the Court of Justice’s decision and the appeal and were invited by the General Court to offer supplemental comments to each other’s “Observations,” which the parties submitted in March 2018. Responses to other questions posed by the General Court were filed in May and June 2018, and the General Court heard oral argument in March 2020. In January 2022, the General Court issued a decision annulling the EC's findings against Intel regarding rebates as well as the fine imposed on Intel, which was returned to Intel in February 2022. In April 2022, the EC appealed the General Court's decision to the Court of Justice. Given the procedural posture and the nature of this proceeding, including the need to review and assess the claims and arguments made in the appeal, which seeks an order that would require a further proceeding and decision by the General Court, we are unable to make a reasonable estimate of the potential loss or range of losses, if any, that might arise from this matter.
Litigation Related to Security Vulnerabilities
In June 2017, a Google research team (GPZ) notified us and other companies that it had identified security vulnerabilities (now commonly referred to as “Spectre” and “Meltdown”) that affect many types of microprocessors, including our products. As is standard when findings like these are presented, we worked together with other companies in the industry to verify the research and develop and validate software and firmware updates for impacted technologies. On January 2, 2018, information on the security vulnerabilities was publicly reported, before software and firmware updates to address the vulnerabilities were made widely available.
Following various lawsuits that allege a variety of common law and statutory claims, including claims sounding in fraud and unfair trade practices, and in anticipation of defending against those claims, we evaluated the potential impact on our business and operations from the aforesaid litigation and security vulnerabilities. To date, we do not expect a material financial impact on our business or operations.
Numerous lawsuits have been filed against Intel and, in certain cases, our current and former executives and directors, in U.S. federal and state courts and in certain courts in other countries relating to the Spectre and Meltdown security vulnerabilities, as well as other variants of these vulnerabilities that have since been identified.
| | | | | | | | | | | |
| Financial Statements | Notes to Financial Statements | 18 |
As of April 27 2022 , consumer class action lawsuits relating to the above class of security vulnerabilities publicly disclosed since 2018 were pending in the United States, Canada, and Israel. The plaintiffs, who purport to represent various classes of purchasers of our products, generally claim to have been harmed by Intel's actions and/or omissions in connection with the security vulnerabilities and assert a variety of common law and statutory claims seeking monetary damages and equitable relief. In the United States, numerous individual class action suits filed in various jurisdictions were consolidated in April 2018 for all pretrial proceedings in the United States District Court for the District of Oregon. In March 2020, the court granted Intel's motion to dismiss the complaint in that consolidated action but granted plaintiffs leave to amend. In March 2021, the court granted Intel’s motion to dismiss the amended complaint, but granted plaintiffs leave to further amend in part. In January 2022, the court dismissed with prejudice all claims relating to Intel's alleged conduct before September 1, 2017, and otherwise denied Intel's motion to dismiss. In February 2022, Intel moved for reconsideration and/or permission to appeal immediately on the claims that were not dismissed. In Canada, in one case pending in the Superior Court of Justice of Ontario, an initial status conference has not yet been scheduled. In a second case pending in the Superior Court of Justice of Quebec, a stay of the case was in effect until December 2021,and the parties' joint request for a further stay to May 2022 is pending with the court. In Israel, two consumer class action lawsuits were filed in the District Court of Haifa. The plaintiff voluntarily dismissed the first lawsuit in July 2021, Intel filed a motion to stay the second case pending resolution of the consolidated proceeding in the United States, and a hearing on that motion has been scheduled for May 2022. Additional lawsuits and claims may be asserted seeking monetary damages or other related relief. We dispute the pending claims described above and intend to defend those lawsuits vigorously. Given the procedural posture and the nature of those cases, including that the pending proceedings are in the early stages, that alleged damages have not been specified, that uncertainty exists as to the likelihood of a class or classes being certified or the ultimate size of any class or classes if certified, and that there are significant factual and legal issues to be resolved, we are unable to make a reasonable estimate of the potential loss or range of losses, if any, that might arise from those matters.
In addition to these lawsuits, Intel stockholders filed multiple derivative lawsuits since January 2018 against certain current and former members of our Board of Directors and certain current and former officers, alleging that the defendants breached their duties to Intel in connection with the disclosure of the security vulnerabilities and the failure to take action in relation to alleged insider trading. The complaints sought to recover damages from the defendants on behalf of Intel. Some of the derivative actions were filed in the United States District Court for the Northern District of California and were consolidated, and the others were filed in the Superior Court of the State of California in San Mateo County and were consolidated. The federal court granted defendants' motion to dismiss in August 2018 on the ground that plaintiffs failed to plead facts sufficient to show they were excused from making a pre-lawsuit demand on the Board. The federal court granted plaintiffs leave to amend their complaint, but subsequently dismissed the cases in January 2019 at plaintiffs' request. The California Superior Court entered judgment in defendants' favor in August 2020 after granting defendants' motions to dismiss plaintiffs' consolidated complaint and three successive amended complaints, all for failure to plead facts sufficient to show plaintiffs were excused from making a pre-lawsuit demand on the Board. Plaintiffs appealed, and in March 2022 the California Court of Appeal affirmed the judgment of the California Superior Court.
In January 2021, another Intel stockholder filed a derivative lawsuit in the Superior Court in San Mateo County against certain current and former officers and members of our Board of Directors. The lawsuit asserts claims similar to those dismissed in August 2020, except that it alleges that the stockholder made a pre-lawsuit demand on our Board of Directors and that the demand was wrongfully refused. In May 2021, the court granted defendants' motion to stay the action pending the outcome of any litigation plaintiff may choose to file in Delaware where Intel’s bylaws require such claims be filed.
Institute of Microelectronics, Chinese Academy of Sciences v. Intel China, Ltd., et al.
In February 2018, the Institute of Microelectronics of the Chinese Academy of Sciences (IMECAS) sued Intel China, Ltd., Dell China, Ltd., and Beijing Jingdong Century Information Technology, Ltd. (JD) for patent infringement in the Beijing Higher People's Court. IMECAS alleges that Intel®'s Core™ processors infringe Chinese patent CN 102956457 (’457 Patent). The complaint demands an injunction and damages of at least RMB 200,000,000 plus the cost of litigation. Intel is indemnifying Dell and JD. The Beijing Higher People’s Court held a final trial hearing in September 2021. No ruling has been issued. In March 2018, Intel filed an invalidation request on the ‘457 patent with the China National Intellectual Property Administration (CNIPA). The CNIPA held an oral hearing in September 2018 and in February 2019 upheld the validity of the challenged claims. Intel filed a complaint in April 2019 with the Beijing Intellectual Property (IP) Court challenging the February 2019 CNIPA ruling. The Beijing IP Court held oral arguments in July and October 2021 and in November 2021 affirmed the CNIPA ruling. In December 2021, Intel filed an appeal with the Supreme People's Court (SPC) challenging the Beijing IP Court's affirmance of the CNIPA ruling. The SPC has set a hearing on this appeal in April 2022.In January 2020, Intel filed a second invalidation request on the ‘457 patent with the CNIPA, for which the CNIPA heard oral argument in July 2020 and in November 2020 held the challenged apparatus claims invalid. IMECAS filed a complaint in February 2021 with the Beijing IP Court challenging the November 2020 CNIPA ruling. In December 2020, Intel filed a third invalidation request on the ’457 patent with the CNIPA. The CNIPA held an oral hearing in June 2021 and in September 2021 upheld the validity of the challenged claims. Intel filed a complaint in December 2021 with the Beijing IP Court challenging the September 2021 CNIPA ruling. In September 2018 and March 2019, Intel filed petitions with the United States Patent & Trademark Office (USPTO) requesting institution of Inter Partes Review (IPR) of U.S. Patent No. 9,070,719, the U.S. counterpart to the ‘457 patent. The USPTO denied institution of Intel’s petitions in March and October 2019, respectively. In April 2019, Intel filed a request for rehearing and a petition for a Precedential Opinion Panel (POP) in the USPTO to challenge the denial of its first IPR petition, and in November 2019 Intel filed a request for rehearing on the second IPR petition. In January 2020, the USPTO denied the POP petition on the first IPR petition. In June 2020, the Patent Trial and Appeal Board (PTAB) denied Intel's rehearing requests on both petitions.
| | | | | | | | | | | |
| Financial Statements | Notes to Financial Statements | 19 |
In October 2019, IMECAS filed second and third lawsuits, in the Beijing IP Court, alleging infringement of Chinese Patent No. CN 102386226 (‘226 Patent) based on the manufacturing and sale of Intel®'s Core™ i3 microprocessors. Defendants in the second case are Lenovo (Beijing) Co., Ltd. (Lenovo) and Beijing Jiayun Huitong Technology Development Co. Ltd. (BJHT). Defendants in the third case are Intel Corp., Intel China Co., Ltd., the Intel China Beijing Branch, Beijing Digital China Co., Ltd. (Digital China), and Beijing Jingdong Century Information Technology Col., Ltd. (JD). The complaint in the second lawsuit demands an injunction plus litigation costs and reserves the right to claim damages in unspecified amounts. Intel is indemnifying Lenovo in the second lawsuit. The Beijing IP Court held a trial hearing in the second lawsuit in November 2021, but no ruling has been issued. The complaint in the third lawsuit demands an injunction plus litigation costs and claims damages of RMB 10 million. Intel China's jurisdictional challenge in the third lawsuit was denied in June 2021 by the Beijing IP Court and in November 2021 by the Supreme People's Court (SPC). A trial hearing in the third lawsuit was held in January 2022, but no ruling has been issued. In July 2020, Intel and Lenovo filed invalidation requests on the '226 patent with the CNIPA. The CNIPA heard oral arguments in December 2020, during which IMECAS proposed amendments to two claims. In April 2021, the CNIPA upheld the validity of the challenged and amended claims on both invalidation requests. Intel and Lenovo filed complaints in July 2021 with the Beijing IP Court challenging the April 2021 CNIPA rulings; the Beijing IP Court held oral arguments in October 2021.
Given the procedural posture and the nature of these cases, the unspecified nature and extent of damages claimed by IMECAS, and uncertainty regarding the availability of injunctive relief under applicable law, we are unable to make a reasonable estimate of the potential loss or range of losses, if any, arising from these matters. We dispute IMECAS’s claims and intend to vigorously defend against them.
VLSI Technology LLC v. Intel
In October 2017, VLSI Technology LLC (VLSI) filed a complaint against Intel in the U.S. District Court for the Northern District of California alleging infringement of eight patents acquired from NXP Semiconductors, N.V. (NXP). The patents, which originated at Freescale Semiconductor, Inc. and NXP B.V., are U.S. Patent Nos. 7,268,588; 7,675,806; 7,706,207; 7,709,303; 8,004,922; 8,020,014; 8,268,672; and 8,566,836. VLSI accuses various FPGA and processor products of infringement. VLSI estimated its damages to be at least $5.5 billion, and its complaint further sought enhanced damages, future royalties, attorneys’ fees, and costs and interest. In May, June, September, and October 2018, Intel filed IPR petitions challenging the patentability of claims in all eight of the patents in-suit. The PTAB instituted review of six patents and denied institution on two patents. As a result of the institution decisions, the parties stipulated to stay the District Court action in March 2019. In December 2019 and February 2020, the PTAB found all claims of the '588 and '303 patents, and some claims of the '922 patent, to be unpatentable. The PTAB found the challenged claims of the '014, '672, and '207 patents to be patentable. Intel appealed the PTAB's decision as to '014, '672 and '207 patents. The Federal Circuit affirmed the PTAB's decision as to the '672 and '207 patents, but reversed and remanded as to the '014 patent. Intel moved for a continuation of the stay in March 2020 pending the appeal. In June 2020, the District Court issued an order continuing the stay through August 2021. The court lifted the stay in September 2021, and scheduled a trial for March 2024.
In June 2018, VLSI filed a second suit against Intel, in U.S. District Court for the District of Delaware, alleging infringement by various Intel processors of five additional patents acquired from NXP: U.S. Patent Nos. 6,212,663; 7,246,027; 7,247,552; 7,523,331; and 8,081,026. VLSI accused Intel of willful infringement and seeks an injunction or, in the alternative, ongoing royalties, enhanced damages, attorneys’ fees and costs, and interest. In March 2019, the District Court dismissed VLSI’s claims for willful infringement as to all the patents-in-suit except the ‘027 patent, and also dismissed VLSI’s allegations of indirect infringement as to the ‘633, ‘331, and ‘026 patents. In June 2019, Intel filed IPR petitions challenging the patentability of certain claims in all five patents-in-suit. In January 2020, VLSI said that it was no longer asserting any claims of the ‘633 patent. In January and February 2020, the PTAB instituted review of the '552, '633, '331 and '026 patents, but declined to institute review on the '027 patent. As a result, the District Court stayed the case as to the '026 and '552 patents but allowed the case to proceed on the '027 and '331 patents. In January 2021, the PTAB invalidated certain asserted claims of the ‘026 patent, and in February the PTAB invalidated all asserted claims of the ‘552 patent. Both parties filed notices of appeal regarding the PTAB’s decision as to the ‘026 patent in March 2021, and in April 2021, VLSI filed a notice of appeal of the PTAB's decision as to the '552 patent. The case remains stayed as to both of those patents. For the '027 and '331 patents, VLSI is seeking damages of approximately $4.13 billion plus enhanced damages for the '027 patent. Intel filed motions for summary judgment and to exclude testimony from VLSI's expert witnesses, but the court has not yet ruled on these motions or set a trial date.
In March 2019, VLSI filed a third suit against Intel, also in U.S. District Court for the District of Delaware, alleging infringement of six more patents acquired from NXP: U.S. Patent Nos. 6,366,522; 6,663,187; 7,292,485; 7,606,983; 7,725,759; and 7,793,025. In April 2019, VLSI voluntarily dismissed this Delaware case without prejudice. In April 2019, VLSI filed three new infringement suits against Intel in the Western District of Texas (WDTX) accusing various Intel processors of infringement. The three suits collectively assert the same six patents from the voluntarily dismissed Delaware case plus two additional patents acquired from NXP, U.S. Patent Nos. 7,523,373 and 8,156,357. VLSI accuses Intel of willful infringement and seeks an injunction or, in the alternative, ongoing royalties, enhanced damages, attorneys’ fees and costs, and interest. In the first Texas case, VLSI asserted the ‘373 and ‘759 patents (in December 2020 the court granted Intel summary judgment of non-infringement on the ‘357 patent, which had also been asserted in the first Texas case). That case went to trial in February 2021, and the jury awarded a “lump sum” to VLSI of $1.5 billion for literal infringement of the ‘373 patent and $675 million for infringement under the doctrine of equivalents of the ‘759 patent. The jury found that Intel had not willfully infringed either patent. Intel challenged the verdict with post-trial motions, including filing in May 2021 a motion for a new trial, which the court denied in August, a motion for judgment as a matter of law that the ‘373 and ‘759 patents are not infringed and the ‘759 patent is invalid, and a motion that VLSI is entitled to no damages, both of which the court denied in March 2022. The court entered final judgment following the first trial in Texas on April 21, 2022, but the judgement remains under seal.
The second Texas case went to trial in April 2021, and the jury found that Intel does not infringe the ‘522 and ‘187 patents. VLSI had sought approximately $3 billion for alleged infringement of those patents, plus enhanced damages for willful infringement. The court has not yet entered final judgment following second trial in Texas.
| | | | | | | | | | | |
| Financial Statements | Notes to Financial Statements | 20 |
The third Texas case had been set for trial in April 2022 but was cancelled after the first day due to a Covid-19 outbreak. A new trial date has not been set. In that case, VLSI initially sought approximately $2.2 - $2.4 billion for alleged infringement of the ‘983, ‘025 and ‘485 patents, plus enhanced damages for willful infringement. In April 2022, VLSI informed the Court that it would not present an infringement case at trial for the '025 patent. Later in April 2022, VLSI informed the Court that it would not present willful infringement or an infringement case for the '485 patent at trial. This limits VLSI's damages demand to approximately $1 billion for the alleged infringement of the '983 patent. In October and November 2019, and in February 2020, Intel filed IPR petitions on certain asserted claims across six of the patents-in-suit in WDTX. Between May and October 2020, the PTAB denied all of these petitions on a discretionary basis and without reviewing the merits. Intel requested a rehearing, as well as review from the Precedential Opinion Panel (POP) as to all petitions. All requests for POP review and rehearing were denied. Intel filed notices of appeal regarding the discretionary denials for all petitions in February and March of 2021. The Federal Circuit dismissed the appeals in May 2021 for lack of jurisdiction. The Federal Court denied Intel's petition for hearing en banc in August 2021. In March 2022, the Supreme Court denied Intel's petition for writ of certiorari.
In May 2019, VLSI filed a case in Shenzhen Intermediate People’s Court against Intel, Intel (China) Co., Ltd., Intel Trading (Shanghai) Co., Ltd., and Intel Products (Chengdu) Co., Ltd. VLSI asserts Chinese Patent 201410094015.9 accusing certain Intel Core processors of infringement. VLSI requests an injunction as well as RMB 1 million in damages and RMB 300 thousand in expenses. Defendants filed an invalidation petition in October 2019 with the CNIPA, which held a hearing in September 2021. The CNIPA has not yet issued a decision. In May 2020, defendants filed a motion to stay the trial court proceedings pending a determination on invalidity. The court held the first evidentiary hearing in November 2020 and the second in July 2021. The court also held trial proceedings in the hearing in July 2021 and concluded that further trial proceedings were needed but indicated those would be stayed pending the outcome of defendants’ invalidity challenge at the CNIPA. In July 2021, VLSI dismissed its case, but refiled it in August 2021. VLSI seeks an injunction in its newly filed case, as well as RMB 1.3 million in costs and expenses, but no damages. In November 2021, Intel moved for a stay of the August 2021 action pending a ruling on invalidity. The court has not yet ruled on that motion.
In May 2019, VLSI filed a second case in Shanghai Intellectual Property Court against Intel (China) Co., Ltd., Intel Trading (Shanghai) Co., Ltd., and Intel Products (Chengdu) Co., Ltd. VLSI asserts Chinese Patent 201080024173.7. VLSI accuses certain Intel Core processors and seeks an injunction, as well as RMB 1 million in damages and RMB 300 thousand in expenses. Defendants filed with the CNIPA an invalidation petition in October 2019, and the CNIPA held a hearing in September 2021, but has not yet issued a decision. In June 2020, defendants filed a motion to stay the trial court proceedings pending a determination on invalidity. The court held its first evidentiary hearing in September 2020. The court held a second evidentiary hearing in December 2020, and a trial the same month. At trial, VLSI dropped its monetary damages claim, but still requested expenses (RMB 300 thousand) and an injunction. The court has not yet issued a decision following the trial. Rather, the court stayed the case in December 2020 pending a determination on invalidity by the CNIPA. In March 2022, the CNIPA issued an order holding the claims of the patent to be valid.
In November 2019, Intel, along with Apple Inc., filed a complaint against Fortress Investment Group LLC, Fortress Credit Co. LLC, Uniloc 2017 LLC, Uniloc USA, Inc., Uniloc Luxembourg S.A.R.L., VLSI, INVT SPE LLC, Inventergy Global, Inc., DSS Technology Management, Inc., IXI IP, LLC, and Seven Networks, LLC. Plaintiffs allege violations of Section 1 of the Sherman Act by certain defendants, Section 7 of the Clayton Act by certain defendants, and California Business and Professions Code section 17200 by all defendants based on defendants' unlawful aggregation of patents. In 2020 and 2021, the court twice dismissed plaintiffs' complaint with leave to amend. In December 2020, the court granted a joint motion by Apple and Seven Networks to dismiss with prejudice Apple’s claims against Seven Networks. Plaintiffs filed a second amended complaint in March 2021. Defendants moved to dismiss the Second Amended Complaint in May 2021. Apple withdrew from the case and dismissed its claims in June 2021. The court heard defendants’ motion to dismiss the Second Amended Complaint in September 2021, and dismissed Intel’s claims with prejudice that same month, entering judgment in favor of defendants. Intel filed a notice of appeal in December 2021 and filed its opening brief in February 2022.
In June 2020, affiliates controlled by Fortress Investment Group, which also controls VLSI, acquired Finjan Holdings, Inc. Intel had signed a “Settlement, Release and Patent License Agreement” with Finjan in 2012, acquiring a license to the patents of Finjan and its affiliates, current or future, through a capture period of November 20, 2022. The agreement also contains covenants wherein Finjan agrees to cause its affiliates to comply with the agreement. As such, Intel maintains that it now has a license to the patents of VLSI, which has become a Finjan affiliate, and that Finjan must cause VLSI to dismiss its suits against Intel. In August 2020, Intel started dispute resolution proceedings under the agreement. As a part of this dispute resolution process, Intel and Finjan held a mediation in December 2020, but failed to resolve their differences. Intel filed suit to enforce its rights under the License Agreement with Finjan in January 2021 in Delaware Chancery Court. In March 2021, defendants filed motions to dismiss the Chancery Court proceedings. The court heard those motions in May 2021, and dismissed all of Intel’s claims—except the breach of contract claim—with prejudice in September 2021 for lack of jurisdiction because, the court reasoned, Intel’s license defense has been raised in the other U.S. suits between Intel and VLSI and could be adjudicated in one of those actions. The court stayed Intel’s breach of contract claim pending a determination on whether Intel is licensed to VLSI’s patents. In September 2020, Intel filed motions to stay the Texas, Delaware, and Shanghai matters pending resolution of its dispute with Finjan. In November 2020, Intel filed a motion to stay the Shenzhen matter pending resolution of its dispute with Finjan. In November 2020, the Delaware Court denied Intel’s motion to stay. The other stay motions remain pending. Finally, Intel filed a motion to amend its answer in the Texas matters to add a license defense in November 2020, and filed a motion to amend its answer in the Delaware matter to add a license defense in February 2021. The Delaware Court granted Intel's motion in July 2021, but in March 2022, the Texas Court denied Intel's motion, holding, among other things, that it would be futile for Intel to add the license defense as it would not be meritorious.
| | | | | | | | | | | |
| Financial Statements | Notes to Financial Statements | 21 |
In June 2021, OpenSky Industries LLC (OpenSky) requested IPR of certain claims of the '373 and '759 patents, including the ones a jury said Intel infringes. Both petitions copied Intel's earlier petitions, and used the expert declarations previously submitted by Intel. Another entity named Patent Quality Assurance LLC (PQA) also petitioned for IPR of certain claims of the '373 patent, including ones a jury said Intel infringes. PQA also largely copied Intel's petition, but (1) added a challenge to an additional claim and (2) included newly signed declarations from Intel's experts. In December 2021, the PTAB instituted OpenSky's petition on the '759 patent, but declined to institute on the '373 patent. In December 2021, Intel filed a motion to join OpenSky's '759 IPR. That motion remains pending. In January 2022, the PTAB instituted PQA's petition on the '373 patent. In February, Intel filed a motion to join PQA's petition. That motion also remains pending.
After consideration of the verdicts in the WDTX cases and the additional pending lawsuits filed by VLSI, Intel accrued a charge of $2.2 billion in the first quarter of 2021. We dispute VLSI’s claims and intend to vigorously defend against them.
Litigation Related to 7nm Product Delay Announcement
Starting in July 2020, five securities class action lawsuits were filed in the United States District Court for the Northern District of California against Intel and certain current and former officers based on Intel’s July 2020 announcement of 7nm product delays. The plaintiffs, who purport to represent classes of acquirers of Intel stock between October 2019 and July 2020, generally allege that the defendants violated securities laws by making false or misleading statements about the timeline for 7nm products in light of subsequently announced delays. In October 2020, the court consolidated the lawsuits, appointed lead plaintiffs, and in January 2021 the lead plaintiffs filed a consolidated complaint. Defendants moved to dismiss the consolidated complaint in March 2021. We dispute the claims described above and intend to defend the lawsuits vigorously. Given the procedural posture and the nature of those cases, including that the pending proceedings are in the early stages, that alleged damages have not been specified, that uncertainty exists as to the likelihood of a class or classes being certified or the ultimate size of any class or classes if certified, and that there are significant factual and legal issues to be resolved, we are unable to make a reasonable estimate of the potential loss or range of losses, if any, that might arise from those matters. In July 2021, Intel introduced a new process node naming structure, and the 7nm process is now Intel 4.
| | | | | | | | | | | |
| Financial Statements | Notes to Financial Statements | 22 |
We use terms throughout our document that are specific to Intel or that are abbreviations that may not be commonly known or used. Below is a list of these terms used in our document.
| | | | | | | | | | | | | | |
| Term | | Definition |
| | | | |
| | | | |
| | | | |
| | |
| | | | |
| | | | |
| | | | |
| | | | |
| | | | |
| | | | |
| 5G | | The fifth-generation mobile network, which is expected to bring dramatic improvements in network speeds and latency, and which we view as a transformative technology and opportunity for many industries |
| | | | |
| ADAS | | Advanced driver-assistance systems |
| | |
| AI | | Artificial intelligence |
| | | | |
| | |
| ASP | | Average selling price |
| | | | |
| | |
| | | | |
| | | | |
| AXG | | Advanced Computing and Graphics operating segment |
| CCG | | Client Computing Group operating segment |
| | | | |
| | | | |
| | | | |
| CODM | | Chief operating decision maker |
| | | | |
| COVID-19 | | The infectious disease caused by the most recently discovered coronavirus (aka SARS-CoV-2), which was declared a global pandemic by the World Health Organization |
| CPU | | Processor or central processing unit |
| | | | |
| | | | |
| | | | |
| DCAI | | Data Center and AI operating segment |
| EC | | European Commission |
| | | | |
| | | | |
| | | | |
| | | | |
| | | | |
| | | | |
| Form 10-K | | Annual Report on Form 10-K |
| Form 10-Q | | Quarterly Report on Form 10-Q |
| FPGA | | Field-programmable gate array |
| | | | |
| GPU | | Graphics processing unit |
| | | | |
| | | | |
| | | | |
| | | | |
| | |
| | |
| | | | |
| | |
| | | | |
| HPC-AI | | High performance computing for AI |
| IFS | | Intel Foundry Services operating segment |
| | |
| IP | | Intellectual property |
| | | | |
| | | | |
| | | |
| | | | |
| | | | |
| | | | |
| | | | |
| | | | |
| | | | |
| | | | |
| | | | |
| LIBOR | | London Inter-Bank Offered Rate, an interest rate average calculated from estimates by the leading banks in London |
| MBMW | | Multi-Beam Mask Writer |
| MD&A | | Management's Discussion & Analysis |
| | | | |
| MG&A | | Marketing, general and administrative |
| | | | |
| | | | |
| NAND | | NAND flash memory |
| NEX | | Networking and Edge operating segment |
| | |
| nm | | Nanometer |
| | |
| | | | |
| ODM | | Original design manufacturer |
| OEM | | Original equipment manufacturer |
| | | | |
| | | | |
| | | | |
| | | | |
| | | | |
| | |
| | | | |
| | | | |
| | | |
| | | | |
| | | | |
| | | | |
| | | | |
| | | | |
| | |
| | | | |
| | | | |
| | | | |
| | | | |
| | | | |
| | | | |
| | | | |
| R&D | | Research and development |
| | | | |
| | | | |
| | | | |
| RSU | | Restricted stock unit |
| | | | |
| | | | |
| | | | |
| | | | |
| SEC | | U.S. Securities and Exchange Commission |
| | | | |
| SoC | | A System-on-a-Chip, which integrates most of the components of a computer or other electronic system into a single silicon chip. We offer a range of SoC products in CCG, DCAI, and NEX. In our DCAI and NEX businesses, we offer SoCs across many market segments for a variety of applications, including products targeted for 5G base stations and network infrastructure |
| | | | |
| | | | |
| SOFR | | Secured Overnight Financing Rate, a benchmark interest rate for dollar-denominated derivatives and loans, replacing LIBOR |
| SSD | | Solid-state drive |
| TAM | | Total addressable market |
| Tax Reform | | U.S. Tax Cuts and Jobs Act | | |
| | | | |
| | | | |
| | | | |
| | | | |
| | | | |
| | | | |
| | | | |
| U.S. GAAP | | U.S. Generally Accepted Accounting Principles |
| VLSI | | VLSI Technology LLC |
| | | | |
| | | | |
| | | | |
| | | | |
| | | | |
| | | | | | | | | | | |
| Financial Statements | Notes to Financial Statements | 23 |
| | | | | |
| Management's Discussion and Analysis | |
| |
We previously announced several organizational changes that would accelerate the execution and innovation of our Company by allowing us to capture growth in both large traditional markets and high-growth emerging markets. This includes the reorganization of our business units to capture this growth and to provide increased transparency, focus and accountability. As a result, we modified our segment reporting in Q1 2022 to align to the previously announced business reorganization. All prior-period segment data has been retrospectively adjusted to reflect the way we internally manage and monitor segment performance starting in fiscal year 2022. For additional key highlights of our results of operations, see "A Quarter in Review."
Client Computing
We are committed to advancing PC experiences by delivering an annual cadence of leadership products and deepening our relationships with industry partners to co-engineer and deliver leading platform innovation. We focus on long-term operating systems, system architecture, hardware, and application integration that enables industry-leading PC experiences. We intend to embrace these opportunities by investing more heavily in the PC, ramping its capabilities even more aggressively, and designing the PC experience even more deliberately. By doing this, we believe we will continue to fuel innovation across Intel, providing a growing source of IP, scale, and cash flow. | | | | | | | | | | | |
| CCG Revenue $B | | CCG Operating Income $B |
| | | | | | | | | | | | | | |
■ Notebook | ■ Desktop | ■ Other | |
▪Notebook revenue was $6.0 billion, down $997 million from Q1 2021. Notebook unit sales decreased 35% driven by lower demand in the consumer and education market segments following a supply chain inventory digestion cycle compared to COVID-driven highs in Q1 2021, partially offset by an increase in ASPs of 32% due to an increased mix of commercial and consumer products, and lower mix of education.
▪Desktop revenue was $2.6 billion, down $130 million from Q1 2021. Desktop unit sales decreased 11% driven by lower demand in consumer and education market segments, partially offset by an increase in ASPs of 7%, driven by commercial recovery from COVID-19.
▪Other revenue was $694 million, down $303 million primarily driven by the continued ramp down from the exit of our 5G smartphone modem business.
Operating income in Q1 2022 decreased 34% from Q1 2021, with an operating margin of 30%.
| | | | | | | | |
| (In Millions) | | |
| $ | 2,827 | | | Q1 2022 CCG Operating Income |
| (700) | | | Higher desktop and notebook unit cost primarily from increased mix of 10nm SuperFin products |
| (355) | | | Higher operating expenses driven by increased investments in leadership products |
| (340) | | | Higher period charges primarily associated with ramp up of Intel 4 and increased engineering samples |
| | |
| (150) | | | Lower gross margin from revenue, primarily driven by desktop and notebook |
| | |
| | |
| | |
| 84 | | | Other |
| $ | 4,288 | | | Q1 2021 CCG Operating Income |
| | |
| | |
| | |
| | |
| | |
| | |
| | |
| | |
| | |
| | |
| | |
| | |
Datacenter and AI
DCAI delivers workload-optimized platforms to empower datacenter and hyperscale solutions for diverse computing needs. We are focused on delivering the hardware and software portfolio our customers need to support the increased demand for high performance computing and processing of increasingly complex algorithms. DCAI offers a portfolio of leadership products, including CPUs, FPGAs, and AI accelerators, and Intel® persistent memory together with a broad portfolio of software and solutions that enable our hardware’s differentiated features to deliver performance to customers. Our customers and partners include hyperscale customers, OEM/ODMs, enterprises, independent software vendors, system integrators, communications service providers, and governments.
| | | | | | | | | | | |
| DCAI Revenue $B | | DCAI Operating Income $B |
Revenue was $6.0 billion, up $1.1 billion from Q1 2021, primarily driven by an increase in server revenue. Server volume increased 28% due to demand from our hyperscale customer-related products and continued recovery from COVID-driven lows in Q1 2021. This was partially offset by a 3% decrease in server ASPs due to customer and product mix. Other DCAI revenue increased primarily due to growth in our FPGA business.
Operating income in Q1 2022 decreased 1% from Q1 2021, with an operating margin of 28%.
| | | | | | | | |
(In Millions) | | |
| $ | 1,686 | | | Q1 2022 DCAI Operating Income |
| (345) | | | Higher period charges primarily associated with ramp up of Intel 4 |
| (275) | | | Higher operating expenses driven by increased investment in leadership products |
| (155) | | | Higher period charges primarily driven by inventory reserves taken in 2022 |
| (145) | | | Higher server unit cost primarily from increased mix of 10nm SuperFin products |
| 810 | | | Higher gross margin from server revenue |
| 165 | | | Higher gross margin from other DCAI product revenue |
| | |
| (75) | | | Other |
| $ | 1,706 | | | Q1 2021 DCAI Operating Income |
| | |
| | |
| | |
| | |
| | |
| | |
| | |
| | |
| | |
| | |
| | |
| | |
Network & Edge
NEX lifts the world's networks and edge systems from fixed function hardware into open software running on programmable hardware. We work with partners and customers to deliver and deploy intelligent edge platforms that allow software developers to continuously evolve, improve, and tailor systems to gain more control, security, and flexibility. We have a broad portfolio of hardware and software platforms, tools and ecosystem partnerships for the rapid digital transformation happening from edge to cloud. We are leveraging our core strengths in process, manufacturing at scale, and software, to grow traditional markets and to accelerate entry into emerging ones.
| | | | | | | | | | | |
| NEX Revenue $B | | NEX Operating Income $B |
Revenue was $2.2 billion, up $414 million from Q1 2021, driven by increased demand for cloud networking and post-COVID transformation of the edge.
Operating income in Q1 2022 increased 51% from Q1 2021, with an operating margin of 17%.
| | | | | | | | | | |
(In Millions) | | | | |
| $ | 366 | | | Q1 2022 NEX Operating Income | | |
| 290 | | | Higher gross margin from NEX revenue, primarily driven by demand for cloud networking and the edge | | |
| 55 | | | Lower unit cost primarily from increased mix of 10nm SuperFin products | | |
| (195) | | | Higher period charges primarily associated with ramp of Intel 4 | | |
| (105) | | | Higher operating expenses driven by increased investment in leadership products | | |
| | | | |
| | | | |
| 78 | | | Other | | |
| $ | 243 | | | Q1 2021 NEX Operating Income | | |
| | | | |
| | | | |
| | | | |
| | | | |
| | | | |
| | | | |
| | | | |
| | | | |
| | | | |
| | | | |
| | | | |
| | | | |
Accelerated Computing Systems and Graphics
AXG delivers products and technologies designed to help our customers solve the toughest computational problems. Our vision is to enable persistent and immersive computing, at scale, and accessible by billions of people within milliseconds, which drives an incredible demand for compute - from endpoints to data centers.
Our portfolio includes CPUs for high performance computing and GPUs targeted for a range of workloads and platforms from gaming and content creation on client devices to delivering media and gaming in the cloud, and the most demanding HPC and AI workload on supercomputers. To address new market opportunities and emerging workloads, we also develop custom accelerators with blockchain acceleration, as an example.
| | | | | | | | | | | |
| AXG Revenue $B | | AXG Operating Income (Loss) $B |
| | |
Revenue and Operating Income (Loss) Summary |
Revenue was $219 million, up $38 million from Q1 2021. We had an operating loss of $390 million, down $214 million from Q1 2021 due to increased reserves and roadmap investments.
Mobileye
Mobileye is a global leader in driving assistance and self-driving solutions. Our product portfolio covers the entire stack required for assisted and autonomous driving, including compute platforms, computer vision and machine learning-based sensing, mapping and localization, driving policy, and active sensors in development. Mobileye's unique assets in ADAS allow for building a scalable self-driving stack that meets the requirements for both Robotaxi and consumer-level autonomy. Our customers and strategic partners include major global OEMs, Tier 1 automotive system integrators, and public transportation operators.
| | | | | | | | | | | |
| Mobileye Revenue $B | | Mobileye Operating Income $B |
| | |
Revenue and Operating Income Summary |
Mobileye revenue was $394 million, up $17 million from Q1 2021. Operating income was $148 million, down $23 million from Q1 2021.
Intel Foundry Services
IFS seeks to empower our customers by delivering industry-leading silicon and packaging with a differentiated IP portfolio via a secure and sustainable supply of semiconductors. We intend to leverage our decades-long investment in advancing Moore’s Law to spark innovation and customization for our customers on leading edge nodes and mature specialty processes, through support of an open multi-Intel System Architecture ecosystem. Our early customers include traditional fabless customers, cloud service providers, automotive customers and aerospace firms. We offer a combination of leading-edge packaging and process technology, world-class differentiated internal IPs (ex. x86, graphics, AI), broad third party ecosystem and silicon design support. Additionally, our offerings include mask-making equipment for advanced lithography used by most of the world’s leading-edge foundries.
| | | | | | | | | | | |
| IFS Revenue $B | | IFS Operating Income (Loss) $B |
| | |
Revenue and Operating Income (Loss) Summary |
Revenue was $283 million, up $180 million from Q1 2021, driven by higher sales of MBMW tools. We had an operating loss of $31 million, up $3 million from Q1 2021.
| | | | | |
| Consolidated Results of Operations | |
| |
| | | | | | | | | | | | | | | | | | | | | | | | | | | | | | | | | | |
| | Three Months Ended | | |
| | Q1 2022 | | Q1 2021 | | | | |
| (In Millions, Except Per Share Amounts) | | Amount | | % of Net
Revenue | | Amount | | % of Net
Revenue | | | | | | | | |
| Net revenue | | $ | 18,353 | | | 100.0 | % | | $ | 19,673 | | | 100.0 | % | | | | | | | | |
| Cost of sales | | 9,109 | | | 49.6 | % | | 8,819 | | | 44.8 | % | | | | | | | | |
| Gross margin | | 9,244 | | | 50.4 | % | | 10,854 | | | 55.2 | % | | | | | | | | |
| Research and development | | 4,362 | | | 23.8 | % | | 3,623 | | | 18.4 | % | | | | | | | | |
| Marketing, general and administrative | | 1,752 | | | 9.5 | % | | 1,328 | | | 6.8 | % | | | | | | | | |
| Restructuring and other charges | | (1,211) | | | (6.6) | % | | 2,209 | | | 11.2 | % | | | | | | | | |
| Operating income | | 4,341 | | | 23.7 | % | | 3,694 | | | 18.8 | % | | | | | | | | |
| Gains (losses) on equity investments, net | | 4,323 | | | 23.6 | % | | 368 | | | 1.9 | % | | | | | | | | |
| Interest and other, net | | 997 | | | 5.4 | % | | (156) | | | (0.8) | % | | | | | | | | |
| Income before taxes | | 9,661 | | | 52.6 | % | | 3,906 | | | 19.9 | % | | | | | | | | |
| Provision for taxes | | 1,548 | | | 8.4 | % | | 545 | | | 2.8 | % | | | | | | | | |
| Net income | | $ | 8,113 | | | 44.2 | % | | $ | 3,361 | | | 17.1 | % | | | | | | | | |
| | | | | | | | | | | | | | | | |
| Earnings per share—diluted | | $ | 1.98 | | | | | $ | 0.82 | | | | | | | | | | | |
Q1 2022 vs. Q1 2021
Our Q1 2022 revenue was $18.4 billion, down $1.3 billion or 7% from Q1 2021. CCG was down 13% due to lower notebook and desktop volume, partially offset by higher notebook and desktop ASPs, and lower revenue due to the continued ramp down from the exit of our 5G smartphone modem business. Notebook volume declined driven by lower demand in the consumer and education market segments following a supply chain inventory digestion cycle compared to COVID-driven highs in Q1 2021, while desktop demand also declined in consumer and education. DCAI revenue increased 22% on higher server volume due to demand from hyperscale customer-related products and continued recovery from COVID-driven lows in Q1 2021, partially offset by lower server ASPs due to customer and product mix. NEX revenue increased 23% on strong demand for cloud networking and post-COVID transformation of the edge. The decrease in our "all other" revenue reflects revenue of $1.1 billion in Q1 2021 related to the divested NAND memory business for which historical results are recorded in “all other”, and $584 million of revenue recognized in Q1 2021 from a prepaid customer supply customer.
Gross Margin
We derived a substantial majority of our overall gross margin from the sale of products in the CCG and DCAI operating segments. Our overall gross margin dollars in Q1 2022 decreased by $1.6 billion, or 15% compared to Q1 2021.
(Percentages in chart indicate gross margin as a percentage of total revenue)
| | | | | | | | |
| (In Millions) | | |
| $ | 9,244 | | | Q1 2022 Gross Margin |
| (790) | | | Higher unit cost primarily from increased mix of 10nm SuperFin products |
| (880) | | | Higher period charges primarily associated with ramp of Intel 4 |
| (584) | | | Lack of revenue recognized in Q1 2021 from a prepaid customer supply contract |
| (308) | | | Lower gross margin related to the divested NAND memory business |
| (155) | | | Higher period charges primarily driven by inventory reserves taken in 2022 |
| (150) | | | Lower gross margin from revenue, primarily driven by desktop and notebook |
| 1,100 | | | Higher gross margin from Server, cloud networking and the edge |
| | |
| | |
| | |
| | |
| 157 | | | Other |
| $ | 10,854 | | | Q1 2021 Gross Margin |
| | |
| | |
| | |
| | |
| | |
| | |
| | |
| | |
| | |
| | |
| | |
| | |
| | |
Operating Expenses
Total R&D and MG&A expenses for Q1 2022 were $6.1 billion, up 23% from Q1 2021. These expenses represent 33.3% of revenue for Q1 2022 and 25.2% of revenue for Q1 2021.
| | | | | | | | | | | |
| Research and Development $B | | Marketing, General, and Administrative $B |
| |
(Percentages indicate expenses as a percentage of total revenue)
Q1 2022 vs. Q1 2021
| | | | | |
| R&D increased by $739 million, or 20.4%, driven by the following: |
| |
| + | Investments in our process technology |
| + | Investments in our businesses to drive strategic growth |
| + | Increase in corporate spending |
| + | Incentive-based cash compensation |
| |
| | |
Marketing, General, and Administrative |
Q1 2022 vs. Q1 2021
| | | | | |
| MG&A increased by $424 million, or 31.9%, driven by the following: |
| |
| + | Increase in corporate spending |
| + | Incentive-based cash compensation |
| |
| |
| |
Gains (Losses) on Equity Investments and Interest and Other, Net
| | | | | | | | | | | | | | | | | | | | | | |
(In Millions) | | Q1 2022 | | Q1 2021 | | | | | | | | |
| Ongoing mark-to-market adjustments on marketable equity securities | | $ | (430) | | | $ | (291) | | | | | | | | | |
| Observable price adjustments on non-marketable equity securities | | 71 | | | 551 | | | | | | | | | |
| Impairment charges | | (23) | | | (38) | | | | | | | | | |
Sale of equity investments and other | | 4,705 | | | 146 | | | | | | | | | |
| Gains (losses) on equity investments, net | | $ | 4,323 | | | $ | 368 | | | | | | | | | |
| | | | | | | | | | | | |
Interest and other, net | | $ | 997 | | | $ | (156) | | | | | | | | | |
Gains (losses) on equity investments, net
Ongoing mark-to-market adjustments during Q1 2022 and Q1 2021 were primarily related to our interest in Montage Technology, Co. Ltd and others.
In Q1 2021, we recognized $471 million in observable price adjustments in our investment in Beijing Unisoc Technology Ltd.
In Q1 2022 the sale of McAfee to an investor group was completed. We received $4.6 billion in cash for the sale of the remaining share of McAfee and recognized $4.6 billion of gains in Sale of equity investments and other.
Interest and other, net
In Q1 2022, we recognized $997 million, primarily due to a gain of $1.1 billion from the first closing of the divestiture of our NAND memory business.
Restructuring and Other Charges
| | | | | | | | | | | | | | | | | | | |
| (In Millions) | | Q1 2022 | | Q1 2021 | | | | | |
| Employee severance and benefit arrangements | | $ | 5 | | | $ | 6 | | | | | | |
| | | | | | | | | |
| Litigation charges and other | | (1,216) | | | 2,203 | | | | | | |
| | | | | | | | | |
| Total restructuring and other charges | | $ | (1,211) | | | $ | 2,209 | | | | | | |
Litigation charges and other includes $1.2 billion in Q1 2022 from the annulled penalty related to an EC fine that was recorded and paid in 2009, and a charge of $2.2 billion in Q1 2021 related to the VLSI litigation.
Provision for Taxes
| | | | | | | | | | | | | | | | | | |
(In Millions) | | Q1 2022 | | Q1 2021 | | | | |
Income before taxes | | $ | 9,661 | | | $ | 3,906 | | | | | |
Provision for taxes | | $ | 1,548 | | | $ | 545 | | | | | |
Effective tax rate | | 16.0 | % | | 14.0 | % | | | | |
In Q1 2022, our effective tax rate increased primarily due to the equity sale of McAfee and the divestiture of our NAND memory business, partially offset by a change in tax law from 2017 Tax Reform and a higher proportion of our income being taxed in non-U.S. jurisdictions. Beginning in January 2022, Tax Reform changes related to the capitalization of R&D costs derive much of the fluctuation in our results.
Liquidity and Capital Resources
We consider the following when assessing our liquidity and capital resources:
| | | | | | | | | | | | | | |
(In Millions) | | Apr 2, 2022 | | Dec 25, 2021 |
Cash and cash equivalents | | $ | 6,215 | | | $ | 4,827 | |
| Short-term investments | | 32,481 | | | 24,426 | |
| | | | |
| | | | |
| Loans receivable and other | | 500 | | | 240 | |
Total cash and investments1 | | $ | 39,196 | | | $ | 29,493 | |
| | | | |
| | | | |
| Total debt | | $ | 37,247 | | | $ | 38,101 | |
We believe we have sufficient sources of funding to meet our business requirements for the next 12 months and in the longer term. Cash generated by operations, supplemented by our total cash and investments1, as shown in the preceding table, is our primary source of liquidity for funding our strategic business requirements. Our short-term requirements include capital expenditures for worldwide manufacturing and assembly and test, including investments in our process technology roadmap; working capital requirements; and potential acquisitions, strategic investments, and dividends. Our long-term requirements incrementally contemplate additional investments in the significant manufacturing expansion plans we announced as part of our IDM 2.0 strategy and additional investments to accelerate our process technology.
We expect to benefit from government incentives under pending legislation, and any incentives above our current expectations would enable us to increase the pace and size of our IDM 2.0 investments. Conversely, incentives below our expectations would increase our anticipated cash requirements.
In March 2022, we amended our $5.0 billion variable-rate revolving credit facility, extending the maturity date by one year to March 2027 and transitioning the interest terms from LIBOR to term SOFR. Other potential sources of liquidity include our commercial paper program and our automatic shelf registration statement on file with the SEC, pursuant to which we may offer an unspecified amount of debt, equity, and other securities. Under our commercial paper program, we have an ongoing authorization from our Board of Directors to borrow up to $10.0 billion. As of April 2, 2022, we had no outstanding commercial paper or borrowings on the revolving credit facility.
We maintain a diverse investment portfolio that we continually analyze based on issuer, industry, and country. Substantially all of our investments in debt instruments and financing receivables are in investment-grade securities.
| | | | | | | | | | | | | | | | | |
| Cash from Operations $B | | Capital Expenditures $B | | Cash to Stockholders $B |
| | | | | | | | | | | | | | |
| | | | ■ Dividends ■ Dividends ■ Buybacks |
| | | | | | | | | | | | | | |
| | Three Months Ended |
(In Millions) | | Apr 2, 2022 | | Mar 27, 2021 |
| Net cash provided by operating activities | | $ | 5,891 | | | $ | 5,348 | |
Net cash used for investing activities | | (2,640) | | | (2,001) | |
Net cash provided by (used for) financing activities | | (1,863) | | | (4,020) | |
| | | | |
| Net increase (decrease) in cash and cash equivalents | | $ | 1,388 | | | $ | (673) | |
1 See "Non-GAAP Financial Measures" within MD&A.
Operating Activities
Cash provided by operating activities is net income adjusted for certain non-cash items and changes in assets and liabilities.
For the first three months of 2022 compared to the first three months of 2021, the increase in cash provided by operations was primarily driven by a decrease in cash used in net working capital and benefit from the EC fine reversal, offset by lower income after adjusting for non-cash items, including the gain on the sale of McAfee and the pre-tax gain from the divestiture of our NAND business. Net working capital changes were primarily driven by a decrease in accounts receivable and a prepaid customer supply agreement payment in Q1 2021, offset by increases in inventory.
Investing Activities
Investing cash flows consist primarily of capital expenditures, investment purchases, sales, maturities, and disposals, and proceeds from divestitures and cash used for acquisitions.
Cash used for investing activities was higher in the first three months of 2022 compared to the first three months of 2021, primarily driven by increased purchases of short-term investments and capital expenditures, offset by proceeds from the divestiture of our NAND business, proceeds for our remaining share of McAfee, and increased maturities and sales of short-term investments.
Financing Activities
Financing cash flows consist primarily of payment of dividends to stockholders, issuance and repayment of short-term and long-term debt, proceeds from the sale of shares of common stock through employee equity incentive plans, and repurchases of common stock.
Cash used for financing activities was lower in the first three months of 2022 compared to the first three months of 2021 due to our shift away from repurchases of common stock, partially offset by payments on finance leases.
Non-GAAP Financial Measures
In addition to disclosing financial results in accordance with US GAAP, this document contains references to the non-GAAP financial measures below. We believe these non-GAAP financial measures provide investors with useful supplemental information about our operating performance, enable comparison of financial trends and results between periods where certain items may vary independent of business performance, and allow for greater transparency with respect to key metrics used by management in operating our business and measuring our performance. Certain of these non-GAAP financial measures are used in our performance-based RSUs and our annual cash bonus plan.
Starting in the first quarter of 2022, we incrementally exclude from our non-GAAP results, share-based compensation and all gains and losses on equity investments. The adjustment for all gains and losses on equity investments includes the ongoing mark-to-market adjustments previously excluded from our non-GAAP results.
Our non-GAAP financial measures reflect adjustments based on one or more of the following items, as well as the related income tax effects where applicable. Income tax effects have been calculated using an appropriate tax rate for each adjustment. These non-GAAP financial measures should not be considered a substitute for, or superior to, financial measures calculated in accordance with US GAAP, and the financial results calculated in accordance with US GAAP and reconciliations from these results should be carefully evaluated.
| | | | | | | | |
| Non-GAAP adjustment or measure | Definition | Usefulness to management and investors |
| NAND memory business | We completed the first closing of the divestiture of our NAND memory business to SK hynix on December 29, 2021 and fully deconsolidated our ongoing interests in the NAND OpCo Business in the first quarter of 2022. | We exclude the impact of our NAND memory business in certain non-GAAP measures. While the second closing of the sale is still pending and subject to closing conditions, management does not view the historical results of the business as part of the company’s core operations. We believe these adjustments provide investors with a useful view, through the eyes of management, of the company’s core business model and how management currently evaluates core operational performance. In making these adjustments, we have not made any changes to our methods for measuring and calculating revenue or other financial statement amounts. |
| Acquisition-related adjustments | Amortization of acquisition-related intangible assets consists of amortization of intangible assets such as developed technology, brands, and customer relationships acquired in connection with business combinations. Charges related to the amortization of these intangibles are recorded within both cost of sales and MG&A in our US GAAP financial statements. Amortization charges are recorded over the estimated useful life of the related acquired intangible asset, and thus are generally recorded over multiple years. | We exclude amortization charges for our acquisition-related intangible assets for purposes of calculating certain non-GAAP measures because these charges are inconsistent in size and are significantly impacted by the timing and valuation of our acquisitions. These adjustments facilitate a useful evaluation of our current operating performance and comparison to our past operating performance and provide investors with additional means to evaluate cost and expense trends. |
| Restructuring and other charges | Restructuring charges are costs associated with a formal restructuring plan and are primarily related to employee severance and benefit arrangements. Other charges include a benefit in Q1 2022 related to the annulled EC fine, a charge in Q1 2021 related to the VLSI litigation, and periodic goodwill and asset impairments, pension charges, and costs associated with restructuring activity. | We exclude restructuring and other charges, including any adjustments to charges recorded in prior periods, for purposes of calculating certain non-GAAP measures because these costs do not reflect our core operating performance. These adjustments facilitate a useful evaluation of our core operating performance and comparisons to past operating results and provide investors with additional means to evaluate expense trends. |
| | | | | | | | |
| Non-GAAP adjustment or measure | Definition | Usefulness to management and investors |
| Share-based compensation | Share-based compensation consists of charges related to our employee equity incentive plans. | We exclude charges related to share-based compensation for purposes of calculating certain non-GAAP measures because we believe these adjustments provide better comparability to peer company results and because these charges are not viewed by management as part of our core operating performance. We believe these adjustments provide investors with a useful view, through the eyes of management, of the company’s core business model, how management currently evaluates core operational performance, and additional means to evaluate expense trends, including in comparison to other peer companies. |
| Gains (losses) from divestiture | Gains or losses are recognized at the close of a divestiture, or over a specified deferral period when deferred consideration is received at the time of closing. Based on our ongoing obligation under the NAND wafer manufacturing and sale agreement entered into in connection with the first closing of the sale of our NAND memory business on December 29, 2021, a portion of the initial closing consideration was deferred and will be recognized between first and second closing. | We exclude gains or losses resulting from divestitures for purposes of calculating certain non-GAAP measures because they do not reflect our current operating performance. These adjustments facilitate a useful evaluation of our current operating performance and comparisons to past operating results. |
| (Gains) losses on equity investments, net | (Gains) losses on equity investments, net consists of ongoing mark-to-market adjustments on marketable equity securities, observable price adjustments on non-marketable equity securities, impairment charges, and sale of equity investments and other. | We exclude these non-operating earnings for better comparability between periods. The exclusion reflects how management evaluates the core operations of the business. |
| | |
| Tax Reform | Adjustments for Tax Reform reflect the impact of a change in tax law from 2017 Tax Reform related to the capitalization of R&D costs. | We exclude the impacts of this 2022 change in U.S. tax treatment of R&D costs for purposes of calculating certain non-GAAP measures as we believe these adjustments facilitate a better evaluation of our current operating performance and comparison to past operating results. |
| Adjusted free cash flow | We reference a non-GAAP financial measure of adjusted free cash flow, which is used by management when assessing our sources of liquidity, capital resources, and quality of earnings. Adjusted free cash flow is operating cash flow adjusted to exclude 1) additions to property, plant and equipment, net of proceeds from capital grants received, 2) payments on finance leases, and 3) proceeds from the McAfee equity sale. | This non-GAAP financial measure is helpful in understanding our capital requirements and sources of liquidity by providing an additional means to evaluate the cash flow trends of our business. Since the 2017 divestiture, McAfee equity distributions and sales have contributed to operating and free cash flow, and while the McAfee equity sale in Q1 2022 would typically be excluded from adjusted free cash flow as an equity sale, we believe including the sale proceeds in adjusted free cash flow facilitate a better, more consistent comparison to past presentations of liquidity. |
| | |
| Total cash and investments | Total cash and investments is used by management when assessing our sources of liquidity, which includes cash and cash equivalents, short-term investments, and loans receivable and other. | This non-GAAP measure is helpful in understanding our capital resources and liquidity position. |
Following are the reconciliations of our most comparable U.S. GAAP measures to our non-GAAP measures presented:
| | | | | | | | | | | | | | | | | | |
| | Three Months Ended | | |
(In Millions, Except Per Share Amounts) | | Apr 2, 2022 | | Mar 27, 2021 | | | | |
| | | | | | | | |
| | | | | | | | |
| | | | | | | | |
| | | | | | | | |
| | | | | | | | |
| | | | | | | | |
| | | | | | | | |
| Net revenue | | $ | 18,353 | | | $ | 19,673 | | | | | |
| NAND memory business | | — | | | (1,107) | | | | | |
| Non-GAAP net revenue | | $ | 18,353 | | | $ | 18,566 | | | | | |
| | | | | | | | |
| | | | | | | | |
| | | | | | | | |
| | | | | | | | |
| | | | | | | | |
| | | | | | | | |
| | | | | | | | |
| Gross margin percentage | | 50.4 | % | | 55.2 | % | | | | |
| Acquisition-related adjustments | | 1.9 | % | | 1.6 | % | | | | |
| Share-based compensation | | 0.8 | % | | 0.4 | % | | | | |
| NAND memory business | | — | % | | 1.7 | % | | | | |
Non-GAAP gross margin percentage1 | | 53.1 | % | | 58.8 | % | | | | |
| | | | | | | | |
| Operating income | | $ | 4,341 | | | $ | 3,694 | | | | | |
| Acquisition-related adjustments | | 404 | | | 364 | | | | | |
| | | | | | | | |
| | | | | | | | |
| | | | | | | | |
| | | | | | | | |
| Restructuring and other charges | | (1,211) | | | 2,209 | | | | | |
| Share-based compensation | | 707 | | | 425 | | | | | |
| NAND memory business | | — | | | (171) | | | | | |
| Non-GAAP operating income | | $ | 4,241 | | | $ | 6,521 | | | | | |
| | | | | | | | |
| Operating margin | | 23.7 | % | | 18.8 | % | | | | |
| Acquisition-related adjustments | | 2.2 | % | | 1.9 | % | | | | |
| | | | | | | | |
| | | | | | | | |
| | | | | | | | |
| | | | | | | | |
| Restructuring and other charges | | (6.6) | % | | 11.2 | % | | | | |
| Share-based compensation | | 3.9 | % | | 2.2 | % | | | | |
| NAND memory business | | — | % | | 1.0 | % | | | | |
Non-GAAP operating margin1 | | 23.1 | % | | 35.1 | % | | | | |
| | | | | | | | |
| | | | | | | | |
| | | | | | | | |
| | | | | | | | |
| | | | | | | | |
| | | | | | | | |
| | | | | | | | |
| | | | | | | | |
| | | | | | | | |
| | | | | | | | |
| | | | | | | | |
| | | | | | | | |
| | | | | | | | |
| | | | | | | | |
| Earnings per share—diluted | | $ | 1.98 | | | $ | 0.82 | | | | | |
| Acquisition-related adjustments | | 0.10 | | | 0.09 | | | | | |
| | | | | | | | |
| | | | | | | | |
| | | | | | | | |
| Restructuring and other charges | | (0.30) | | | 0.54 | | | | | |
| | | | | | | | |
| Share-based compensation | | 0.17 | | | 0.10 | | | | | |
| (Gains) losses from divestiture | | (0.27) | | | — | | | | | |
| (Gains) losses on equity investments, net | | (1.05) | | | (0.09) | | | | | |
| | | | | | | | |
| NAND memory business | | — | | | (0.04) | | | | | |
| Tax Reform | | (0.09) | | | — | | | | | |
| Income tax effects | | 0.33 | | | (0.08) | | | | | |
| | | | | | | | |
| Non-GAAP earnings per share—diluted | | $ | 0.87 | | | $ | 1.34 | | | | | |
1 Our reconciliation of GAAP to non-GAAP prior year operating and gross margin percentages reflects the exclusion of our NAND memory business from net revenue.
| | | | | | | | | | | | | | |
| | Three Months Ended |
| (In Millions) | | Apr 2, 2022 | | Mar 27, 2021 |
| Net cash provided by operating activities | | $ | 5,891 | | | $ | 5,348 | |
| Net additions to property, plant and equipment | | (4,604) | | | (3,972) | |
| Payments on finance leases | | (299) | | | — | |
| Sale of equity investment | | 4,561 | | | — | |
| Adjusted free cash flow | | $ | 5,549 | | | $ | 1,376 | |
| | | | |
| Net cash used for investing activities | | $ | (2,640) | | | $ | (2,001) | |
| Net cash provided by (used for) financing activities | | $ | (1,863) | | | $ | (4,020) | |
| | | | |
| | | | |
Quantitative and Qualitative Disclosures About Market Risk
We are affected by changes in currency exchange and interest rates, as well as equity and commodity prices. Our risk management programs are designed to reduce, but may not entirely eliminate, the impacts of these risks. For discussion about market risk and sensitivity analysis related to changes in currency exchange rates, interest rates, equity prices, and commodity prices refer to "Quantitative and Qualitative Disclosures About Market Risk" within MD&A in our 2021 Form 10-K.
Risk Factors
The risks described in "Risk Factors" within Other Key Information in our 2021 Form 10-K could materially and adversely affect our business, financial condition, and results of operations, and the trading price of our common stock could decline. We have updated below the risk factor included in our 2021 Form 10-K titled "Global or regional conditions can harm our financial results," which also reflects an update to the allocation of revenues by region. As discussed below, the impact of the war in Ukraine can also exacerbate other risks discussed in the Risk Factors sections of our 2021 Form 10-K and this report, which could in turn have a material adverse effect on us. The Risk Factors section in our 2021 Form 10-K otherwise remains current in all material respects. These risk factors do not identify all risks that we face—our operations could also be affected by factors that are not presently known to us or that we currently consider to be immaterial to our operations. Due to risks and uncertainties, known and unknown, our past financial results may not be a reliable indicator of future performance and historical trends should not be used to anticipate results or trends in future periods. Refer also to the other information set forth in this Form 10-Q, including in the Forward-Looking Statements, MD&A, and Consolidated Condensed Financial Statements and Supplemental Details sections.
Global or regional conditions can harm our financial results. We have manufacturing, assembly and test, R&D, sales, and other operations in many countries, and some of our business activities are concentrated in one or more geographic areas. Moreover, sales outside the US accounted for 86% of our revenue for the fiscal year ended December 25, 2021, with revenue from billings to China contributing 29% of our total revenue. As a result, our operations and our financial results, including our ability to execute our business strategy, manufacture, assemble and test, design, develop, or sell products, and the demand for our products, are at times adversely affected by a number of global and regional factors outside of our control.
Adverse changes in global or regional economic conditions periodically occur, including recession or slowing growth, changes or uncertainty in fiscal, monetary, or trade policy, higher interest rates, tighter credit, inflation, lower capital expenditures by businesses including on IT infrastructure, increases in unemployment, and lower consumer confidence and spending. Adverse changes in economic conditions, including those related to the COVID-19 pandemic, can significantly harm demand for our products and make it more challenging to forecast our operating results and make business decisions, including regarding prioritization of investments in our business. An economic downturn or increased uncertainty may also lead to increased credit and collectability risks, higher borrowing costs or reduced availability of capital and credit markets, reduced liquidity, adverse impacts on our suppliers, failures of counterparties including financial institutions and insurers, asset impairments, and declines in the value of our financial instruments.
We can be adversely affected by other global and regional factors that periodically occur, including:
▪geopolitical and security issues, such as armed conflict and civil or military unrest, political instability, human rights concerns, and terrorist activity, including, for example, geopolitical tensions and conflict affecting Israel, where our Mobileye business headquarters and certain of our fabrication facilities are located;
▪natural disasters, public health issues (including the COVID-19 pandemic), and other catastrophic events;
▪inefficient infrastructure and other disruptions, such as supply chain interruptions, materials shortages or delays, and large-scale outages or unreliable provision of services from utilities, transportation, data hosting, or telecommunications providers;
▪formal or informal imposition of new or revised export, import, or doing-business regulations, including trade sanctions, tariffs, and changes in the ability to obtain export licenses, which could be changed without notice;
▪government restrictions on, or nationalization of, our operations in any country, or restrictions on our ability to repatriate earnings from or distribute compensation or other funds in a particular country;
▪adverse changes relating to government grants, tax credits, or other government incentives, including more favorable incentives provided to competitors;
▪differing employment practices and labor issues, including restricted access to talent;
▪ineffective legal protection of our IP rights in certain countries;
▪local business and cultural factors that differ from our current standards and practices;
▪continuing uncertainty regarding social, political, immigration, and tax and trade policies in the US and abroad; and
▪fluctuations in the market values of our domestic and international investments, and in the capital and credit markets, which can be negatively affected by liquidity, credit deterioration or losses, interest rate changes, financial results, political risk, sovereign risk, or other factors.
For example, Russia and Belarus contributed less than .5% of direct sales to our total revenue for the year ended December 25, 2021. In response to Russia’s war with Ukraine, numerous countries and organizations have imposed financial and other sanctions and export controls against Russia and Belarus, while businesses, including the Company, have limited or suspended Russian operations. Russia has likewise imposed currency restrictions and regulations and may further take retaliatory trade or other actions, including the nationalization of foreign businesses. These and other actions have exposed the Company to the risks described herein; to additional uncertainty and risk regarding increases to supply, commodity, and other costs, damage to our reputation, and cyberattacks; and may increase the likelihood, or amplify the impacts, of other risks, including those highlighted in the Risk Factors section of our 2021 Form 10-K.
We are also subject to risks related to the cessation of US dollar LIBOR. Certain of our derivatives and floating-rate investments reference US dollar LIBOR, and a portion of our indebtedness bears interest at variable interest rates, primarily based on US dollar LIBOR. No new US dollar LIBOR-based activity should be conducted after 2021, and US dollar LIBOR will be unavailable for use in our existing contracts and financial instruments beyond June 30, 2023. While reasonable alternatives to LIBOR have been introduced into markets, our transition from LIBOR to alternative reference rates could result in an increase in our interest expense and/or a reduction in our interest income.
Controls and Procedures
Inherent Limitations on Effectiveness of Controls
Our management, including the principal executive officer and principal financial officer, does not expect that our disclosure controls and procedures or our internal control over financial reporting will prevent or detect all errors and all fraud. A control system, no matter how well-designed and operated, can provide only reasonable, not absolute, assurance that the control system’s objectives will be met. The design of a control system must reflect the fact that there are resource constraints, and the benefits of controls must be considered relative to their costs. Further, because of the inherent limitations in all control systems, no evaluation of controls can provide absolute assurance that misstatements due to error or fraud will not occur or that all control issues and instances of fraud, if any, have been detected.
Evaluation of Disclosure Controls and Procedures
Based on management’s evaluation (with the participation of our principal executive officer and principal financial officer), as of the end of the period covered by this report, our principal executive officer and principal financial officer have concluded that our disclosure controls and procedures (as defined in Rules 13a-15(e) and 15d-15(e) under the Securities Exchange Act of 1934, as amended (the Exchange Act)), are effective to provide reasonable assurance that information required to be disclosed by us in reports that we file or submit under the Exchange Act is recorded, processed, summarized, and reported within the time periods specified in SEC rules and forms, and is accumulated and communicated to management, including our principal executive officer and principal financial officer, as appropriate, to allow timely decisions regarding required disclosure.
Changes in Internal Control Over Financial Reporting
There were no changes to our internal control over financial reporting (as defined in Rules 13a-15(f) and 15d-15(f) under the Exchange Act) that occurred during the quarter ended April 2, 2022 that have materially affected, or are reasonably likely to materially affect, our internal control over financial reporting.
Issuer Purchases of Equity Securities
We have an ongoing authorization, originally approved by our Board of Directors in 2005 and subsequently amended, to repurchase shares of our common stock in open market or negotiated transactions. No shares were repurchased during the quarter ending April 2, 2022. As of April 2, 2022, we were authorized to repurchase up to $110.0 billion, of which $7.2 billion remained available.
We issue RSUs as part of our equity incentive plans. In our Consolidated Condensed Financial Statements, we treat shares of common stock withheld for tax purposes on behalf of our employees in connection with the vesting of RSUs as common stock repurchases because they reduce the number of shares that would have been issued upon vesting. These withheld shares of common stock are not considered common stock repurchases under our authorized common stock repurchase program.
Disclosure Pursuant to Section 13(r) of the Securities Exchange Act of 1934
Section 13(r) of the Exchange Act requires an issuer to disclose certain information in its periodic reports if it or any of its affiliates knowingly engaged in certain activities, transactions or dealings with individuals or entities subject to specific U.S. economic sanctions during the reporting period, even when the activities, transactions, or dealings are conducted in compliance with applicable law. On March 2, 2021, the U.S. Secretary of State designated the Federal Security Service of the Russian Federation (FSB) as a party subject to one such sanction. From time to time, our local subsidiary is required to engage with the FSB as a licensing authority and file documents in order to conduct business within the Russian Federation. All such dealings are explicitly authorized by General License 1B issued by the U.S. Department of the Treasury’s Office of Foreign Assets Control (OFAC), and there are no gross revenues or net profits directly associated with any such dealings by us with the FSB. We plan to continue these activities as required to conduct business in the Russian Federation to the extent permitted by applicable law.
On April 15, 2021, the U.S. Department of the Treasury designated Pozitiv Teknolodzhiz, AO (Positive Technologies), a Russian IT security firm, as a party subject to one of the sanctions specified in Section 13(r). Prior to the designation, we communicated with Positive Technologies regarding its IT security research and coordinated disclosure of security vulnerabilities identified by the firm. Based on a license issued by OFAC, we resumed such communications. There are no gross revenues or net profits directly associated with any such activities. We plan to continue these communications in accordance with the terms and conditions of the OFAC license.
Exhibits
| | | | | | | | | | | | | | | | | | | | | | | | | | | | | | | | | | | | | | |
| | | | | Incorporated by Reference | | |
Exhibit
Number | | Exhibit Description | | Form | | File Number | | Exhibit | | Filing
Date | | Filed or
Furnished
Herewith |
| 3.1 | | | | 8-K | | 000-06217 | | 3.1 | | 5/22/2006 | | |
| 3.2 | | | | 8-K | | 000-06217 | | 3.2 | | 3/16/2021 | | |
10.1† | | | | 8-K | | 000-06217 | | 10.1 | | 1/10/2022 | | |
| 10.2 | | | | | | | | | | | | X |
| 31.1 | | | | | | | | | | | | X |
| 31.2 | | | | | | | | | | | | X |
| | | | | | | | | | | | |
| 32.1 | | | | | | | | | | | | X |
| 101 | | Inline XBRL Document Set for the consolidated condensed financial statements and accompanying notes in Consolidated Condensed Financial Statements and Supplemental Details | | | | | | | | | | X |
| | | | | | | | | | | | |
| | | | | | | | | | | | |
| | | | | | | | | | | | |
| | | | | | | | | | | | |
| | | | | | | | | | | | |
| 104 | | Cover Page Interactive Data File - formatted in Inline XBRL and included as Exhibit 101 | | | | | | | | | | X |
† Management contracts or compensation plans or arrangements in which directors or executive officers are eligible to participate.
Form 10-Q Cross-Reference Index
| | | | | | | | |
| Item Number | Item | |
| Part I - Financial Information | |
| Item 1. | Financial Statements | |
| Item 2. | Management's Discussion and Analysis of Financial Condition and Results of Operations: | |
| Results of operations | |
| Liquidity and capital resources | |
| | |
| Off-balance sheet arrangements | (a) |
| Contractual obligations | |
| Item 3. | Quantitative and Qualitative Disclosures About Market Risk | |
| Item 4. | Controls and Procedures | |
| | |
| Part II - Other Information | |
| Item 1. | Legal Proceedings | |
| Item 1A. | Risk Factors | |
| Item 2. | Unregistered Sales of Equity Securities and Use of Proceeds | |
| Item 3. | Defaults Upon Senior Securities | Not applicable |
| Item 4. | Mine Safety Disclosures | Not applicable |
| Item 5. | Other Information | |
| Disclosure Pursuant to Section 13(r) of the Securities Exchange Act of 1934 | |
| Item 6. | Exhibits | |
| | |
| Signatures | | |
(a) As of April 2, 2022, we did not have any significant off-balance sheet arrangements, as previously defined in Item 303(a)(4)(ii) of SEC Regulation S-K.
Signatures
Pursuant to the requirements of the Securities Exchange Act of 1934, the registrant has duly caused this report to be signed on its behalf by the undersigned thereunto duly authorized.
| | | | | | | | | | | | | | | | | |
| | | INTEL CORPORATION
(Registrant) |
| | | | | |
| Date: | April 28, 2022 | | By: | | /s/ DAVID ZINSNER |
| | | | | David Zinsner |
| | | | | Executive Vice President, Chief Financial Officer, Principal Financial Officer, and Principal Accounting Officer |
| | | | | |
| | | | | |
| | | | | |
| | | | | |