000005086312-27December 27, 20252025FYfalse0.0010.0015050——0.0010.00110,00010,0004,9944,3304,9944,330http://fasb.org/us-gaap/2025#AccountingStandardsUpdate202308Memberthreehttp://fasb.org/us-gaap/2025#CostOfGoodsAndServicesSoldhttp://fasb.org/us-gaap/2025#PropertyPlantAndEquipmentAndFinanceLeaseRightOfUseAssetAfterAccumulatedDepreciationAndAmortizationhttp://fasb.org/us-gaap/2025#PropertyPlantAndEquipmentAndFinanceLeaseRightOfUseAssetAfterAccumulatedDepreciationAndAmortizationhttp://fasb.org/us-gaap/2025#PropertyPlantAndEquipmentAndFinanceLeaseRightOfUseAssetAfterAccumulatedDepreciationAndAmortizationhttp://fasb.org/us-gaap/2025#PropertyPlantAndEquipmentAndFinanceLeaseRightOfUseAssetAfterAccumulatedDepreciationAndAmortizationhttp://fasb.org/us-gaap/2025#CostOfGoodsAndServicesSoldhttp://fasb.org/us-gaap/2025#CostOfGoodsAndServicesSoldhttp://fasb.org/us-gaap/2025#CostOfGoodsAndServicesSoldhttp://fasb.org/us-gaap/2025#CostOfGoodsAndServicesSoldhttp://fasb.org/us-gaap/2025#OtherAssetsCurrenthttp://fasb.org/us-gaap/2025#OtherAssetsCurrenthttp://fasb.org/us-gaap/2025#OtherAssetsNoncurrenthttp://fasb.org/us-gaap/2025#OtherAssetsNoncurrenthttp://fasb.org/us-gaap/2025#RestructuringSettlementAndImpairmentProvisionshttp://fasb.org/us-gaap/2025#RestructuringSettlementAndImpairmentProvisionshttp://fasb.org/us-gaap/2025#RestructuringSettlementAndImpairmentProvisions3.403.704.882.603.753.153.754.881.604.002.455.133.905.002.004.154.005.205.154.602.804.804.255.634.904.104.104.103.733.254.753.054.905.705.603.104.953.205.055.904.105.005.004.005.00http://fasb.org/us-gaap/2025#OtherAssetsCurrenthttp://fasb.org/us-gaap/2025#OtherAssetsCurrenthttp://fasb.org/us-gaap/2025#OtherAssetsNoncurrenthttp://fasb.org/us-gaap/2025#OtherAssetsNoncurrenthttp://fasb.org/us-gaap/2025#OtherLiabilitiesCurrenthttp://fasb.org/us-gaap/2025#OtherLiabilitiesCurrenthttp://fasb.org/us-gaap/2025#OtherLiabilitiesNoncurrenthttp://fasb.org/us-gaap/2025#OtherLiabilitiesNoncurrenthttp://fasb.org/us-gaap/2025#NonoperatingIncomeExpensehttp://fasb.org/us-gaap/2025#NonoperatingIncomeExpensehttp://fasb.org/us-gaap/2025#NonoperatingIncomeExpensehttp://fasb.org/us-gaap/2025#NonoperatingIncomeExpensehttp://fasb.org/us-gaap/2025#NonoperatingIncomeExpensehttp://fasb.org/us-gaap/2025#NonoperatingIncomeExpensehttp://fasb.org/us-gaap/2025#NonoperatingIncomeExpensehttp://fasb.org/us-gaap/2025#NonoperatingIncomeExpensehttp://fasb.org/us-gaap/2025#NonoperatingIncomeExpensehttp://fasb.org/us-gaap/2025#NonoperatingIncomeExpensehttp://fasb.org/us-gaap/2025#NonoperatingIncomeExpensehttp://fasb.org/us-gaap/2025#NonoperatingIncomeExpensehttp://fasb.org/us-gaap/2025#OtherAssetsNoncurrenthttp://fasb.org/us-gaap/2025#OtherAssetsNoncurrentiso4217:USDxbrli:sharesxbrli:pureiso4217:USDxbrli:sharesintc:unitintc:segmentintc:factoryintc:instrumentiso4217:EURintc:patentintc:claimiso4217:CNY00000508632024-12-292025-12-2700000508632025-06-2700000508632026-01-160000050863us-gaap:DisposalGroupDisposedOfBySaleNotDiscontinuedOperationsMemberintc:AlteraMember2025-09-1200000508632025-09-282025-12-2700000508632023-12-312024-12-2800000508632023-01-012023-12-3000000508632025-12-2700000508632024-12-2800000508632023-12-3000000508632022-12-310000050863us-gaap:CommonStockIncludingAdditionalPaidInCapitalMember2022-12-310000050863us-gaap:AccumulatedOtherComprehensiveIncomeMember2022-12-310000050863us-gaap:RetainedEarningsMember2022-12-310000050863us-gaap:NoncontrollingInterestMember2022-12-310000050863us-gaap:RetainedEarningsMember2023-01-012023-12-300000050863us-gaap:NoncontrollingInterestMember2023-01-012023-12-300000050863us-gaap:AccumulatedOtherComprehensiveIncomeMember2023-01-012023-12-300000050863us-gaap:CommonStockIncludingAdditionalPaidInCapitalMember2023-01-012023-12-300000050863us-gaap:CommonStockIncludingAdditionalPaidInCapitalMember2023-12-300000050863us-gaap:AccumulatedOtherComprehensiveIncomeMember2023-12-300000050863us-gaap:RetainedEarningsMember2023-12-300000050863us-gaap:NoncontrollingInterestMember2023-12-300000050863us-gaap:RetainedEarningsMember2023-12-312024-12-280000050863us-gaap:NoncontrollingInterestMember2023-12-312024-12-280000050863us-gaap:AccumulatedOtherComprehensiveIncomeMember2023-12-312024-12-280000050863us-gaap:CommonStockIncludingAdditionalPaidInCapitalMember2023-12-312024-12-280000050863us-gaap:CommonStockIncludingAdditionalPaidInCapitalMember2024-12-280000050863us-gaap:AccumulatedOtherComprehensiveIncomeMember2024-12-280000050863us-gaap:RetainedEarningsMember2024-12-280000050863us-gaap:NoncontrollingInterestMember2024-12-280000050863srt:CumulativeEffectPeriodOfAdoptionAdjustmentMemberus-gaap:RetainedEarningsMember2024-12-280000050863srt:CumulativeEffectPeriodOfAdoptionAdjustmentMember2024-12-280000050863us-gaap:RetainedEarningsMember2024-12-292025-12-270000050863us-gaap:NoncontrollingInterestMember2024-12-292025-12-270000050863us-gaap:AccumulatedOtherComprehensiveIncomeMember2024-12-292025-12-270000050863us-gaap:CommonStockIncludingAdditionalPaidInCapitalMember2024-12-292025-12-270000050863us-gaap:CommonStockIncludingAdditionalPaidInCapitalMember2025-12-270000050863us-gaap:AccumulatedOtherComprehensiveIncomeMember2025-12-270000050863us-gaap:RetainedEarningsMember2025-12-270000050863us-gaap:NoncontrollingInterestMember2025-12-270000050863us-gaap:CapacityMember2024-12-292025-12-270000050863us-gaap:CapacityMember2023-12-312024-12-280000050863us-gaap:CapacityMember2023-01-012023-12-300000050863us-gaap:CreditConcentrationRiskMember2024-12-292025-12-270000050863intc:ThreeLargestCustomersMemberus-gaap:CreditConcentrationRiskMemberus-gaap:AccountsReceivableMember2024-12-292025-12-270000050863us-gaap:OperatingSegmentsMemberintc:AssemblyAndTestMemberintc:IntelFoundryMember2024-12-292025-12-270000050863us-gaap:OperatingSegmentsMemberintc:AssemblyAndTestMemberintc:IntelFoundryMember2023-12-312024-12-280000050863us-gaap:OperatingSegmentsMemberintc:AssemblyAndTestMemberintc:IntelFoundryMember2023-01-012023-12-300000050863us-gaap:OperatingSegmentsMemberintc:ClientComputingGroupMember2024-12-292025-12-270000050863us-gaap:OperatingSegmentsMemberintc:DatacenterAndAIMember2024-12-292025-12-270000050863us-gaap:OperatingSegmentsMemberintc:ClientComputingGroupDatacenterAndAIAndNetworkAndEdgeMember2024-12-292025-12-270000050863us-gaap:OperatingSegmentsMemberintc:IntelFoundryMember2024-12-292025-12-270000050863us-gaap:OperatingSegmentsMemberus-gaap:AllOtherSegmentsMember2024-12-292025-12-270000050863us-gaap:IntersegmentEliminationMember2024-12-292025-12-270000050863us-gaap:CorporateNonSegmentMember2024-12-292025-12-270000050863intc:ClientComputingGroupMember2024-12-292025-12-270000050863intc:DatacenterAndAIMember2024-12-292025-12-270000050863us-gaap:OperatingSegmentsMemberintc:ClientComputingGroupMember2023-12-312024-12-280000050863us-gaap:OperatingSegmentsMemberintc:DatacenterAndAIMember2023-12-312024-12-280000050863us-gaap:OperatingSegmentsMemberintc:ClientComputingGroupDatacenterAndAIAndNetworkAndEdgeMember2023-12-312024-12-280000050863us-gaap:OperatingSegmentsMemberintc:IntelFoundryMember2023-12-312024-12-280000050863us-gaap:OperatingSegmentsMemberus-gaap:AllOtherSegmentsMember2023-12-312024-12-280000050863us-gaap:IntersegmentEliminationMember2023-12-312024-12-280000050863us-gaap:CorporateNonSegmentMember2023-12-312024-12-280000050863intc:ClientComputingGroupMember2023-12-312024-12-280000050863intc:DatacenterAndAIMember2023-12-312024-12-280000050863us-gaap:OperatingSegmentsMemberintc:ClientComputingGroupMember2023-01-012023-12-300000050863us-gaap:OperatingSegmentsMemberintc:DatacenterAndAIMember2023-01-012023-12-300000050863us-gaap:OperatingSegmentsMemberintc:ClientComputingGroupDatacenterAndAIAndNetworkAndEdgeMember2023-01-012023-12-300000050863us-gaap:OperatingSegmentsMemberintc:IntelFoundryMember2023-01-012023-12-300000050863us-gaap:OperatingSegmentsMemberus-gaap:AllOtherSegmentsMember2023-01-012023-12-300000050863us-gaap:IntersegmentEliminationMember2023-01-012023-12-300000050863us-gaap:CorporateNonSegmentMember2023-01-012023-12-300000050863intc:ClientComputingGroupMember2023-01-012023-12-300000050863intc:DatacenterAndAIMember2023-01-012023-12-300000050863intc:DellIncMemberus-gaap:CustomerConcentrationRiskMemberus-gaap:SalesRevenueNetMember2024-12-292025-12-270000050863intc:DellIncMemberus-gaap:CustomerConcentrationRiskMemberus-gaap:SalesRevenueNetMember2023-12-312024-12-280000050863intc:DellIncMemberus-gaap:CustomerConcentrationRiskMemberus-gaap:SalesRevenueNetMember2023-01-012023-12-300000050863intc:LenovoGroupLimitedMemberus-gaap:CustomerConcentrationRiskMemberus-gaap:SalesRevenueNetMember2024-12-292025-12-270000050863intc:LenovoGroupLimitedMemberus-gaap:CustomerConcentrationRiskMemberus-gaap:SalesRevenueNetMember2023-12-312024-12-280000050863intc:LenovoGroupLimitedMemberus-gaap:CustomerConcentrationRiskMemberus-gaap:SalesRevenueNetMember2023-01-012023-12-300000050863intc:HPInc.Memberus-gaap:CustomerConcentrationRiskMemberus-gaap:SalesRevenueNetMember2024-12-292025-12-270000050863intc:HPInc.Memberus-gaap:CustomerConcentrationRiskMemberus-gaap:SalesRevenueNetMember2023-12-312024-12-280000050863intc:HPInc.Memberus-gaap:CustomerConcentrationRiskMemberus-gaap:SalesRevenueNetMember2023-01-012023-12-300000050863intc:ThreeLargestCustomersMemberus-gaap:CustomerConcentrationRiskMemberus-gaap:SalesRevenueNetMember2024-12-292025-12-270000050863intc:ThreeLargestCustomersMemberus-gaap:CustomerConcentrationRiskMemberus-gaap:SalesRevenueNetMember2023-12-312024-12-280000050863intc:ThreeLargestCustomersMemberus-gaap:CustomerConcentrationRiskMemberus-gaap:SalesRevenueNetMember2023-01-012023-12-300000050863country:US2024-12-292025-12-270000050863country:US2023-12-312024-12-280000050863country:US2023-01-012023-12-300000050863intc:ChinaIncludingHongKongMember2024-12-292025-12-270000050863intc:ChinaIncludingHongKongMember2023-12-312024-12-280000050863intc:ChinaIncludingHongKongMember2023-01-012023-12-300000050863country:SG2024-12-292025-12-270000050863country:SG2023-12-312024-12-280000050863country:SG2023-01-012023-12-300000050863country:TW2024-12-292025-12-270000050863country:TW2023-12-312024-12-280000050863country:TW2023-01-012023-12-300000050863intc:OtherCountriesMember2024-12-292025-12-270000050863intc:OtherCountriesMember2023-12-312024-12-280000050863intc:OtherCountriesMember2023-01-012023-12-300000050863intc:IrelandSCIPMember2025-12-270000050863intc:IrelandSCIPMember2024-12-280000050863intc:ArizonaSCIPMember2025-12-270000050863intc:ArizonaSCIPMember2024-12-280000050863intc:MobileyeMember2025-12-270000050863intc:MobileyeMember2024-12-280000050863intc:IMSNanofabricationGmbHIMSMember2025-12-270000050863intc:IMSNanofabricationGmbHIMSMember2024-12-280000050863intc:SubsidiariesIrelandSCIPMember2022-12-310000050863intc:SubsidiariesArizonaSCIPMember2022-12-310000050863intc:SubsidiariesMobileyeMember2022-12-310000050863intc:SubsidiariesIMSNanofabricationGmbHIMSMember2022-12-310000050863intc:SubsidiariesIrelandSCIPMember2023-01-012023-12-300000050863intc:SubsidiariesArizonaSCIPMember2023-01-012023-12-300000050863intc:SubsidiariesMobileyeMember2023-01-012023-12-300000050863intc:SubsidiariesIMSNanofabricationGmbHIMSMember2023-01-012023-12-300000050863intc:SubsidiariesIrelandSCIPMember2023-12-300000050863intc:SubsidiariesArizonaSCIPMember2023-12-300000050863intc:SubsidiariesMobileyeMember2023-12-300000050863intc:SubsidiariesIMSNanofabricationGmbHIMSMember2023-12-300000050863intc:SubsidiariesIrelandSCIPMember2023-12-312024-12-280000050863intc:SubsidiariesArizonaSCIPMember2023-12-312024-12-280000050863intc:SubsidiariesMobileyeMember2023-12-312024-12-280000050863intc:SubsidiariesIMSNanofabricationGmbHIMSMember2023-12-312024-12-280000050863intc:SubsidiariesIrelandSCIPMember2024-12-280000050863intc:SubsidiariesArizonaSCIPMember2024-12-280000050863intc:SubsidiariesMobileyeMember2024-12-280000050863intc:SubsidiariesIMSNanofabricationGmbHIMSMember2024-12-280000050863intc:SubsidiariesIrelandSCIPMember2024-12-292025-12-270000050863intc:SubsidiariesArizonaSCIPMember2024-12-292025-12-270000050863intc:SubsidiariesMobileyeMember2024-12-292025-12-270000050863intc:SubsidiariesIMSNanofabricationGmbHIMSMember2024-12-292025-12-270000050863intc:SubsidiariesIrelandSCIPMember2025-12-270000050863intc:SubsidiariesArizonaSCIPMember2025-12-270000050863intc:SubsidiariesMobileyeMember2025-12-270000050863intc:SubsidiariesIMSNanofabricationGmbHIMSMember2025-12-270000050863intc:IrelandSCIPMember2024-03-312024-06-290000050863intc:SubsidiariesIrelandSCIPMember2024-03-312024-06-290000050863intc:VariableInterestEntityPrimaryBeneficiaryIrelandSCIPMember2024-12-292025-12-270000050863intc:VariableInterestEntityPrimaryBeneficiaryIrelandSCIPMember2025-12-270000050863us-gaap:NondesignatedMemberintc:Fab34Member2023-12-312024-12-280000050863intc:IrelandSCIPArrangementMemberus-gaap:NondesignatedMember2025-12-270000050863intc:IrelandSCIPArrangementMemberus-gaap:NondesignatedMember2024-12-280000050863intc:VariableInterestEntityPrimaryBeneficiaryArizonaSCIPMember2025-12-270000050863us-gaap:AssetPledgedAsCollateralMemberintc:VariableInterestEntityPrimaryBeneficiaryArizonaSCIPMember2025-12-270000050863us-gaap:AssetPledgedAsCollateralMemberintc:VariableInterestEntityPrimaryBeneficiaryArizonaSCIPMember2024-12-280000050863intc:SubsidiariesMobileyeMember2025-07-112025-07-110000050863intc:SubsidiariesMobileyeMember2025-07-110000050863intc:MobileyeMemberintc:SubsidiariesMobileyeMember2025-07-112025-07-110000050863intc:IMSNanofabricationGmbHIMSMember2023-01-012023-12-300000050863us-gaap:PrivatePlacementMember2025-09-262025-09-260000050863us-gaap:PrivatePlacementMember2025-09-260000050863intc:DepartmentOfCommerceMember2025-08-272025-08-2700000508632025-08-222025-08-220000050863intc:DepartmentOfCommerceMember2025-08-222025-08-220000050863intc:DepartmentOfCommerceMember2025-08-270000050863intc:DepartmentOfCommerceMember2025-08-2200000508632025-08-2200000508632025-08-270000050863intc:SharesInEscrowMember2025-12-270000050863intc:ErrorCorrectionClassificationOfGovernmentReceiptsMember2025-09-270000050863intc:SharesInEscrowMemberus-gaap:NondesignatedMember2024-12-292025-12-270000050863intc:DepartmentOfCommerceMember2024-12-292025-12-2700000508632025-08-210000050863us-gaap:PrivatePlacementMember2025-09-152025-09-150000050863us-gaap:PrivatePlacementMember2025-09-150000050863us-gaap:LandAndBuildingMember2025-12-270000050863us-gaap:LandAndBuildingMember2024-12-280000050863us-gaap:MachineryAndEquipmentMember2025-12-270000050863us-gaap:MachineryAndEquipmentMember2024-12-280000050863us-gaap:ConstructionInProgressMember2025-12-270000050863us-gaap:ConstructionInProgressMember2024-12-280000050863srt:MinimumMemberus-gaap:MachineryAndEquipmentMember2025-12-270000050863srt:MaximumMemberus-gaap:MachineryAndEquipmentMember2023-01-010000050863srt:MinimumMemberus-gaap:BuildingMember2025-12-270000050863srt:MaximumMemberus-gaap:BuildingMember2025-12-270000050863intc:ValueOfManufacturingAssetPortfolioMember2024-12-292025-12-270000050863intc:ValueOfManufacturingAssetPortfolioMember2023-12-312024-12-280000050863intc:A2025RestructuringPlanMember2024-12-292025-12-270000050863intc:A2024RestructuringPlanMember2023-12-312024-12-280000050863srt:MinimumMember2025-12-270000050863country:US2025-12-270000050863country:US2024-12-280000050863country:IE2025-12-270000050863country:IE2024-12-280000050863country:IL2025-12-270000050863country:IL2024-12-280000050863intc:OtherCountriesMember2025-12-270000050863intc:OtherCountriesMember2024-12-280000050863srt:MaximumMember2024-12-292025-12-270000050863intc:CapitalRelatedGrantMember2024-12-292025-12-270000050863intc:CapitalRelatedGrantMember2023-12-312024-12-280000050863intc:CapitalRelatedGrantFederalNonCashRefundableAdvancedManufacturingInvestmentTaxCreditMember2024-12-292025-12-270000050863intc:CapitalRelatedGrantFederalNonCashRefundableAdvancedManufacturingInvestmentTaxCreditMember2023-12-312024-12-280000050863intc:CapitalRelatedGrantMember2025-12-270000050863intc:CapitalRelatedGrantMember2024-12-280000050863intc:CapitalRelatedGrantMember2023-01-012023-12-300000050863intc:CapitalRelatedGrantCHIPSActMember2024-12-292025-12-270000050863intc:CapitalRelatedGrantCHIPSActMember2023-12-312024-12-280000050863intc:CapitalRelatedGrantStateMember2024-12-292025-12-270000050863intc:CapitalRelatedGrantStateMember2023-12-312024-12-280000050863intc:CapitalRelatedGrantForeignMember2024-12-292025-12-270000050863intc:CapitalRelatedGrantForeignMember2023-12-312024-12-280000050863intc:OperatingGrantMember2024-12-292025-12-270000050863intc:OperatingGrantMember2023-12-312024-12-280000050863intc:OperatingGrantMember2023-01-012023-12-300000050863srt:MaximumMember2024-09-300000050863srt:MaximumMember2025-06-280000050863intc:OperatingGrantMember2025-12-270000050863intc:OperatingGrantMember2024-12-280000050863intc:CapitalRelatedRefundableTaxCreditsMember2025-12-270000050863intc:CapitalRelatedRefundableTaxCreditsMember2024-12-280000050863intc:SharesInEscrowMember2024-12-292025-12-270000050863intc:SharesInEscrowMember2023-12-312024-12-280000050863intc:SharesInEscrowMember2023-01-012023-12-300000050863intc:AlteraMember2025-09-122025-09-120000050863intc:NANDMemoryBusinessMember2024-12-292025-12-270000050863intc:A2025RestructuringPlanMember2025-12-270000050863intc:A2024RestructuringPlanMember2025-12-270000050863intc:A2022RestructuringProgramMember2025-12-270000050863intc:A2024RestructuringPlanAndOtherActionsMember2024-12-292025-12-270000050863intc:A2025RestructuringPlanMember2022-12-310000050863intc:A2024RestructuringPlanMember2022-12-310000050863intc:A2022RestructuringProgramMember2022-12-310000050863intc:A2025RestructuringPlanMember2023-01-012023-12-300000050863intc:A2024RestructuringPlanMember2023-01-012023-12-300000050863intc:A2022RestructuringProgramMember2023-01-012023-12-300000050863intc:A2025RestructuringPlanMember2023-12-300000050863intc:A2024RestructuringPlanMember2023-12-300000050863intc:A2022RestructuringProgramMember2023-12-300000050863intc:A2025RestructuringPlanMember2023-12-312024-12-280000050863intc:A2022RestructuringProgramMember2023-12-312024-12-280000050863intc:A2025RestructuringPlanMember2024-12-280000050863intc:A2024RestructuringPlanMember2024-12-280000050863intc:A2022RestructuringProgramMember2024-12-280000050863intc:A2024RestructuringPlanMember2024-12-292025-12-270000050863intc:A2022RestructuringProgramMember2024-12-292025-12-270000050863intc:EcFineMember2024-12-292025-12-270000050863intc:R2SemiconductorPatentLitigationMember2023-12-312024-12-280000050863intc:VSLILitigationMember2023-01-012023-12-300000050863intc:TowerSemiconductorLtdMember2023-01-012023-12-300000050863intc:EcFineMember2023-01-012023-12-300000050863intc:A2024RestructuringPlanMemberus-gaap:OtherNoncurrentAssetsMember2023-12-312024-12-280000050863country:CN2024-12-292025-12-270000050863us-gaap:ForeignTaxJurisdictionOtherMember2024-12-292025-12-270000050863country:US2024-12-292025-12-270000050863us-gaap:ValuationAllowanceOfDeferredTaxAssetsMember2024-12-280000050863us-gaap:ValuationAllowanceOfDeferredTaxAssetsMember2023-12-300000050863us-gaap:ValuationAllowanceOfDeferredTaxAssetsMember2022-12-310000050863us-gaap:ValuationAllowanceOfDeferredTaxAssetsMember2024-12-292025-12-270000050863us-gaap:ValuationAllowanceOfDeferredTaxAssetsMember2023-12-312024-12-280000050863us-gaap:ValuationAllowanceOfDeferredTaxAssetsMember2023-01-012023-12-300000050863us-gaap:ValuationAllowanceOfDeferredTaxAssetsMember2025-12-270000050863us-gaap:DomesticCountryMember2025-12-270000050863us-gaap:ForeignCountryMember2025-12-270000050863country:IL2024-12-292025-12-270000050863us-gaap:AvailableforsaleSecuritiesMember2025-12-270000050863us-gaap:AvailableforsaleSecuritiesMember2024-12-280000050863intc:SingleInvesteeMember2024-12-292025-12-270000050863intc:AlteraMember2025-09-270000050863intc:AlteraMember2025-12-270000050863us-gaap:DisposalGroupDisposedOfBySaleNotDiscontinuedOperationsMemberintc:AlteraMember2025-09-122025-09-120000050863us-gaap:DisposalGroupDisposedOfBySaleNotDiscontinuedOperationsMemberintc:AlteraMember2025-09-132025-09-270000050863us-gaap:DisposalGroupDisposedOfBySaleNotDiscontinuedOperationsMemberintc:AlteraMembersrt:ScenarioForecastMember2025-09-132027-12-310000050863us-gaap:DisposalGroupDisposedOfBySaleNotDiscontinuedOperationsMemberintc:AlteraMember2025-12-270000050863intc:SilverLakePartnersMember2025-12-270000050863intc:AlteraMember2025-09-120000050863intc:AlteraMember2025-09-122025-09-120000050863us-gaap:DisposalGroupDisposedOfBySaleNotDiscontinuedOperationsMemberintc:AlteraMember2024-12-292025-12-270000050863intc:NANDMemoryBusinessMember2025-03-272025-03-270000050863intc:MenteeRoboticsMemberus-gaap:SubsequentEventMember2026-01-052026-01-050000050863intc:ClientComputingGroupMember2024-12-280000050863intc:ClientComputingGroupMember2025-12-270000050863intc:DatacenterAndAIMember2024-12-280000050863intc:DatacenterAndAIMember2025-12-270000050863intc:NetworkAndEdgeMember2024-12-280000050863intc:NetworkAndEdgeMember2024-12-292025-12-270000050863intc:NetworkAndEdgeMember2025-12-270000050863intc:MobileyeMember2024-12-280000050863intc:MobileyeMember2024-12-292025-12-270000050863intc:MobileyeMember2025-12-270000050863intc:AlteraMember2024-12-280000050863intc:AlteraMember2024-12-292025-12-270000050863intc:AlteraMember2025-12-270000050863us-gaap:AllOtherSegmentsMember2024-12-280000050863us-gaap:AllOtherSegmentsMember2024-12-292025-12-270000050863us-gaap:AllOtherSegmentsMember2025-12-270000050863intc:ClientComputingGroupMember2023-12-300000050863intc:DatacenterAndAIMember2023-12-300000050863intc:NetworkAndEdgeMember2023-12-300000050863intc:NetworkAndEdgeMember2023-12-312024-12-280000050863intc:IntelFoundryMember2023-12-300000050863intc:IntelFoundryMember2023-12-312024-12-280000050863intc:IntelFoundryMember2024-12-280000050863intc:MobileyeMember2023-12-300000050863intc:MobileyeMember2023-12-312024-12-280000050863intc:AlteraMember2023-12-300000050863intc:AlteraMember2023-12-312024-12-280000050863us-gaap:AllOtherSegmentsMember2023-12-300000050863us-gaap:AllOtherSegmentsMember2023-12-312024-12-280000050863intc:NetworkAndEdgeMember2024-12-292025-03-290000050863intc:ClientComputingGroupMember2024-12-292025-03-290000050863intc:DatacenterAndAIMember2024-12-292025-03-2900000508632024-06-302024-09-280000050863us-gaap:MeasurementInputDiscountRateMember2024-06-302024-09-2800000508632023-12-312024-03-300000050863intc:MobileyeMember2025-12-270000050863intc:ClientComputingGroupMember2025-12-270000050863intc:DatacenterAndAIMember2025-12-270000050863us-gaap:DevelopedTechnologyRightsMember2025-12-270000050863us-gaap:DevelopedTechnologyRightsMember2024-12-280000050863us-gaap:CustomerRelationshipsMember2025-12-270000050863us-gaap:CustomerRelationshipsMember2024-12-280000050863intc:LicensedTechnologyAndPatentsMember2025-12-270000050863intc:LicensedTechnologyAndPatentsMember2024-12-280000050863intc:LicensedTechnologyAndPatentsMember2024-12-292025-12-270000050863intc:LicensedTechnologyAndPatentsMember2023-12-312024-12-280000050863us-gaap:DevelopedTechnologyRightsMember2024-12-292025-12-270000050863us-gaap:DevelopedTechnologyRightsMember2023-12-312024-12-280000050863us-gaap:DevelopedTechnologyRightsMember2023-01-012023-12-300000050863us-gaap:CustomerRelationshipsMember2024-12-292025-12-270000050863us-gaap:CustomerRelationshipsMember2023-12-312024-12-280000050863us-gaap:CustomerRelationshipsMember2023-01-012023-12-300000050863intc:LicensedTechnologyAndPatentsMember2023-01-012023-12-300000050863us-gaap:CommercialPaperMember2025-12-270000050863intc:FixedRateSeniorNotes340DueMarch2025Member2025-12-270000050863intc:FixedRateSeniorNotes340DueMarch2025Member2024-12-280000050863intc:DebtInstrumentSixteenMember2025-12-270000050863intc:DebtInstrumentSixteenMember2024-12-280000050863intc:FixedRateSeniorNotes4Point88PercentDueFebruary2026Member2025-12-270000050863intc:FixedRateSeniorNotes4Point88PercentDueFebruary2026Member2024-12-280000050863intc:DebtInstrumentThirtyTwoMember2025-12-270000050863intc:DebtInstrumentThirtyTwoMember2024-12-280000050863intc:FixedRateSeniorNotes375DueMarch2027Member2025-12-270000050863intc:FixedRateSeniorNotes375DueMarch2027Member2024-12-280000050863intc:DebtInstrumentFortyTwoMember2025-12-270000050863intc:DebtInstrumentFortyTwoMember2024-12-280000050863intc:FixedRateSeniorNotes375DueAugust2027Member2025-12-270000050863intc:FixedRateSeniorNotes375DueAugust2027Member2024-12-280000050863intc:FixedRateSeniorNotes4Point88PercentDueFebruary2028Member2025-12-270000050863intc:FixedRateSeniorNotes4Point88PercentDueFebruary2028Member2024-12-280000050863intc:FixedRateSeniorNotes160DueAugust2028Member2025-12-270000050863intc:FixedRateSeniorNotes160DueAugust2028Member2024-12-280000050863intc:FixedRateSeniorNotes4.00PercentDueAugust2029Member2025-12-270000050863intc:FixedRateSeniorNotes4.00PercentDueAugust2029Member2024-12-280000050863intc:A2019SeniorNotesDueNovember2029At245Member2025-12-270000050863intc:A2019SeniorNotesDueNovember2029At245Member2024-12-280000050863intc:FixedRateSeniorNotes5Point13PercentDueFebruary2030Member2025-12-270000050863intc:FixedRateSeniorNotes5Point13PercentDueFebruary2030Member2024-12-280000050863intc:FixedRateSeniorNotes390DueMarch2030Member2025-12-270000050863intc:FixedRateSeniorNotes390DueMarch2030Member2024-12-280000050863intc:FixedRateSeniorNotes5.00PercentDueFebruary2031Member2025-12-270000050863intc:FixedRateSeniorNotes5.00PercentDueFebruary2031Member2024-12-280000050863intc:FixedRateSeniorNotes200DueAugust2031Member2025-12-270000050863intc:FixedRateSeniorNotes200DueAugust2031Member2024-12-280000050863intc:FixedRateSeniorNotes415DueAugust2032Member2025-12-270000050863intc:FixedRateSeniorNotes415DueAugust2032Member2024-12-280000050863intc:DebtInstrumentElevenMember2025-12-270000050863intc:DebtInstrumentElevenMember2024-12-280000050863intc:FixedRateSeniorNotes5Point20PercentDueFebruary2033Member2025-12-270000050863intc:FixedRateSeniorNotes5Point20PercentDueFebruary2033Member2024-12-280000050863intc:FixedRateSeniorNotes5.15PercentDueFebruary2034Member2025-12-270000050863intc:FixedRateSeniorNotes5.15PercentDueFebruary2034Member2024-12-280000050863intc:FixedRateSeniorNotes460DueMarch2040Member2025-12-270000050863intc:FixedRateSeniorNotes460DueMarch2040Member2024-12-280000050863intc:FixedRateSeniorNotes280DueAugust2041Member2025-12-270000050863intc:FixedRateSeniorNotes280DueAugust2041Member2024-12-280000050863intc:DebtInstrumentEightMember2025-12-270000050863intc:DebtInstrumentEightMember2024-12-280000050863intc:DebtInstrumentTwelveMember2025-12-270000050863intc:DebtInstrumentTwelveMember2024-12-280000050863intc:FixedRateSeniorNotes5Point63PercentDueFebruary2043Member2025-12-270000050863intc:FixedRateSeniorNotes5Point63PercentDueFebruary2043Member2024-12-280000050863intc:DebtInstrumentSeventeenMember2025-12-270000050863intc:DebtInstrumentSeventeenMember2024-12-280000050863intc:DebtInstrumentThirtyThreeMember2025-12-270000050863intc:DebtInstrumentThirtyThreeMember2024-12-280000050863intc:DebtInstrumentFortyThreeMember2025-12-270000050863intc:DebtInstrumentFortyThreeMember2024-12-280000050863intc:A6404.10SeniorNotesdueAugust2047Member2025-12-270000050863intc:A6404.10SeniorNotesdueAugust2047Member2024-12-280000050863intc:A2017SeniornotesdueDecember2047at3.73Member2025-12-270000050863intc:A2017SeniornotesdueDecember2047at3.73Member2024-12-280000050863intc:A2019SeniorNotesdueDecember2049at3.25Member2025-12-270000050863intc:A2019SeniorNotesdueDecember2049at3.25Member2024-12-280000050863intc:FixedRateSeniorNotes475DueMarch2050Member2025-12-270000050863intc:FixedRateSeniorNotes475DueMarch2050Member2024-12-280000050863intc:FixedRateSeniorNotes305DueAugust2051Member2025-12-270000050863intc:FixedRateSeniorNotes305DueAugust2051Member2024-12-280000050863intc:FixedRateSeniorNotes490DueAugust2052Member2025-12-270000050863intc:FixedRateSeniorNotes490DueAugust2052Member2024-12-280000050863intc:FixedRateSeniorNotes5Point70PercentDueFebruary2053Member2025-12-270000050863intc:FixedRateSeniorNotes5Point70PercentDueFebruary2053Member2024-12-280000050863intc:FixedRateSeniorNotes5.60PercentDueFebruary2054Member2025-12-270000050863intc:FixedRateSeniorNotes5.60PercentDueFebruary2054Member2024-12-280000050863intc:FixedRateSeniorNotes310DueFebruary2060Member2025-12-270000050863intc:FixedRateSeniorNotes310DueFebruary2060Member2024-12-280000050863intc:FixedRateSeniorNotes495DueMarch2060Member2025-12-270000050863intc:FixedRateSeniorNotes495DueMarch2060Member2024-12-280000050863intc:FixedRateSeniorNotes320DueAugust2061Member2025-12-270000050863intc:FixedRateSeniorNotes320DueAugust2061Member2024-12-280000050863intc:FixedRateSeniorNotes505DueAugust2062Member2025-12-270000050863intc:FixedRateSeniorNotes505DueAugust2062Member2024-12-280000050863intc:FixedRateSeniorNotes5Point90PercentDueFebruary2063Member2025-12-270000050863intc:FixedRateSeniorNotes5Point90PercentDueFebruary2063Member2024-12-280000050863intc:OregonAndArizonaBondsDue2035To2040Member2025-12-270000050863intc:OregonAndArizonaBondsDue2035To2040Member2024-12-280000050863intc:A500OregonAndArizonaBondsDueSeptember2042Member2025-12-270000050863intc:A500OregonAndArizonaBondsDueSeptember2042Member2024-12-280000050863intc:A4.00PercentOregonAndArizonaBondsDueJune2049Member2025-12-270000050863intc:A4.00PercentOregonAndArizonaBondsDueJune2049Member2024-12-280000050863intc:IndustrialAuthorityoftheCityofChandlerArizonaMember2024-12-280000050863intc:A500OregonAndArizonaBondsDueSeptember2052Member2025-12-270000050863intc:A500OregonAndArizonaBondsDueSeptember2052Member2024-12-280000050863us-gaap:InterestRateSwapMemberus-gaap:ShortTermDebtMember2025-12-270000050863us-gaap:InterestRateSwapMemberus-gaap:ShortTermDebtMember2024-12-280000050863us-gaap:SeniorNotesMember2024-12-292025-12-270000050863us-gaap:SeniorNotesMember2024-12-280000050863us-gaap:SeniorNotesMember2023-12-312024-12-280000050863us-gaap:RevolvingCreditFacilityMemberintc:CreditFacility364DayMemberus-gaap:LineOfCreditMember2024-12-292025-12-270000050863us-gaap:RevolvingCreditFacilityMemberintc:CreditFacility364DayMemberus-gaap:LineOfCreditMember2024-12-280000050863us-gaap:RevolvingCreditFacilityMemberintc:CreditFacility364DayMemberus-gaap:LineOfCreditMember2025-12-270000050863us-gaap:RevolvingCreditFacilityMemberintc:RevolvingCreditFacility5YearMemberus-gaap:LineOfCreditMember2023-12-312024-12-280000050863us-gaap:RevolvingCreditFacilityMemberintc:RevolvingCreditFacility5YearMemberus-gaap:LineOfCreditMember2023-12-300000050863us-gaap:RevolvingCreditFacilityMemberintc:RevolvingCreditFacility5YearMemberus-gaap:LineOfCreditMember2024-12-280000050863us-gaap:RevolvingCreditFacilityMemberintc:CreditFacility364DayMemberus-gaap:LineOfCreditMember2023-12-312024-12-280000050863us-gaap:RevolvingCreditFacilityMemberus-gaap:LineOfCreditMember2025-12-270000050863us-gaap:RevolvingCreditFacilityMemberus-gaap:LineOfCreditMember2024-12-280000050863intc:OregonAndArizonaBondsDue2035To2040Membersrt:MaximumMember2025-12-270000050863intc:IndustrialAuthorityoftheCityofChandlerArizonaMember2025-12-270000050863us-gaap:CorporateDebtSecuritiesMemberus-gaap:CashEquivalentsMemberus-gaap:FairValueInputsLevel1Member2025-12-270000050863us-gaap:CorporateDebtSecuritiesMemberus-gaap:CashEquivalentsMemberus-gaap:FairValueInputsLevel2Member2025-12-270000050863us-gaap:CorporateDebtSecuritiesMemberus-gaap:CashEquivalentsMemberus-gaap:FairValueInputsLevel3Member2025-12-270000050863us-gaap:CorporateDebtSecuritiesMemberus-gaap:CashEquivalentsMember2025-12-270000050863us-gaap:CorporateDebtSecuritiesMemberus-gaap:CashEquivalentsMemberus-gaap:FairValueInputsLevel1Member2024-12-280000050863us-gaap:CorporateDebtSecuritiesMemberus-gaap:CashEquivalentsMemberus-gaap:FairValueInputsLevel2Member2024-12-280000050863us-gaap:CorporateDebtSecuritiesMemberus-gaap:CashEquivalentsMemberus-gaap:FairValueInputsLevel3Member2024-12-280000050863us-gaap:CorporateDebtSecuritiesMemberus-gaap:CashEquivalentsMember2024-12-280000050863us-gaap:FixedIncomeSecuritiesMemberus-gaap:CashEquivalentsMemberus-gaap:FairValueInputsLevel1Member2025-12-270000050863us-gaap:FixedIncomeSecuritiesMemberus-gaap:CashEquivalentsMemberus-gaap:FairValueInputsLevel2Member2025-12-270000050863us-gaap:FixedIncomeSecuritiesMemberus-gaap:CashEquivalentsMemberus-gaap:FairValueInputsLevel3Member2025-12-270000050863us-gaap:FixedIncomeSecuritiesMemberus-gaap:CashEquivalentsMember2025-12-270000050863us-gaap:FixedIncomeSecuritiesMemberus-gaap:CashEquivalentsMemberus-gaap:FairValueInputsLevel1Member2024-12-280000050863us-gaap:FixedIncomeSecuritiesMemberus-gaap:CashEquivalentsMemberus-gaap:FairValueInputsLevel2Member2024-12-280000050863us-gaap:FixedIncomeSecuritiesMemberus-gaap:CashEquivalentsMemberus-gaap:FairValueInputsLevel3Member2024-12-280000050863us-gaap:FixedIncomeSecuritiesMemberus-gaap:CashEquivalentsMember2024-12-280000050863us-gaap:RepurchaseAgreementsMemberus-gaap:CashEquivalentsMemberus-gaap:FairValueInputsLevel1Member2025-12-270000050863us-gaap:RepurchaseAgreementsMemberus-gaap:CashEquivalentsMemberus-gaap:FairValueInputsLevel2Member2025-12-270000050863us-gaap:RepurchaseAgreementsMemberus-gaap:CashEquivalentsMemberus-gaap:FairValueInputsLevel3Member2025-12-270000050863us-gaap:RepurchaseAgreementsMemberus-gaap:CashEquivalentsMember2025-12-270000050863us-gaap:RepurchaseAgreementsMemberus-gaap:CashEquivalentsMemberus-gaap:FairValueInputsLevel1Member2024-12-280000050863us-gaap:RepurchaseAgreementsMemberus-gaap:CashEquivalentsMemberus-gaap:FairValueInputsLevel2Member2024-12-280000050863us-gaap:RepurchaseAgreementsMemberus-gaap:CashEquivalentsMemberus-gaap:FairValueInputsLevel3Member2024-12-280000050863us-gaap:RepurchaseAgreementsMemberus-gaap:CashEquivalentsMember2024-12-280000050863us-gaap:CorporateDebtSecuritiesMemberus-gaap:ShortTermInvestmentsMemberus-gaap:FairValueInputsLevel1Member2025-12-270000050863us-gaap:CorporateDebtSecuritiesMemberus-gaap:ShortTermInvestmentsMemberus-gaap:FairValueInputsLevel2Member2025-12-270000050863us-gaap:CorporateDebtSecuritiesMemberus-gaap:ShortTermInvestmentsMemberus-gaap:FairValueInputsLevel3Member2025-12-270000050863us-gaap:CorporateDebtSecuritiesMemberus-gaap:ShortTermInvestmentsMember2025-12-270000050863us-gaap:CorporateDebtSecuritiesMemberus-gaap:ShortTermInvestmentsMemberus-gaap:FairValueInputsLevel1Member2024-12-280000050863us-gaap:CorporateDebtSecuritiesMemberus-gaap:ShortTermInvestmentsMemberus-gaap:FairValueInputsLevel2Member2024-12-280000050863us-gaap:CorporateDebtSecuritiesMemberus-gaap:ShortTermInvestmentsMemberus-gaap:FairValueInputsLevel3Member2024-12-280000050863us-gaap:CorporateDebtSecuritiesMemberus-gaap:ShortTermInvestmentsMember2024-12-280000050863us-gaap:FixedIncomeSecuritiesMemberus-gaap:ShortTermInvestmentsMemberus-gaap:FairValueInputsLevel1Member2025-12-270000050863us-gaap:FixedIncomeSecuritiesMemberus-gaap:ShortTermInvestmentsMemberus-gaap:FairValueInputsLevel2Member2025-12-270000050863us-gaap:FixedIncomeSecuritiesMemberus-gaap:ShortTermInvestmentsMemberus-gaap:FairValueInputsLevel3Member2025-12-270000050863us-gaap:FixedIncomeSecuritiesMemberus-gaap:ShortTermInvestmentsMember2025-12-270000050863us-gaap:FixedIncomeSecuritiesMemberus-gaap:ShortTermInvestmentsMemberus-gaap:FairValueInputsLevel1Member2024-12-280000050863us-gaap:FixedIncomeSecuritiesMemberus-gaap:ShortTermInvestmentsMemberus-gaap:FairValueInputsLevel2Member2024-12-280000050863us-gaap:FixedIncomeSecuritiesMemberus-gaap:ShortTermInvestmentsMemberus-gaap:FairValueInputsLevel3Member2024-12-280000050863us-gaap:FixedIncomeSecuritiesMemberus-gaap:ShortTermInvestmentsMember2024-12-280000050863intc:GovernmentDebtSecuritiesMemberus-gaap:ShortTermInvestmentsMemberus-gaap:FairValueInputsLevel1Member2025-12-270000050863intc:GovernmentDebtSecuritiesMemberus-gaap:ShortTermInvestmentsMemberus-gaap:FairValueInputsLevel2Member2025-12-270000050863intc:GovernmentDebtSecuritiesMemberus-gaap:ShortTermInvestmentsMemberus-gaap:FairValueInputsLevel3Member2025-12-270000050863intc:GovernmentDebtSecuritiesMemberus-gaap:ShortTermInvestmentsMember2025-12-270000050863intc:GovernmentDebtSecuritiesMemberus-gaap:ShortTermInvestmentsMemberus-gaap:FairValueInputsLevel1Member2024-12-280000050863intc:GovernmentDebtSecuritiesMemberus-gaap:ShortTermInvestmentsMemberus-gaap:FairValueInputsLevel2Member2024-12-280000050863intc:GovernmentDebtSecuritiesMemberus-gaap:ShortTermInvestmentsMemberus-gaap:FairValueInputsLevel3Member2024-12-280000050863intc:GovernmentDebtSecuritiesMemberus-gaap:ShortTermInvestmentsMember2024-12-280000050863us-gaap:FairValueInputsLevel1Member2025-12-270000050863us-gaap:FairValueInputsLevel2Member2025-12-270000050863us-gaap:FairValueInputsLevel3Member2025-12-270000050863us-gaap:FairValueInputsLevel1Member2024-12-280000050863us-gaap:FairValueInputsLevel2Member2024-12-280000050863us-gaap:FairValueInputsLevel3Member2024-12-280000050863us-gaap:EquitySecuritiesMemberus-gaap:FairValueInputsLevel1Member2025-12-270000050863us-gaap:EquitySecuritiesMemberus-gaap:FairValueInputsLevel2Member2025-12-270000050863us-gaap:EquitySecuritiesMemberus-gaap:FairValueInputsLevel3Member2025-12-270000050863us-gaap:EquitySecuritiesMember2025-12-270000050863us-gaap:EquitySecuritiesMemberus-gaap:FairValueInputsLevel1Member2024-12-280000050863us-gaap:EquitySecuritiesMemberus-gaap:FairValueInputsLevel2Member2024-12-280000050863us-gaap:EquitySecuritiesMemberus-gaap:FairValueInputsLevel3Member2024-12-280000050863us-gaap:EquitySecuritiesMember2024-12-280000050863us-gaap:CarryingReportedAmountFairValueDisclosureMember2025-12-270000050863us-gaap:CarryingReportedAmountFairValueDisclosureMember2024-12-280000050863us-gaap:AccumulatedGainLossNetCashFlowHedgeParentMember2022-12-310000050863us-gaap:AccumulatedDefinedBenefitPlansAdjustmentMember2022-12-310000050863us-gaap:AccumulatedTranslationAdjustmentMember2022-12-310000050863us-gaap:AccumulatedGainLossNetCashFlowHedgeParentMember2023-01-012023-12-300000050863us-gaap:AccumulatedDefinedBenefitPlansAdjustmentMember2023-01-012023-12-300000050863us-gaap:AccumulatedTranslationAdjustmentMember2023-01-012023-12-300000050863us-gaap:AccumulatedGainLossNetCashFlowHedgeParentMember2023-12-300000050863us-gaap:AccumulatedDefinedBenefitPlansAdjustmentMember2023-12-300000050863us-gaap:AccumulatedTranslationAdjustmentMember2023-12-300000050863us-gaap:AccumulatedGainLossNetCashFlowHedgeParentMember2023-12-312024-12-280000050863us-gaap:AccumulatedDefinedBenefitPlansAdjustmentMember2023-12-312024-12-280000050863us-gaap:AccumulatedTranslationAdjustmentMember2023-12-312024-12-280000050863us-gaap:AccumulatedGainLossNetCashFlowHedgeParentMember2024-12-280000050863us-gaap:AccumulatedDefinedBenefitPlansAdjustmentMember2024-12-280000050863us-gaap:AccumulatedTranslationAdjustmentMember2024-12-280000050863us-gaap:AccumulatedGainLossNetCashFlowHedgeParentMember2024-12-292025-12-270000050863us-gaap:AccumulatedDefinedBenefitPlansAdjustmentMember2024-12-292025-12-270000050863us-gaap:AccumulatedTranslationAdjustmentMember2024-12-292025-12-270000050863us-gaap:AccumulatedGainLossNetCashFlowHedgeParentMember2025-12-270000050863us-gaap:AccumulatedDefinedBenefitPlansAdjustmentMember2025-12-270000050863us-gaap:AccumulatedTranslationAdjustmentMember2025-12-270000050863us-gaap:ForeignExchangeContractMember2025-12-270000050863us-gaap:ForeignExchangeContractMember2024-12-280000050863us-gaap:InterestRateContractMember2025-12-270000050863us-gaap:InterestRateContractMember2024-12-280000050863us-gaap:OtherContractMember2025-12-270000050863us-gaap:OtherContractMember2024-12-280000050863us-gaap:InterestRateSwapMemberus-gaap:LongTermDebtMemberus-gaap:FairValueHedgingMember2025-12-270000050863us-gaap:InterestRateSwapMemberus-gaap:LongTermDebtMemberus-gaap:FairValueHedgingMember2024-12-280000050863us-gaap:ForeignExchangeContractMemberus-gaap:OtherAssetsMemberus-gaap:DesignatedAsHedgingInstrumentMember2025-12-270000050863us-gaap:ForeignExchangeContractMemberus-gaap:OtherLiabilitiesMemberus-gaap:DesignatedAsHedgingInstrumentMember2025-12-270000050863us-gaap:ForeignExchangeContractMemberus-gaap:OtherAssetsMemberus-gaap:DesignatedAsHedgingInstrumentMember2024-12-280000050863us-gaap:ForeignExchangeContractMemberus-gaap:OtherLiabilitiesMemberus-gaap:DesignatedAsHedgingInstrumentMember2024-12-280000050863us-gaap:InterestRateContractMemberus-gaap:OtherAssetsMemberus-gaap:DesignatedAsHedgingInstrumentMember2025-12-270000050863us-gaap:InterestRateContractMemberus-gaap:OtherLiabilitiesMemberus-gaap:DesignatedAsHedgingInstrumentMember2025-12-270000050863us-gaap:InterestRateContractMemberus-gaap:OtherAssetsMemberus-gaap:DesignatedAsHedgingInstrumentMember2024-12-280000050863us-gaap:InterestRateContractMemberus-gaap:OtherLiabilitiesMemberus-gaap:DesignatedAsHedgingInstrumentMember2024-12-280000050863us-gaap:OtherAssetsMemberus-gaap:DesignatedAsHedgingInstrumentMember2025-12-270000050863us-gaap:OtherLiabilitiesMemberus-gaap:DesignatedAsHedgingInstrumentMember2025-12-270000050863us-gaap:OtherAssetsMemberus-gaap:DesignatedAsHedgingInstrumentMember2024-12-280000050863us-gaap:OtherLiabilitiesMemberus-gaap:DesignatedAsHedgingInstrumentMember2024-12-280000050863us-gaap:ForeignExchangeContractMemberus-gaap:OtherAssetsMemberus-gaap:NondesignatedMember2025-12-270000050863us-gaap:ForeignExchangeContractMemberus-gaap:OtherLiabilitiesMemberus-gaap:NondesignatedMember2025-12-270000050863us-gaap:ForeignExchangeContractMemberus-gaap:OtherAssetsMemberus-gaap:NondesignatedMember2024-12-280000050863us-gaap:ForeignExchangeContractMemberus-gaap:OtherLiabilitiesMemberus-gaap:NondesignatedMember2024-12-280000050863us-gaap:InterestRateContractMemberus-gaap:OtherAssetsMemberus-gaap:NondesignatedMember2025-12-270000050863us-gaap:InterestRateContractMemberus-gaap:OtherLiabilitiesMemberus-gaap:NondesignatedMember2025-12-270000050863us-gaap:InterestRateContractMemberus-gaap:OtherAssetsMemberus-gaap:NondesignatedMember2024-12-280000050863us-gaap:InterestRateContractMemberus-gaap:OtherLiabilitiesMemberus-gaap:NondesignatedMember2024-12-280000050863us-gaap:EquityContractMemberus-gaap:OtherAssetsMemberus-gaap:NondesignatedMember2025-12-270000050863us-gaap:EquityContractMemberus-gaap:OtherLiabilitiesMemberus-gaap:NondesignatedMember2025-12-270000050863us-gaap:EquityContractMemberus-gaap:OtherAssetsMemberus-gaap:NondesignatedMember2024-12-280000050863us-gaap:EquityContractMemberus-gaap:OtherLiabilitiesMemberus-gaap:NondesignatedMember2024-12-280000050863intc:SharesInEscrowMemberus-gaap:OtherAssetsMemberus-gaap:NondesignatedMember2025-12-270000050863intc:SharesInEscrowMemberus-gaap:OtherLiabilitiesMemberus-gaap:NondesignatedMember2025-12-270000050863intc:SharesInEscrowMemberus-gaap:OtherAssetsMemberus-gaap:NondesignatedMember2024-12-280000050863intc:SharesInEscrowMemberus-gaap:OtherLiabilitiesMemberus-gaap:NondesignatedMember2024-12-280000050863us-gaap:OtherContractMemberus-gaap:OtherAssetsMemberus-gaap:NondesignatedMember2025-12-270000050863us-gaap:OtherContractMemberus-gaap:OtherLiabilitiesMemberus-gaap:NondesignatedMember2025-12-270000050863us-gaap:OtherContractMemberus-gaap:OtherAssetsMemberus-gaap:NondesignatedMember2024-12-280000050863us-gaap:OtherContractMemberus-gaap:OtherLiabilitiesMemberus-gaap:NondesignatedMember2024-12-280000050863us-gaap:OtherAssetsMemberus-gaap:NondesignatedMember2025-12-270000050863us-gaap:OtherLiabilitiesMemberus-gaap:NondesignatedMember2025-12-270000050863us-gaap:OtherAssetsMemberus-gaap:NondesignatedMember2024-12-280000050863us-gaap:OtherLiabilitiesMemberus-gaap:NondesignatedMember2024-12-280000050863us-gaap:OtherAssetsMember2025-12-270000050863us-gaap:OtherLiabilitiesMember2025-12-270000050863us-gaap:OtherAssetsMember2024-12-280000050863us-gaap:OtherLiabilitiesMember2024-12-280000050863us-gaap:ForeignExchangeContractMember2024-12-292025-12-270000050863us-gaap:ForeignExchangeContractMember2023-12-312024-12-280000050863us-gaap:ForeignExchangeContractMember2023-01-012023-12-300000050863us-gaap:InterestRateContractMember2024-12-292025-12-270000050863us-gaap:InterestRateContractMember2023-12-312024-12-280000050863us-gaap:InterestRateContractMember2023-01-012023-12-300000050863us-gaap:ForeignExchangeContractMemberus-gaap:NondesignatedMember2023-01-012023-12-300000050863us-gaap:ForeignExchangeContractMemberus-gaap:NondesignatedMember2023-12-312024-12-280000050863us-gaap:ForeignExchangeContractMemberus-gaap:NondesignatedMember2024-12-292025-12-270000050863us-gaap:DesignatedAsHedgingInstrumentMember2024-12-292025-12-270000050863us-gaap:DesignatedAsHedgingInstrumentMember2023-12-312024-12-280000050863us-gaap:DesignatedAsHedgingInstrumentMember2023-01-012023-12-300000050863us-gaap:InterestRateSwapMemberus-gaap:LongTermDebtMember2025-12-270000050863us-gaap:InterestRateSwapMemberus-gaap:LongTermDebtMember2024-12-280000050863us-gaap:InterestRateSwapMember2025-12-270000050863us-gaap:InterestRateSwapMember2024-12-280000050863us-gaap:InterestRateContractMemberus-gaap:NondesignatedMember2023-01-012023-12-300000050863us-gaap:InterestRateContractMemberus-gaap:NondesignatedMember2023-12-312024-12-280000050863us-gaap:InterestRateContractMemberus-gaap:NondesignatedMember2024-12-292025-12-270000050863intc:SharesInEscrowMemberus-gaap:NondesignatedMember2023-12-312024-12-280000050863intc:SharesInEscrowMemberus-gaap:NondesignatedMember2023-01-012023-12-300000050863us-gaap:OtherContractMemberus-gaap:NondesignatedMember2023-01-012023-12-300000050863us-gaap:OtherContractMemberus-gaap:NondesignatedMember2024-12-292025-12-270000050863us-gaap:OtherContractMemberus-gaap:NondesignatedMember2023-12-312024-12-280000050863us-gaap:NondesignatedMember2024-12-292025-12-270000050863us-gaap:NondesignatedMember2023-12-312024-12-280000050863us-gaap:NondesignatedMember2023-01-012023-12-300000050863country:US2024-12-292025-12-270000050863country:US2023-12-312024-12-280000050863country:US2023-01-012023-12-300000050863country:USus-gaap:DefinedBenefitPostretirementHealthCoverageMember2025-12-270000050863country:USus-gaap:DefinedBenefitPostretirementHealthCoverageMember2024-12-280000050863country:USus-gaap:DefinedBenefitPostretirementHealthCoverageMemberus-gaap:DefinedBenefitPlanEquitySecuritiesMember2025-12-270000050863country:USus-gaap:DefinedBenefitPostretirementHealthCoverageMemberus-gaap:FixedIncomeSecuritiesMember2025-12-270000050863us-gaap:DefinedBenefitPostretirementHealthCoverageMember2024-12-292025-12-270000050863country:US2025-12-270000050863us-gaap:ForeignPlanMember2025-12-270000050863country:US2024-12-280000050863us-gaap:ForeignPlanMember2024-12-280000050863country:USus-gaap:PensionPlansDefinedBenefitMember2024-12-292025-12-270000050863country:USus-gaap:PensionPlansDefinedBenefitMember2023-12-312024-12-280000050863country:USus-gaap:PensionPlansDefinedBenefitMember2023-01-012023-12-300000050863us-gaap:DefinedBenefitPlanEquitySecuritiesMemberus-gaap:FairValueInputsLevel1Member2025-12-270000050863us-gaap:DefinedBenefitPlanEquitySecuritiesMemberus-gaap:FairValueInputsLevel2Member2025-12-270000050863us-gaap:DefinedBenefitPlanEquitySecuritiesMemberus-gaap:FairValueInputsLevel3Member2025-12-270000050863us-gaap:DefinedBenefitPlanEquitySecuritiesMember2025-12-270000050863us-gaap:DefinedBenefitPlanEquitySecuritiesMemberus-gaap:FairValueInputsLevel1Member2024-12-280000050863us-gaap:DefinedBenefitPlanEquitySecuritiesMemberus-gaap:FairValueInputsLevel2Member2024-12-280000050863us-gaap:DefinedBenefitPlanEquitySecuritiesMemberus-gaap:FairValueInputsLevel3Member2024-12-280000050863us-gaap:DefinedBenefitPlanEquitySecuritiesMember2024-12-280000050863us-gaap:FixedIncomeSecuritiesMemberus-gaap:FairValueInputsLevel1Member2025-12-270000050863us-gaap:FixedIncomeSecuritiesMemberus-gaap:FairValueInputsLevel2Member2025-12-270000050863us-gaap:FixedIncomeSecuritiesMemberus-gaap:FairValueInputsLevel3Member2025-12-270000050863us-gaap:FixedIncomeSecuritiesMember2025-12-270000050863us-gaap:FixedIncomeSecuritiesMemberus-gaap:FairValueInputsLevel1Member2024-12-280000050863us-gaap:FixedIncomeSecuritiesMemberus-gaap:FairValueInputsLevel2Member2024-12-280000050863us-gaap:FixedIncomeSecuritiesMemberus-gaap:FairValueInputsLevel3Member2024-12-280000050863us-gaap:FixedIncomeSecuritiesMember2024-12-280000050863us-gaap:PensionPlansDefinedBenefitMember2025-12-270000050863us-gaap:PensionPlansDefinedBenefitMember2024-12-280000050863intc:AssetsmeasuredatnetassetvalueMember2025-12-270000050863intc:AssetsmeasuredatnetassetvalueMember2024-12-280000050863us-gaap:DefinedBenefitPlanCashAndCashEquivalentsMember2025-12-270000050863us-gaap:DefinedBenefitPlanCashAndCashEquivalentsMember2024-12-280000050863country:USus-gaap:FixedIncomeSecuritiesMember2025-12-270000050863country:USus-gaap:DefinedBenefitPlanEquitySecuritiesMember2025-12-270000050863us-gaap:ForeignPlanMemberus-gaap:FixedIncomeSecuritiesMember2025-12-270000050863us-gaap:ForeignPlanMemberus-gaap:DefinedBenefitPlanEquitySecuritiesMember2025-12-270000050863us-gaap:ForeignPlanMemberus-gaap:HedgeFundsMember2025-12-270000050863us-gaap:ForeignPlanMemberus-gaap:FixedIncomeSecuritiesMember2024-12-280000050863us-gaap:ForeignPlanMemberus-gaap:DefinedBenefitPlanEquitySecuritiesMember2024-12-280000050863us-gaap:ForeignPlanMemberus-gaap:HedgeFundsMember2024-12-280000050863us-gaap:PensionPlansDefinedBenefitMember2024-12-292025-12-270000050863intc:EquityIncentivePlanOneMember2025-12-270000050863srt:MinimumMemberintc:MarketBasedRestrictedStockUnitsMember2025-12-270000050863srt:MaximumMemberintc:MarketBasedRestrictedStockUnitsMember2025-12-270000050863intc:MarketBasedRestrictedStockUnitsMember2025-12-270000050863us-gaap:RestrictedStockUnitsRSUMember2024-12-292025-12-270000050863us-gaap:RestrictedStockUnitsRSUMember2023-12-312024-12-280000050863us-gaap:RestrictedStockUnitsRSUMember2023-01-012023-12-300000050863intc:MarketBasedRestrictedStockUnitsMember2024-12-292025-12-270000050863intc:MarketBasedRestrictedStockUnitsMember2023-12-312024-12-280000050863intc:MarketBasedRestrictedStockUnitsMember2023-01-012023-12-300000050863us-gaap:RestrictedStockUnitsRSUMember2024-12-280000050863us-gaap:RestrictedStockUnitsRSUMember2025-12-270000050863intc:StockPurchasePlanMember2024-12-292025-12-270000050863intc:StockPurchasePlanMember2025-12-270000050863intc:StockPurchasePlanRIghtsMember2024-12-292025-12-270000050863intc:StockPurchasePlanRIghtsMember2023-12-312024-12-280000050863intc:StockPurchasePlanRIghtsMember2023-01-012023-12-300000050863intc:StockPurchasePlanRIghtsMember2025-12-270000050863us-gaap:AccruedLiabilitiesMember2025-12-270000050863us-gaap:AccruedLiabilitiesMember2024-12-280000050863us-gaap:OtherNoncurrentLiabilitiesMember2025-12-270000050863us-gaap:OtherNoncurrentLiabilitiesMember2024-12-280000050863srt:MaximumMember2025-12-270000050863us-gaap:CapitalAdditionsMember2025-12-270000050863us-gaap:CapitalAdditionsMember2024-12-280000050863intc:SemiconductorCoInvestmentProgramConstructionCostsMember2025-12-270000050863intc:VLSITechnologyLLCV.IntelMember2025-12-270000050863intc:EcFineMember2025-12-270000050863intc:EcFineMember2009-06-282009-09-260000050863intc:EcFineMember2023-09-012023-09-300000050863intc:EcFineMember2025-12-012025-12-270000050863intc:VLSITechnologyLLCV.IntelMember2017-10-012017-10-310000050863intc:VLSITechnologyLLCV.IntelMember2024-04-012024-04-300000050863intc:VLSITechnologyLLCV.IntelMember2019-04-012019-04-300000050863intc:VLSITechnologyLLCV.IntelMemberintc:LiteralPatentInfringementMember2021-02-012021-02-280000050863intc:VLSITechnologyLLCV.IntelMemberintc:DoctrineOfEquivalentsPatentInfringementMember2021-02-012021-02-280000050863intc:VLSITechnologyLLCV.IntelMember2022-04-012022-04-300000050863intc:VLSITechnologyLLCV.IntelMember2021-04-012021-04-300000050863intc:VLSITechnologyLLCV.IntelMember2022-11-012022-11-300000050863intc:ShenzenMemberintc:VLSITechnologyLLCV.IntelMember2019-05-012019-05-310000050863intc:ShanghaiMemberintc:VLSITechnologyLLCV.IntelMember2019-05-012019-05-310000050863intc:EireOgInnovationsVIBMEt.Al.Member2025-04-012025-09-270000050863intc:MediaContentProtectionVIntelMember2020-09-012020-09-300000050863intc:MediaContentProtectionVIntelMembersrt:MinimumMember2024-12-292025-12-270000050863intc:MediaContentProtectionVIntelMembersrt:MaximumMember2024-12-292025-12-27
UNITED STATES SECURITIES AND EXCHANGE COMMISSION
Washington, D.C. 20549
FORM 10-K
(Mark One)
| | | | | |
| ☑ | ANNUAL REPORT PURSUANT TO SECTION 13 OR 15(d) OF THE SECURITIES EXCHANGE ACT OF 1934 |
| For the fiscal year ended December 27, 2025. |
| or |
| ☐ | TRANSITION REPORT PURSUANT TO SECTION 13 OR 15(d) OF THE SECURITIES EXCHANGE ACT OF 1934 |
| For the transition period from to . |
Commission File Number: 000-06217
INTEL CORPORATION
(Exact name of registrant as specified in its charter)
| | | | | | | | | | | | | | |
| Delaware | | | | 94-1672743 |
| (State or other jurisdiction of incorporation or organization) | | (I.R.S. Employer Identification No.) |
| | | | |
| 2200 Mission College Boulevard, | Santa Clara, | California | | 95054-1549 |
| (Address of principal executive offices) | | (Zip Code) |
Registrant's telephone number, including area code: (408) 765-8080
Securities registered pursuant to Section 12(b) of the Act:
| | | | | | | | | | | | | | |
| Title of each class | | Trading symbol | | Name of each exchange on which registered |
| Common stock, $0.001 par value | | INTC | | Nasdaq Global Select Market |
Securities registered pursuant to Section 12(g) of the Act: None
Indicate by check mark if the registrant is a well-known seasoned issuer, as defined in Rule 405 of the Securities Act. Yes ☑ No ☐
Indicate by check mark if the registrant is not required to file reports pursuant to Section 13 or Section 15(d) of the Act. Yes ☐ No ☑
Indicate by check mark whether the registrant (1) has filed all reports required to be filed by Section 13 or 15(d) of the Securities Exchange Act of 1934 during the preceding 12 months (or for such shorter period that the registrant was required to file such reports), and (2) has been subject to such filing requirements for the past 90 days. Yes ☑ No ☐
Indicate by check mark whether the registrant has submitted electronically every interactive data file required to be submitted pursuant to Rule 405 of Regulation S-T (§232.405 of this chapter) during the preceding 12 months (or for such shorter period that the registrant was required to submit such files). Yes ☑ No ☐
Indicate by check mark whether the registrant is a large accelerated filer, an accelerated filer, a non-accelerated filer, a smaller reporting company, or an emerging growth company. See the definitions of "large accelerated filer", "accelerated filer", "smaller reporting company", and "emerging growth company" in Rule 12b-2 of the Exchange Act.
| | | | | | | | | | | | | | | | | |
| Large Accelerated Filer | | Accelerated Filer | | Non-Accelerated Filer | | Smaller Reporting Company | Emerging Growth Company |
| ☑ | | ☐ | | ☐ | | ☐ | ☐ |
If an emerging growth company, indicate by check mark if the registrant has elected not to use the extended transition period for complying with any new or revised financial accounting standards provided pursuant to Section 13(a) of the Exchange Act. ☐
Indicate by check mark whether the registrant has filed a report on and attestation to its management's assessment of the effectiveness of its internal control over financial reporting under Section 404(b) of the Sarbanes-Oxley Act (15 U.S.C. 7262(b)) by the registered public accounting firm that prepared or issued its audit report. ☑
If securities are registered pursuant to Section 12(b) of the Act, indicate by check mark whether the financial statements of the registrant included in the filing reflect the correction of an error to previously issued financial statements. ☐
Indicate by check mark whether any of those error corrections are restatements that required a recovery analysis of incentive-based compensation received by any of the registrant's executive officers during the relevant recovery period pursuant to §240.10D-1(b). ☐
Indicate by check mark whether the registrant is a shell company (as defined in Rule 12b-2 of the Exchange Act). Yes ☐ No ☑
The aggregate market value of voting and non-voting common equity held by non-affiliates of the registrant as of June 27, 2025, based upon the closing price of the common stock as reported by the Nasdaq Global Select Market on such date, was $99.3 billion. 4,995 million shares of common stock were outstanding as of January 16, 2026.
DOCUMENTS INCORPORATED BY REFERENCE
Portions of the registrant's proxy statement related to its 2026 Annual Stockholders' Meeting to be filed subsequently are incorporated by reference into Part III of this Form 10-K. Except as expressly incorporated by reference, the registrant's proxy statement shall not be deemed to be part of this report.
Table of Contents
Organization of Our Form 10-K
The order and presentation of content in our Form 10-K differ from the traditional SEC Form 10-K format. Our format is designed to improve readability and better present how we organize and manage our business. See "Form 10-K Cross-Reference Index" within the Financial Statements and Supplemental Details for a cross-reference index to the traditional SEC Form 10-K format.
We have defined certain terms and abbreviations used throughout our Form 10-K in "Key Terms" within the Financial Statements and Supplemental Details.
The preparation of our Consolidated Financial Statements is in conformity with U.S. GAAP. Our Form 10-K includes Adjusted Free Cash Flow, a non-GAAP financial measure we use to evaluate the cash flow trends of our business. See "Liquidity and Capital Resources" within MD&A for a description of this measure, including why management uses it and why we believe it provides investors with useful supplemental information.
| | | | | | | | |
| | Page |
Forward-Looking Statements | | 1 |
Availability of Company Information | | 2 |
| Overview | | |
| Our Strategy | | |
| Our Business | | |
| | |
| Management's Discussion and Analysis | | |
| | |
| Operating Segment Results | | |
| Consolidated Results of Operations | | |
| Liquidity and Capital Resources | | |
| | |
| Properties | | |
| Quantitative and Qualitative Disclosures About Market Risk | | |
| Critical Accounting Estimates | | |
| | |
| | |
| | |
| | |
| | |
| | |
| | |
Risk Factors | | |
| | |
Other Key Information | | |
| Information About Our Executive Officers | | |
| Market for Our Common Stock | | |
| Stock Performance Graph | | |
| Issuer Purchases of Equity Securities | | |
| Rule 10b5-1 Trading Arrangements | | |
| | |
| | |
| Cybersecurity | | |
| | |
| | |
| | |
| | |
| | |
| | |
| Disclosure Pursuant to Section 13(r) of the Securities Exchange Act of 1934 | | |
| | |
| Financial Statements and Supplemental Details | | |
| Auditor's Reports | | |
| Consolidated Financial Statements | | |
Notes to Consolidated Financial Statements | | |
| Key Terms | | |
| | |
| Controls and Procedures | | |
| Exhibits | | |
| Form 10-K Cross-Reference Index | | |
Forward-Looking Statements
This Form 10-K contains forward-looking statements that involve a number of risks and uncertainties. Words such as "accelerate", "achieve", "aim", "ambitions", "anticipate", "believe", "committed", "continue", "could", "designed", "estimate", "expect", "forecast", "future", "goals", "grow", "guidance", "intend", "likely", "may", "might", "milestones", "next generation", "objective", "on track", "opportunity", "outlook", "pending", "plan", "position", "possible", "potential", "predict", "progress", "ramp", "roadmap", "seek", "should", "strive", "targets", "to be", "upcoming", "will", "would" and variations of such words and similar expressions are intended to identify such forward-looking statements, which may include statements regarding:
▪our business plans and strategy and anticipated benefits therefrom;
▪projections of our future financial performance, including future revenue, gross profits, capital expenditures and cash flows;
▪projected costs and yield trends;
▪future cash requirements, the availability, uses, sufficiency and cost of capital resources, and sources of funding, including for future capital and R&D investments and for returns to stockholders, and credit ratings expectations;
▪future products, services and technologies, and the expected goals, timeline, ramps, progress, availability, production, regulation and benefits of such products, services and technologies, including future process nodes and packaging technology, product roadmaps, schedules, future product architectures, expectations regarding process performance, per-watt parity and metrics, and expectations regarding product and process competitiveness;
▪internal and external manufacturing plans, including future internal manufacturing volumes, manufacturing expansion plans and the financing therefor, and external foundry usage;
▪future production capacity and product supply;
▪supply expectations, including regarding constraints, limitations, pricing, and industry shortages;
▪plans and goals related to Intel's foundry business, including with respect to anticipated customers, future manufacturing capacity and service, technology and IP offerings;
▪expected timing and impact of acquisitions, divestitures and other significant transactions;
▪expected completion and impacts of restructuring activities and cost-saving or efficiency initiatives;
▪social and environmental performance goals, measures, strategies and results;
▪our anticipated growth, future market share, customer demand and trends in our businesses and operations;
▪projected growth and trends in markets relevant to our businesses;
▪anticipated trends and impacts related to industry component, substrate and foundry capacity utilization, shortages and constraints;
▪expectations regarding government funding, incentives, policies and priorities;
▪technology trends and developments, including with respect to AI;
▪macro environmental and economic conditions;
▪geopolitical tensions and conflicts, including with respect to international trade policies in areas such as tariffs and export controls, and their potential impact on our business;
▪tax- and accounting-related expectations;
▪expectations regarding our relationships with certain sanctioned parties; and
▪other characterizations of future events or circumstances.
Such statements involve many risks and uncertainties that could cause our actual results to differ materially from those expressed or implied, including those associated with:
▪the high level of competition and rapid technological change in our industry;
▪the significant, long-term and inherently risky investments we are making in R&D and manufacturing facilities that may not realize a favorable return;
▪the complexities and uncertainties in developing and implementing new semiconductor products and manufacturing process technologies;
▪a potential pause or discontinuation of our pursuit of Intel 14A and other next generation leading-edge process technologies if we are unable to secure a significant external customer for Intel 14A;
▪alternative financing arrangements and pursuit of government grants;
▪the U.S. government's acquisition of significant equity interests in us;
▪changes in product demand and margins;
▪macroeconomic conditions and geopolitical tensions and conflicts, including geopolitical and trade tensions between the U.S. and China, tensions and conflict affecting Israel and the Middle East, rising tensions between mainland China and Taiwan and the impacts of Russia's war on Ukraine;
▪recently elevated geopolitical tensions, volatility and uncertainty with respect to international trade policies, including tariffs and export controls, impacting our business, the markets in which we compete and the world economy;
▪the evolving market for products with AI capabilities;
▪our complex global supply chain supporting our manufacturing facilities and incorporating external foundries, including from disruptions, delays, trade tensions and conflicts, or shortages;
▪product defects, errata and other product issues, particularly as we develop next-generation products and implement next-generation manufacturing process technologies;
▪potential security vulnerabilities in our products;
▪increasing and evolving cybersecurity threats and privacy risks;
▪IP risks including related litigation and regulatory proceedings;
▪the need to attract, retain and motivate key talent;
▪strategic transactions and investments;
▪sales-related risks, including customer concentration and the use of distributors and other third parties;
▪our debt obligations and our ability to access sources of capital;
▪complex and evolving laws and regulations across many jurisdictions;
▪catastrophic events;
▪fluctuations in currency exchange rates;
▪changes in our effective tax rate and applicable tax regimes;
▪environmental, health, safety and product regulations; and
▪other risks and uncertainties described in this Form 10-K and in other documents we file from time to time with the SEC.
Given these risks and uncertainties, readers are cautioned not to place undue reliance on such forward-looking statements. Readers are urged to carefully review and consider the various disclosures made in this Form 10-K and in other documents we file from time to time with the SEC that disclose risks and uncertainties that may affect our business.
Unless specifically indicated otherwise, the forward-looking statements in this Form 10-K do not reflect the potential impact of any divestitures, mergers, acquisitions or other business combinations that have not been completed as of the date of this filing. In addition, the forward-looking statements in this Form 10-K are based on management's expectations as of the date of this filing, unless an earlier date is specified, including expectations based on third-party information and projections that management believes to be reputable. We do not undertake, and expressly disclaim any duty, to update such statements, whether as a result of new information, new developments, or otherwise, except to the extent that disclosure may be required by law.
Note Regarding Third-Party Information
This Form 10-K includes market data and certain other statistical information and estimates that are based on reports and other publications from industry analysts, market research firms and other independent sources, as well as management's own good faith estimates and analyses. We believe these third-party reports to be reputable, but have not independently verified the underlying data sources, methodologies or assumptions. The reports and other publications referenced are generally available to the public and were not commissioned by us. Information that is based on estimates, forecasts, projections, market research or similar methodologies is inherently subject to uncertainties, and actual events or circumstances may differ materially from events and circumstances reflected in this information.
Intel, Arc, Intel Core, FlexRAN, Gaudi, the Intel logo, Thunderbolt and the Thunderbolt logo, Intel vPro and Xeon are trademarks of Intel Corporation or its subsidiaries.
* Other names and brands may be claimed as the property of others.
Availability of Company Information
We use our Investor Relations website, www.intc.com, as a routine channel for distribution of important, and often material, information about us, including our quarterly and annual earnings results and presentations; press releases; announcements; information about upcoming webcasts, analyst presentations and investor days; archives of these events; financial information; corporate governance practices; and corporate responsibility information. We also post our filings on this website the same day they are electronically filed with, or furnished to, the SEC, including our annual and quarterly reports on Forms 10-K and 10-Q and current reports on Form 8-K, our proxy statements, and any amendments to those reports. All such information is available free of charge. Our Investor Relations website allows interested persons to sign up to automatically receive e-mail alerts when we post financial information and issue press releases, and to receive information about upcoming events. We encourage interested persons to follow our Investor Relations website in addition to our filings with the SEC to timely receive information about the company.
We are a global designer and manufacturer of semiconductor products. The CPUs and other semiconductor solutions that we design, manufacture, market, sell and service are incorporated in computing and related end products and services, and utilized globally by consumers, enterprises, governments and educational organizations. Our customers primarily include OEMs, ODMs, CSPs, and other manufacturers and service providers, such as industrial and communication equipment manufacturers. We market and sell our products through a combination of direct sales through our global sales organization and indirect channels, including distributors, resellers, retailers and OEM partners.
As a U.S.-based integrated design manufacturer, or IDM, in addition to designing CPUs and other semiconductor products, we develop leading-edge semiconductor manufacturing process technologies, or nodes, and advanced packaging technologies and predominantly manufacture our semiconductor products at our manufacturing and assembly and test facilities, many of which are in the U.S. We are the only company undertaking research, design and development of leading-edge and next generation semiconductor manufacturing technologies and high-volume manufacturing of logic semiconductors utilizing leading-edge nodes in the U.S., making us a strategically important company from both a national economic and national security perspective. In addition to manufacturing our own products, we offer third-party foundry services to external customers and aim to establish this business as a leading external foundry.
For more than 50 years, we have contributed to the advancement of computing technology that powers the digital world. Building on our legacy of innovation, we are focused on transforming our business to meet the demands of a rapidly evolving technology landscape. The pace of technological change, dynamic customer needs and intensifying competition continue to shape the semiconductor industry. A secure, resilient and balanced semiconductor supply chain has become increasingly important to maintaining continuity of operations for global enterprises, governments and consumers, while meeting global demand in an uncertain and rapidly changing world.
We aim to build a new Intel for the future, undertaking an enterprise-wide transformation to strengthen execution, enhance innovation and better position our products and offerings in the complex, highly competitive and rapidly evolving technology landscape. In 2025 and recent years, the semiconductor industry has experienced momentum driven by the following:
▪significantly increased compute demand, particularly for GPU systems, driven by generative AI workloads;
▪an expansion in the types of AI workloads as AI technologies are adopted across industries and applications;
▪a PC market driven by user refreshes that resulted from expanding AI capabilities, end-of-support for Windows 10 and aging devices from the COVID era; and
▪increased demand for secure and geographically diversified supply chains in a period of increased geopolitical tensions.
We expect these trends to continue in 2026 and future years, with continuing rapid adoption of AI technologies across an increasing number of industries and applications driving demand across a full spectrum of AI workloads, including generative AI, AI inference, agentic AI and physical AI, from traditional and AI data centers to network and enterprise environments and client and edge. We believe AI represents a generational shift in computing requiring a range of compute silicon, including GPUs, ASICs, CPUs and xPUs. Our multi-year strategy is designed to enable us to participate in the expanding market and increase in compute demand through our products and our foundry capabilities, including wafer manufacturing and advanced packaging. Our strategy is centered on four core priorities:
▪Transforming our culture to become an engineering-focused, customer-centric organization that prioritizes decisive actions, disciplined execution and strong financial management;
▪Revitalizing the x86 ecosystem that for decades has been our foundation of leadership, adapting and advancing our x86 product offerings to support current and next-generation AI workloads, supported by our U.S.-based leading-edge semiconductor process technology R&D and manufacturing and advanced packaging capabilities;
▪Growing our external foundry business where we aim to leverage our U.S.-based capabilities in leading-edge semiconductor process technology R&D and manufacturing and advanced packaging to become a trusted foundry partner to third-party semiconductor customers and to financially support our continued investment in capital-intensive, U.S.-based, leading-edge R&D and manufacturing; and
▪Expanding our market opportunities by leveraging our engineering and design expertise to develop purpose-built ASICs and GPUs for customers to address the increasing diversity of AI-driven compute workloads.
| | | | | | | | |
| Overview and Our Strategy | 3 |
Our Priorities
We are undertaking an enterprise-wide cultural transformation aimed at reestablishing engineering excellence, developing a customer-centric mindset, prioritizing decisive action and disciplined execution and restoring strong financial management. In 2025, we simplified our organizational structure, reduced management layers and empowered technical teams to accelerate decision-making and innovation. These changes are intended to increase transparency and accountability, improve operational efficiency, reduce barriers to collaboration and product development and lower expenses. We also implemented a disciplined financial approach to support our strategic priorities. We are better aligning capital investments with business objectives and customer demand signals, and we continued to monetize non-core assets. These actions are designed to shift us toward a more agile and focused operating model, improve resource allocation and support long-term value creation for customers, partners and stockholders. While our cultural transformation is ongoing, we believe these changes represent foundational steps to position us for sustained performance and competitiveness.
| | |
|
Revitalizing the x86 Ecosystem |
Our x86 architecture and related CPU offerings have served as a foundational computing platform for over four decades, supporting a broad range of client and data center applications and enabling a heterogeneous environment from which a deep and extensive software ecosystem has developed. The widespread adoption of our x86 architecture and related CPU offerings and established software ecosystem continues to provide interoperability and performance across diverse workloads. We remain focused on adapting and advancing our x86 product portfolio to meet evolving market needs, including those driven by inference AI, agentic AI and physical AI. In 2025, we introduced new x86 solutions tailored to client and data center platforms, including our next generation client CPU code named Panther Lake, which is designed to combine improved power efficiency and performance to support next-generation AI-enabled workloads at the edge. We also announced a strategic partnership with NVIDIA to co-develop custom client and data center products combining our x86 CPU technologies with NVIDIA's AI and accelerated computing capabilities. The collaboration is intended to jointly develop multiple generations of products for hyperscale, enterprise and consumer markets based on the x86 architecture.
We pair our x86 CPUs with GPUs, IPUs, NPUs and other accelerators designed to optimize performance across a range of workloads. This heterogeneous approach enables us to deliver compute platforms that match the specific requirements of inference, training and orchestration tasks. In our Client Computing Group (CCG) business, we are enabling AI capabilities across PCs, workstations and edge devices, supported by deep ecosystem partnerships. In our Data Center and AI (DCAI) business, our full-stack AI strategy integrates x86 CPUs with accelerators and custom silicon to support scalable, reliable and cost-efficient infrastructure.
The competitiveness of our product offerings depend on access to manufacturing capacity on leading-edge nodes and advanced packaging. Throughout the history of the company, we have invested significant capital resources to continually develop new generations of leading-edge nodes and build manufacturing capacity to produce semiconductor logic chips utilizing such nodes. Our relentless pursuit to improve the performance, power efficiency and cost-effectiveness of the semiconductor manufacturing process has enabled us to reduce the cost of a semiconductor logic chip by shrinking its size or increasing its functionality and performance while maintaining cost competitiveness through higher transistor density. Our continued pursuit of such improvements is essential to our ability to continue to manufacture products that meet evolving customer requirements across computing segments, and we have made substantial progress in the last few years towards reestablishing the competitiveness of our manufacturing process technologies. In 2025, we released our initial Intel Core Ultra Series 3 processors, the first products to be manufactured using our new Intel 18A process technology. Intel 18A introduces two industry firsts in high-volume semiconductor manufacturing: gate-all-around transistors (RibbonFET) and backside power delivery (PowerVia). We expect Intel 18A to serve as the manufacturing process for multiple generations of our future client and server CPU products. We are also continuing development of Intel 14A, our next-generation node, which has been designed from inception as an offering to external customers. Intel 14A builds upon the architectural innovations of Intel 18A to deliver further improvements in performance per watt and density scaling.
We remain committed to advancing leading-edge semiconductor process technology and manufacturing in the U.S., where we are the only company conducting both leading-edge semiconductor logic R&D and related high-volume manufacturing. We intend to remain a leading developer of semiconductor process technology and a major manufacturer of semiconductors, and we plan to continue manufacturing the majority of our products in our own factories. This integrated approach helps enable us to optimize product performance, accelerate time-to-market and scale efficiently to meet customer demand. It also provides strategic control over manufacturing operations, supports differentiation in process technology capabilities and advanced packaging, provides increased supply resilience and reinforces our role as a U.S.-based provider of leading-edge semiconductor manufacturing. However, the development and manufacturing of modern leading-edge process technologies, particularly those utilizing EUV lithography such as Intel 4, Intel 3, Intel 18A, Intel 14A and future nodes, require substantial capital investment. These leading-edge process technologies are essential to deliver competitive products, but their cost structure requires manufacturing volumes beyond what we expect from our own products to achieve economic efficiency. In light of these considerations, in 2025, we streamlined our footprint to improve operational efficiency and better align capacity with anticipated demand. We initiated the consolidation of our Costa Rican assembly and test operations into our other facilities, which we expect to be completed by the end of 2026, slowed the pace of construction for our new Ohio wafer fabrication facility, or fab, and discontinued planned expansions in Germany (fab) and Poland (assembly and test facility). Further, we announced that if we are unable to secure a significant external foundry customer for Intel 14A, we may pause or discontinue our pursuit of Intel 14A and successor leading-edge process technologies. In such event, we would expect, over time, to shift manufacturing to third-party foundries, particularly TSMC, as we develop products for nodes beyond Intel 18A and its derivative node, Intel 18A-P.
| | | | |
Growing Our External Foundry Business | | |
In recent years, the cost of developing leading-edge semiconductor process technologies and of the manufacturing facilities utilizing such process technologies has increased significantly and outpaced the growth in our products business. As a result, to improve the financial viability of our continued development of leading-edge semiconductor process technologies and the utilization of our manufacturing assets, a few years ago we started transitioning our semiconductor manufacturing business from one that has historically been designed to serve our internal product groups into a customer-centric foundry business designed to also serve third-party external semiconductor customers. Our foundry strategy was also designed to enable us to participate in the increasing demand for U.S.-based foundry capacity and a more secure, resilient and balanced semiconductor supply chain. Since that decision, demand for leading-edge foundry capacity has increased significantly to support the demand for compute, particularly from AI workloads, and we expect continued increases in such demand in future years. While we have few external customers to date, developing an external foundry business is a key long-term strategy for our business and one that we aim to have more success with as we move to more advanced nodes.An external foundry business is built on the principle of trust. We recognize that delivering high-quality, reliable and high-yield manufacturing services is essential to earning and retaining external foundry customers. Our foundry offerings include four components: wafer fabrication, advanced packaging, chiplet integration and design enablement services. In 2025, we ramped Intel 18A into high-volume production and are seeking to establish it as our first significant node for government and enterprise foundry customers. We enhanced operational processes and quality systems to meet the rigorous standards expected in the foundry industry, and continued investing in ecosystem enablement to make our manufacturing network accessible to third-party external customers, including support for industry-standard EDA tools, process design kits and a broad portfolio of foundation IP that customers can utilize as a part of their designs. We are actively seeking customers for our future Intel 14A node, which is our first node designed from inception as an offering to external customers.
| | | | |
Expanding Our Market Opportunities | | |
We aim to leverage our engineering and design expertise to develop purpose-built ASICs and GPUs for customers to address the expanding variety of AI-driven compute workloads. In 2025, we unified our horizontal engineering functions into a central engineering group to drive efficiencies across foundational IP development, test chip design, EDA tools and design platforms to help us deliver the combination of infrastructure and software needed for agentic AI workloads, which require integration across multiple models and compute types. With this new internal consolidation of capabilities, we also aim to develop an ASICs and design services business to deliver purpose-built silicon for a broad range of external customers. The goal is to both extend the reach of our core x86 IP and leverage our design strengths to deliver an array of solutions from general purpose to workload-optimized computing. Inference AI, agentic AI and physical AI workloads are rapidly emerging areas that we expect may ultimately represent larger market opportunities than the generative AI workloads that have been the core area of AI technology growth over the last few years. We aim to partner with an array of incumbent and developing companies defining these emerging areas and position our x86 platform to be their platform of choice. We also aim to participate in these emerging areas through our continued development of our Xeon, AI PCs, Arc GPUs and our open software stack, as well as by developing successive generations of inference-optimized GPUs on a targeted annual cadence that feature enhanced memory and bandwidth to meet enterprise needs.
Finally, our strategy includes combining our IP and SoC development capabilities with our leading-edge manufacturing know-how to provide differentiated and full-service semiconductor solutions.
We are a global leader in the design and manufacturing of CPUs and other semiconductor products. Our products are designed and marketed by our Intel Products business, which includes our CCG and DCAI operating segments, and are manufactured by our Intel Foundry operating segment and third-party suppliers. Our Intel Foundry operating segment also offers semiconductor design and manufacturing services to external customers. We leverage our talent, IP, manufacturing assets and other resources to run our business and execute our strategic priorities.
We report our business results in three reportable segments: CCG, DCAI and Intel Foundry. In addition to these reportable segments, we present an "all other" category, which is not a reportable segment. On September 12, 2025, we completed the divestiture of 51% of Altera. As of that date, Altera's results of operations were no longer included in our consolidated or segment results. Altera's financial results were reported within our "all other" category for all periods presented through September 11, 2025. There are no changes to our Consolidated Financial Statements or segment results for any prior periods resulting from the Altera transaction, which is further described below.
Intel Products
Intel Products consists substantially of the design, development, marketing, sale, support and servicing of CPUs and related products. Intel Products is composed of two operating segments: CCG and DCAI.
CCG
Overview
CCG delivers platforms and processors that power PCs and edge devices, enabling enhanced performance, connectivity and user experiences for consumer and commercial markets, with capabilities that also support retail, industrial robotics and AI ecosystems at the edge. Our direct customers include distributors and OEMs that design and sell PCs and related devices. Our platforms and processors are included in products sold to consumers and to commercial enterprises across industries such as education, healthcare, finance and government. We address demand for desktops, notebooks and emerging AI PCs, while expanding into edge computing markets through partnerships with solution providers and independent software vendors.
Market Trends
The PC market in 2025 was driven by a hardware refresh cycle, increased demand for and adoption of AI PCs and expanding PC adoption outside the U.S. End-of-support for Windows 10 and aging devices from the COVID era drove PC refresh activity, while the introduction of AI PC capabilities also contributed to higher demand. Individual users sought powerful, energy-efficient systems for productivity and entertainment, while enterprises modernized fleets to improve employee productivity and security. Additionally, educational institutions increased PC adoption, particularly in international markets. We believe AI integration will remain a key differentiator, and we are aiming to address these trends through our latest and future generations of Intel Core Ultra processors designed to enable advanced AI capabilities and high performance.
Competition
CCG's primary competitor is AMD, which like us designs processors based on the x86 architecture. Client CPUs utilizing the x86 architecture remain the foundational computing platform for the majority of PCs, enabling a heterogeneous environment from which a deep and extensive software ecosystem has developed. We also face significant competition from companies that design processors based on the ARM architecture, such as Apple with its M series products, Qualcomm with its Snapdragon products and MediaTek with its Kompanio products. We operate in a highly competitive market and expect this environment to further intensify in 2026.
DCAI
Overview
DCAI delivers workload-optimized solutions based upon our x86 architecture for data centers, including CPUs, AI accelerators, NICs, IPUs, and custom ASICs, enabling performance and scalability for cloud, enterprise, telecommunication and HPC environments. Our direct customers include global CSP/hyperscalers and OEMs. Our OEM customers, in turn, sell to multinational corporations, small- and medium-sized enterprises, independent hardware and software vendors, systems integrators, communications service providers and government entities. Our DCAI offerings are designed to support key workloads such as AI, analytics and networking and edge computing through a combination of hardware and software offerings.
Market Trends
The data center market in 2025, consistent with the last few years, was driven by rapid growth in data generation and widespread adoption of AI across industries. AI workloads, spanning enterprise data centers to edge environments, have driven increased demand for power-efficient infrastructure and low-latency performance as automation continues to expand within business operations. Organizations sought scalable, secure and energy-efficient solutions to manage rising complexity and performance needs, prioritizing GPU systems offered by certain of our competitors to handle compute-heavy generative AI workloads, often at the expense of CPU investment. In addition, competition in the data center CPU market in which we compete remained intense. We believe system-level integration of hardware and software will continue to be essential, and we intend to address these trends through product development investments in heterogeneous compute, networking, memory technologies and open standards to enable capabilities such as AI to be deployed at scale.
Competition
DCAI competitors include AMD, which utilizes the x86 architecture and competes with us across the full spectrum of CPUs, GPUs, accelerators and other products; providers of GPU systems such as NVIDIA, whose GPU systems have experienced the highest demand in the market as AI workloads have become the dominant source of compute demand; companies developing their own custom silicon, including many hyperscalers such as Amazon, Google, Meta and Microsoft; and both new entrants and incumbents developing ARM- and RISC-V-based products tailored to specific data center and AI workloads. We also compete with Broadcom in the custom ASICs development market. We expect this competitive landscape to continue to evolve and to become increasingly intense.
Intel Foundry
Overview
Intel Foundry, comprised of technology development, manufacturing and foundry services, develops new leading-edge semiconductor process technologies and advanced packaging technologies and provides manufacturing, assembly and test and advanced packaging capacity and design enablement solutions across multiple nodes and platforms. We continue to innovate and advance leading-edge semiconductor process technology and manufacturing in the U.S., where we are the only company conducting both leading-edge logic R&D and high-volume manufacturing. We believe our foundry offerings benefit from our systems-of-chips capabilities, U.S.-based manufacturing leadership and global operational scale, supported by a robust design ecosystem. At present, nearly all of our Intel Foundry business supports internal manufacturing for Intel Products; however, we are offering our Intel Foundry services to external customers and aim to develop a more significant external foundry business in the future.
Market Trends
In 2025, the semiconductor foundry market was shaped by rapid growth in AI and high-performance computing workloads. These applications drove demand for higher computational performance and greater power efficiency, accelerating a shift in semiconductor designs from traditional monolithic chips to disaggregated architectures built on interconnected chiplets optimized for specific workloads and integrated through advanced packaging technologies to support increasingly complex systems. At the same time, customers and manufacturers are reconfiguring supply chains to enhance resiliency.
The capital intensity of leading-edge semiconductor manufacturing has increased significantly in recent years, particularly with advanced nodes utilizing EUV lithography, limiting competition to only a few manufacturers with sufficient scale. Historically, improvements in performance, power efficiency and cost-effectiveness were achieved primarily through transistor scaling to increase density. While scaling continues at advanced nodes, manufacturers now complement it with innovations such as advanced packaging, chiplet architectures and new transistor designs to deliver additional performance and efficiency gains. We believe we are one of three companies (the others being TSMC and Samsung) investing in 2nm lithography and next-generation transistor architectures to deliver continued improvements in performance and efficiency for semiconductor logic chips. Leading-edge foundries seek to amortize these investments over extended periods, initially seeking to maximize volume and pricing on leading-edge designs that benefit from the most performant transistors and later prioritizing ease of design and cost optimization as technologies mature. We intend to address these trends through continued investment in our leading-edge process technologies, packaging innovation and ecosystem partnerships to enable next-generation compute solutions.
Competition
Intel Foundry competitors include semiconductor foundries that deliver wafers and packaging technologies from fabrication plants located primarily in Asia. Our primary competitor in leading-edge semiconductor process technology is TSMC, which holds a leading position in manufacturing at scale for the most advanced nodes. We also compete directly with Samsung in this market. Other Intel Foundry competitors include GlobalFoundries, UMC and SMIC, which primarily focus on mature process technologies.
All Other
Our "all other" category includes the results of operations from non-reportable segments, start-up businesses that support our initiatives, and historical results of operations from divested businesses. A summary of the largest businesses within this category for 2025, 2024 and 2023 includes:
▪Mobileye, a publicly-traded company and a global leader in driving assistance and self-driving solutions with a product portfolio designed to encompass the entire stack required for assisted and autonomous driving, including compute platforms, computer vision and machine learning-based perception, mapping and localization, driving policy and active sensors in development. As of December 27, 2025, we continued to consolidate Mobileye and held equity interests representing an 80% ownership interest in Mobileye;
▪IMS, which specializes in developing and manufacturing multi-beam mask writing tools. As of December 27, 2025, we continued to consolidate IMS and held equity interests representing a 68% ownership interest in IMS; and
▪Altera, which was previously a wholly-owned subsidiary, was deconsolidated from our Consolidated Financial Statements effective September 12, 2025 following the closing of our sale of 51% of Altera's issued and outstanding common stock. Altera's financial results of operations were included in our "all other" category through September 11, 2025. As of and after September 12, 2025, our retained non-marketable equity interest in Altera is accounted for as an equity method investment. See "Note 10: Acquisitions and Divestitures" within Notes to Consolidated Financial Statements for further information.
Our CPUs and other semiconductor offerings utilize our x86 architecture and are designed, marketed, sold and supported by our CCG and DCAI operating segments. Our products are incorporated into various computing form factors and address a variety of computing workloads, scaling from PC to data center, network, edge computing and AI applications.
We are intensely focused on maintaining and enhancing the competitiveness of our products, which is key to the long-term success of our business. Our objective with each new generation of products is to deliver improved user experiences and value through advances in performance, power efficiency, cost, connectivity, security, form factor and other features. We also endeavor to reduce design complexity, reuse IP and increase ecosystem collaboration to improve efficiency and accelerate innovation.
x86 Architecture and Ecosystem
Our x86 architecture remains foundational to our CCG and DCAI product portfolios, and we continue to enhance it to deliver performance, energy efficiency, compatibility and scalability across our client and data center offerings including those for PCs, edge devices, data centers and AI workloads. Developers and others have utilized our x86 architecture for decades to build and optimize a vast ecosystem of compatible software, tools and related applications that are used by consumers, enterprises, governments and educational institutions globally. Investments in x86 innovation, such as advanced microarchitectures, power optimizations and security features, help maintain x86 CPUs as a core component of heterogeneous computing environments and provide a strong base for emerging workloads, including AI-driven applications.
xPU and AI Accelerators
We believe the future of computing lies in complex systems utilizing a diverse mix of scalar, vector, matrix and spatial architectures deployed in CPUs, GPUs, NPUs, IPUs and accelerators, which we refer to generally as xPUs, supported by a scalable software stack and integrated through advanced packaging technologies. This approach is designed to address AI, analytics and high-performance workloads. In support of this approach, we are developing processors that incorporate multiple computing architectures, moving toward heterogeneous computing where x86 CPUs operate alongside specialized AI engines to support performance for inference, training and emerging agentic AI models.
Key Products
We derived most of our consolidated revenue in 2025, 2024 and 2023 from our CCG and DCAI product offerings.
CCG
The key product offerings of our CCG operating segment are as follows:
▪Client CPUs. Our client CPUs are offered in a broad range of configurations to appeal to different consumer applications and price points. They are generally offered to customers in the form of a system-on-chip, or SoC, with the primary CPU compute chip combined with a controller and memory hub and GPU, NPU, IPU or other accelerator chips enabling additional capabilities. They are currently grouped broadly into two product families:
▪Intel Core. Our Intel Core brands have been staples of the PC industry for nearly two decades. These products are designed to serve a broad cross-section of the customer and computing needs in the client market, including laptops, desktops and edge devices, at entry-level to mid-level price points. These products are manufactured on our Intel 7 process technology and represented almost half of our CCG product sales by revenue in 2025, with their percentage contribution expected to decrease significantly in 2026 as sales of Intel Core Ultra processors increase.
▪Intel Core Ultra. Our Intel Core Ultra family is designed for higher performance to serve a wide variety of both PC and edge applications across consumer and commercial segments at higher-level price points.
▪Series 1. The Intel Core Ultra Series 1 products, manufactured using our Intel 4 process, introduced the first AI PCs to the market in 2023.
▪Series 2. Our first Intel Core Ultra Series 2 products, the 200V Series, were brought to market in 2024. The Intel Core Ultra 200V Series leverages our Xe2 GPU architecture, bringing improved efficiency, second-generation ray tracing units and XMX AI acceleration to the premium market for thin and light notebooks. In 2025, we introduced a desktop version of the Intel Core Ultra Series 2 for a wide variety of applications, from gaming to enterprise. Intel Core Ultra Series 2 features the first implementation of an NPU and Foveros advanced packaging technologies in desktop microprocessors. Manufacturing of our Intel Core Ultra Series 2 products is performed by Intel Foundry using our Intel 3 process technology or by an external foundry, depending on the version.
▪Series 3. We released our initial Intel Core Ultra Series 3 processors, the first products to be manufactured using our new Intel 18A process technology, in late 2025. These new mobile processors offer further improved CPU, AI and graphics performance while maintaining power efficiency.
▪Commercial CPUs. We offer chipsets and versions of our client CPUs, including our Intel vPro® Platform, to commercial customers with additional hardware features enabled, enhanced firmware controls and an enterprise-grade software stack. In 2025, we introduced Intel vPro Fleet Services, a new remote manageability capability that provides increased resilience and automation, helping minimize downtime and enhance proactive control over PC fleets. In the commercial area, we are working with partners to enable new AI software capabilities on PCs in the enterprise environment.
▪Discrete Client GPUs. Our Intel® Arc™ graphics family is primarily designed for consumer and gaming PCs, offering modern GPU features to power immersive games, creator applications and AI workloads. In 2024, we launched the Intel Arc B-Series based on the latest Xe2 GPU architecture, delivering significantly improved performance and power efficiency over our Intel Arc A-Series.
▪Edge Computing. We offer versions of our client CPUs, including both Intel Core and Intel Core Ultra processors, to customers for various edge computing applications across a range of industries, including manufacturing, healthcare, retail and education. In 2025, we introduced an open software platform, Open Edge, designed to make it easier for businesses to run AI and other applications at the edge and accelerate AI deployments within the x86 edge ecosystem.
▪Connectivity. We offer wireless (Wi-Fi, Bluetooth) and wired (Thunderbolt, Ethernet) products for PCs and edge systems. In 2025, we launched our third-generation Wi-Fi 7 and Bluetooth 6 solutions and updated our Thunderbolt 5 solution for our latest platforms and accessories.
Our software portfolio supports the functionality and optimization of our hardware platforms across workloads and architectures. We provide support for AI frameworks such as PyTorch, TensorFlow, Hugging Face, vLLM, and WebNN for execution on CPUs, GPUs and accelerators.
DCAI
The key product offerings of our DCAI operating segment are as follows:
▪Server CPUs. Intel’s data center business is anchored by the Intel® Xeon® series of processors, a family of x86-based server and network CPUs that for decades have provided foundational compute for data center, cloud, networking and intelligent edge deployments. The Intel Xeon installed base represents a significant portion of global server infrastructure, and this scale, combined with our broader portfolio of accelerators, networking solutions and software, positions Intel Xeon processors as a central category to enable AI and other data-intensive workloads from cloud to edge. In 2025, sales were distributed across four generations of Intel Xeon processors:
▪Intel Xeon Scalable Processors. 3rd, 4th and 5th Gen Intel Xeon Scalable processors are manufactured using our Intel 7 process technology, represented a majority of DCAI product sales by revenue in 2025 and are expected to be a somewhat smaller majority of our DCAI product sales by revenue in 2026.
▪3rd Gen. The 3rd Gen Intel Xeon Scalable processors, introduced in 2021, incorporate enhanced security features such as Intel® Software Guard Extensions (SGX) for confidential computing and Intel® Crypto Acceleration for faster encryption.
▪4th Gen. The 4th Gen Intel Xeon Scalable processors, introduced in early 2023, incorporate a multi-die design connected using Embedded Multi-die Interconnect Bridge (EMIB) technology. These processors include numerous integrated workload-specific accelerators, including Intel® Advanced Matrix Extensions (Intel® AMX), significantly boosting performance for AI versus the prior generation. Compute Express Link (CXL), an open, industry-standard interconnect designed to extend memory and enable cache-coherent communication, was introduced with this generation along with DDR5 memory and PCIe Gen 5 for higher memory and I/O bandwidth.
▪5th Gen. The 5th Gen Intel Xeon Scalable processors, introduced in late 2023, utilize the same platform as the 4th Gen processors but provide improved overall performance and performance per watt with faster DDR5 memory, larger last-level cache, and faster chip-to-chip communication. This generation further extended the confidential computing capabilities versus prior generations with Intel® Trust Domain Extensions (Intel® TDX) support for hardware-isolated virtual machines.
▪Intel Xeon 6. Introduced in 2024 with higher core counts, these latest generation processors are designed to excel in both performance and efficiency to meet the evolving demands of modern data centers. In 2025, we expanded the family with additional processors and platforms optimized for AI, networking and general-purpose data center workloads, broadening performance, efficiency and deployment options across enterprise, telecommunications and cloud use cases. The Intel Xeon 6 family features two distinct microarchitectures:
▪Performance-cores (P-cores) for compute-intensive, workloads such as AI and HPC; and
▪Efficient-cores (E-cores) for high-density compute and scale-out workloads such as microservices and cloud-native applications.
With an innovative modular x86 architecture, the compute die for Intel Xeon 6 series processors are manufactured using our Intel 3 process technology while the I/O dies are manufactured on our Intel 7 process technology and connected in a single package utilizing EMIB technology. Intel Xeon 6 improves memory throughput with the fastest DDR5 memory available, including Multiplexed Rank DIMM (MRDIMM) support. To address key market requirements for AI compute and data protection, Intel Xeon 6 processors incorporate differentiated features such as Intel AMX for AI, Intel® QuickAssist Technology (Intel® QAT) for cryptography and compression offload, and Intel TDX for hardware-based security. Intel Xeon 6 is available in multiple series (6300, 6500, 6700, 6900) supporting a range of workloads designed to enable data center architects to optimize infrastructure for private, public and hybrid clouds.
▪Discrete GPUs: In 2025, as part of our revised AI strategy to develop successive generations of inference-optimized GPUs on a targeted annual cadence featuring enhanced bandwidth and memory to meet enterprise needs, we announced our development of Crescent Island, our first GPU to be built on the advanced Xe3P architecture. Crescent Island is being engineered specifically for data center environments, with a strong emphasis on low power consumption, high throughput and optimized performance for AI inference workloads. Our aim is for it to be a significant step forward in delivering efficient, scalable AI solutions for modern data center needs.
We are also continuing to develop our next-generation GPU architecture, Jaguar Shores, which is designed to further enhance AI workload capabilities. With Jaguar Shores, we will aim to provide customers with greater flexibility and scalability for demanding AI applications.
▪Networking: Our core networking portfolio centers on Ethernet controllers and network adapters that deliver connectivity for servers, storage, network appliances in cloud, enterprise IT and telecom data centers. An Ethernet controller’s primary function is to manage network connectivity. It handles sending and receiving data packets over wired networks, offloads network processing tasks from the CPU, and is responsible for efficient, low-latency communication between devices. Our Ethernet products complement our Intel Xeon processors - the processors run the workloads, and the Ethernet controller moves the data efficiently across networks. Our Ethernet product lines, including Intel Ethernet Controllers & Network Adapters of E800 series and E600 series, support advanced features like RDMA, precision timing, hardware-based security and programmable packet processing for Network Functions Virtualization, storage, HPC and AI workloads. Additionally, our infrastructure processing units (IPUs) provide programmable networking capabilities, reducing CPU overhead and improving overall system efficiency. The IPUs are manufactured at an external foundry, on process nodes that vary by product. Alongside hardware, we provide software frameworks that are designed to integrate tightly with our networking silicon to improve throughput, latency and scalability. We continue to drive the transformation from fixed-function networks onto Intel Xeon processors coupled with our FlexCore and FlexRAN™ software. Our software-based cloud RAN Platform is designed to allow operators to deploy the fastest cloud-native 5G infrastructure quickly and efficiently to meet the needs of their end customers.
Our software portfolio is a key differentiator for our DCAI business, enabling customers to unlock the full potential of our platforms across cloud, edge, and enterprise deployments. In 2025, we accelerated delivery of data center software and developer tools, focusing on AI, HPC, and platform optimization. In addition, we expanded support for leading AI frameworks—including PyTorch, TensorFlow, Hugging Face, and vLLM—optimized for our server CPUs, GPUs and accelerators.
Disaggregated Architecture and Supply Chain
We have adopted a disaggregated design architecture for most of our newer and higher-end products, including all of our current Intel Core Ultra products and server CPUs, as well as a number of our future products, in which a number of chips, or tiles, are integrated into a single product using advanced packaging technologies. This approach provides flexibility in design where each tile can be manufactured utilizing the most appropriate semiconductor manufacturing process technology based on performance, cost and other considerations. It also allows for the use of smaller tiles, which increases yield in the manufacturing process, and more flexibility in the mixing of tiles to provide a wider range of products tailored to customer needs. This approach, however, introduces new areas of complexity in design and manufacturability, particularly in the deployment of advanced packaging technologies, and increases costs as compared to the monolithic architectures using a single primary tile. In addition, a disaggregated approach often requires advanced substrates and other materials that can create additional manufacturing challenges when supply is constrained, as is the situation currently.
Our product offerings are predominantly manufactured in our own facilities, located in the U.S. and internationally, using our proprietary process technologies. In recent years, however, we have also strategically utilized third-party foundry manufacturing capacity, including at one of our key foundry competitors, TSMC, for various tiles or an entire product where advantageous for cost, performance, schedule or other considerations. This approach provides flexibility and scale, including in recent years the ability to offer products at the most performant end of the spectrum where comparable internal process technologies were not yet available. We expect to continue to use TSMC and other third-party foundry suppliers for various key tiles in a number of current and future products.
We manufacture the majority of our CCG and DCAI semiconductor products internally and market semiconductor manufacturing offerings to external customers through our Intel Foundry business, which is comprised of our technology development, manufacturing and foundry services groups. We are one of only a few companies in the world with the process technology and manufacturing capabilities required to produce leading-edge semiconductor logic chips, and we are the only company that conducts both leading-edge logic semiconductor process technology R&D and manufacturing in the U.S.
The manufacture of semiconductor products has two primary steps:
▪wafer fabrication, which takes place in the clean rooms of our fabs, whereby a semiconductor chip design is implemented in silicon wafers using the process technology node for which a chip has been designed and the fab has been equipped to implement. Intel Foundry’s process technologies are differentiated from one another and the process technologies of competing foundries based upon the characteristics of the node, including performance, power efficiency, and cost-effectiveness, and generally improve with each successive node. Each process technology node is developed, tested, ramped to high-volume production and continuously optimized; and
▪packaging, assembly and test, which typically takes place in other dedicated facilities, whereby the individual semiconductor chips, or die, are separated from the silicon wafer, assembled with any other die needed to complete the product or system, and packaged into a product for customers, with testing at multiple steps in the process. With the increased industry use of disaggregated design architectures utilizing interconnected chiplets optimized for specific workloads, we have developed a variety of advanced packaging techniques that we implement in some of our facilities to enable increasingly complex systems.
Nearly all of our foundry manufacturing capacity is dedicated to manufacturing our CCG and DCAI semiconductor products. However, one of our core strategic priorities is to leverage our U.S.-based capabilities in leading-edge semiconductor process technology development and manufacturing and advanced packaging to become a trusted foundry partner to third-party semiconductor customers. Potential customers include traditional fabless semiconductor companies in the computing, smartphone, cloud services, automotive, communications, aerospace and defense markets, as well as hyperscalers and the U.S. government. Our foundry offerings provide these external organizations with the ability to design and manufacture their semiconductor products using our process technologies and related packaging, assembly and test services, and also enable customers to utilize our advanced packaging services for wafers produced by other foundries. In 2024, we announced a strategic collaboration with UMC to develop a 12 nm process platform that expands our mature‑node process portfolio and strengthens our U.S.-based manufacturing foundry capabilities, with production expected to begin in 2027.
Semiconductor manufacturing of leading-edge semiconductors is highly capital intensive, particularly the R&D for next generation nodes and the node development, testing and ramping to high-volume production, as well as building the manufacturing facilities needed for high-volume production, including both the facility shells and the advanced production tools. Investments are required years in advance of a return, and achieving favorable returns generally requires that a node be continually optimized over a long lifespan. Our external foundry strategy is driven by a need for additional volume for leading-edge node development and manufacturing capacity from customers seeking leading-edge capacity, beyond that of our products group, as well as a need for external customers for established node manufacturing capacity to extend the lifespan of such capacity as our product groups move to more advanced nodes.
Process Technology
Our technology development group, with its R&D, fabs and other manufacturing facilities in Oregon, designs and develops each new process technology node from conception to high-volume production and supports the gradual transition of high-volume production to one of our other high-volume manufacturing sites. The continued development of leading-edge nodes that are competitive with the offerings of other foundries requires significant ongoing capital investment as we pursue incremental improvements and refinements of existing transistor and layout designs and manufacturing technologies, such as EUV lithography, while also pursuing new transistor and layout designs, such as gate-all-around and backside power in our Intel 18A process node and new manufacturing technologies, such as high-NA EUV lithography for use in the development of our Intel 14A process node. Where we historically moved quickly from node to node and did not make significant changes to nodes once they were in high-volume production, with the significantly higher capital intensity of semiconductor manufacturing in recent years and intense competitive environment, we have shifted our approach and now aim to extend the lifespan of each node and continuously improve yields of products being manufactured on each node through continued development and optimization. Through such continuous improvements, finding additional uses of older nodes for our products (including through our disaggregated architecture approach), and seeking external customers for older nodes through our external foundry strategy, we aim to extend the utilization of our manufacturing asset base.
Our leading-edge process technology, which we use to manufacture our CCG and DCAI product offerings and also offer to external customers, is an important tenet of our strategy. Our principal current and planned future nodes consist of the following:
▪Intel 7, which first went into high-volume manufacturing in 2017 and has undergone a number of enhancements over its lifespan, continues in production for our 13th and 14th Gen Intel Core processors. Intel 7 was utilized for the majority of our internal processor production and products by revenue in 2025 and is expected to continue to be utilized for almost half of our internal processor production and products by revenue in 2026.
▪Intel 4, our first process node incorporating EUV lithography, first went into high-volume manufacturing in 2023 and delivered significant scaling improvements over Intel 7. Intel 4 is utilized for our internal production of Intel Core Ultra Series 1 processors and represented a modest portion of our internal processor production and products by revenue in 2025, with its percentage contribution expected to decrease in 2026 as sales of processors using more advanced process technologies increase.
▪Intel 3, a derivative node of Intel 4 that delivers enhanced performance over Intel 4, first went into high-volume manufacturing in 2024. Intel Xeon 6 Scalable server processor offerings are manufactured using this node. This node represented a modest portion of our internal processor production and products by revenue in 2025, with its percentage contribution expected to increase in 2026.
▪Intel 18A, currently our most advanced leading-edge node, first went into high-volume manufacturing in late 2025 and delivers significant improvements in performance per watt and density scaling over Intel 3. Intel 18A introduced two breakthrough technologies: RibbonFET and PowerVia. RibbonFET, our implementation of a gate-all-around transistor, is designed to deliver faster transistor switching speeds while achieving the same drive current as multiple fins of prior finFET transistor architectures, but in a smaller footprint. PowerVia is our unique industry-first implementation of backside power delivery that is designed to optimize signal transmission by eliminating the need for power routing on the front side of the wafer. Intel 18A is utilized for our first Intel Core Ultra Series 3 processor, the latest generation of our Intel Core Ultra processor family, and is expected to represent an increasing portion of our processor production and products by revenue in 2026 and subsequent years. We expect Intel 18A and its derivative nodes, notably Intel 18A-P, to be the key manufacturing process technology for multiple generations of our future client and server CPU products. We are seeking to establish Intel 18A as our first significant foundry node for government and commercial customers.
▪Intel 14A, our next-generation leading-edge node, is being designed to potentially incorporate an industry-first use of high-NA EUV lithography in high-volume semiconductor logic manufacturing. The new node is in active development, builds on the architectural innovations of Intel 18A and is designed to deliver further improvements in performance-per-watt and density scaling improvements over Intel 18A. We are actively seeking customers for Intel 14A, which is our first node designed from inception for offering to external customers. However, the development and manufacturing of next-generation leading-edge nodes like Intel 14A is highly capital intensive and their cost structure requires wafer volumes beyond what we expect from our own products to achieve economic efficiency. As such, in 2025 we announced that if we are unable to secure a significant external foundry customer for Intel 14A, we may pause or discontinue our pursuit of next generation leading-edge process technologies. We continue to evaluate Intel 14A for use in future Intel products and our plan includes an initial product designed to utilize Intel 14A, though we are maintaining the option to utilize an external foundry for future Intel products requiring nodes with performance beyond Intel 18A and Intel 18A-P.
Packaging Technology
Our semiconductor packaging technologies represent another key to our strategy. Many of our internal products, as well as the most advanced products of potential external Intel Foundry customers, utilize disaggregated architectures that integrate multiple die, or tiles, into a single product through leading‑edge packaging. EMIB, which entered high‑volume manufacturing in 2017, supports high‑density 2.5D integration, and we introduced EMIB‑T in 2025, with adoption expected to scale beginning in 2026. EMIB‑T enhances the original EMIB technology by providing improved power delivery and bandwidth scalability to support larger package formats and next‑generation memory. We continued to invest in Foveros, our three‑dimensional die‑stacking technology first introduced in 2019, which has expanded to include Foveros‑B and Foveros‑R, both targeted for high‑volume manufacturing in 2027, as well as Foveros‑S for high‑speed I/O disaggregation. These Foveros variants aim to increase interconnect flexibility, cost efficiency, and integration density compared with earlier implementations. We also continued development of Foveros Direct, announced in 2025, with hybrid‑bonding support planned on our Intel 18A‑PT process in 2028, aimed at enabling higher interconnect density and lower energy usage.
Manufacturing
We operate a number of fabs and assembly and test facilities that support high-volume production of advanced logic chips. Once a new process technology is developed and achieves high-volume production at our Oregon R&D facilities and fabs, we generally add high-volume manufacturing at one or more of our other production fabs. Over time, we reallocate space and equipment in Oregon to our next generation process technologies. We are committed to initiating improvements in the utilization of our asset base. Recently, in addition to our Oregon location performing R&D on our latest and next generation process nodes, we are utilizing our Oregon fab assets to perform high volume manufacturing. Relatedly, fab locations that historically performed high-volume manufacturing exclusively are now also focused on an annual cadence of R&D-driven performance and cost improvements as we strive to meaningfully increase the useful life of existing nodes in production. In 2025, our key production fabs were in Oregon (ramping Intel 18A), Arizona (Intel 7 and ramping Intel 18A), Ireland (Intel 4 and Intel 3) and Israel (Intel 7). Finished wafers from our production fabs are then sent to our assembly and test facilities where the individual die are packaged and the finished semiconductor is tested. In 2025, our key assembly and test facilities were in China, New Mexico, Vietnam and Malaysia, with New Mexico being our key advanced packaging facility and a new advanced packaging facility being built in Malaysia. Maintaining reliable production capacity across these facilities is critical to meeting customer demand.
Semiconductor manufacturing is a capital-intensive industry. From 2021 through 2024, we made substantial investments across three categories: technology development, manufacturing facility shells and advanced production tools. These investments were made to accelerate the development of our most advanced process technologies as we aimed to catch up with our leading manufacturing competitor on process technology, establish “shell ahead” capacity for anticipated future market demand and adopt EUV lithography for our leading-edge nodes. In 2025, we transitioned to a more disciplined capital deployment strategy, better aligning new investments and key project milestones with market demand. This shift reflects our focus on balancing innovation and capacity growth with operational and financial efficiency. As part of this approach, in 2025 we initiated the consolidation of our Costa Rican assembly and test operations into larger existing sites in Vietnam and Malaysia, which we expect to be completed by the end of 2026, slowed the pace of construction for our new Ohio fab and discontinued planned expansions in Germany (fab) and Poland (assembly and test) to better align capital spending with market demand. These actions reflect our focus on deploying capital in coordination with tangible milestones and scaling capacity as needed.
Supply Chain
Our development of new process technologies and our manufacturing operations rely on a global supply chain encompassing thousands of suppliers worldwide. We source various critical semiconductor development and manufacturing tools and materials, including rare earth elements, minerals and metals, from multiple suppliers. In some cases, however, we are reliant upon sole-source providers, such as with the EUV lithography tools manufactured by ASML that are required for leading-edge process technologies, or providers that are substantially concentrated in a single country, such as with certain rare earth minerals critical to the functioning of a range of technology products and processes where China is the primary source of global supply. We seek to maintain close relationships with key suppliers to address capacity constraints, quality issues and potential supply chain risks, and actively monitor global supply conditions, diversify sourcing and reduce geographic dependencies where possible. Nevertheless, the semiconductor supply chain remains subject to volatility, including potential shortages of raw materials, extended lead times and price fluctuations. Additionally, trade disputes, geopolitical tensions, economic conditions and other events may further impact availability and cost. We continue to work with suppliers and governments to strengthen supply chain resilience and support a geographically balanced semiconductor ecosystem.
Our sales and marketing efforts primarily focus on our CCG and DCAI CPU and related semiconductor solutions, which are incorporated into computing and related end products and services used globally by consumers, enterprises, governments and educational organizations. Accordingly, this discussion centers on this significant portion of our business.
Customers
We design, market, sell and service CPUs and other semiconductor solutions substantially through our Intel Products business that are manufactured by our Intel Foundry business and other suppliers and are incorporated in computing and related end products and services, and utilized globally by consumers, enterprises, governments and educational organizations. We sell our products primarily to OEMs, ODMs and CSPs. ODMs provide design and manufacturing services to branded and unbranded private-label resellers. In addition, our customers include other manufacturers and service providers, such as industrial and communication equipment manufacturers and CSPs who buy our products through distributor, reseller, retail and OEM channels throughout the world. For information on customers who accounted for greater than 10% of our consolidated net revenue, see "Note 3: Operating Segments" within Notes to Consolidated Financial Statements.
Our worldwide reseller sales channel consists of thousands of indirect customers—systems builders that purchase Intel processors and other products from our distributors. Certain of our microprocessors and other products are also available in direct retail outlets.
Sales Arrangements
Our products are sold through distribution channels throughout the world. Sales of our products are frequently made via purchase order acknowledgments that contain standard terms and conditions covering matters such as pricing, payment terms and warranties, as well as indemnities for issues specific to our products, such as patent and copyright indemnities. Because our customers generally order from us on a purchase order basis, they can typically cancel, change or delay product purchase commitments with little or no notice to us and without penalty. From time to time, we may enter into additional agreements with customers covering, for example, changes from our standard terms and conditions, new product development, long term supply arrangements and marketing and private-label branding. Our sales are routinely made using electronic and web-based processes that allow customers to review inventory availability and track the progress of specific goods ordered. Pricing on particular products may vary based on volumes ordered and other factors. We also offer discounts, rebates and other incentives to customers to increase acceptance of our products and technology.
In accordance with contract terms, the revenue for combined performance obligations and standalone product sales is recognized at the time of product shipment from our facilities or delivery to the customer location, as determined by the agreed-upon shipping terms. Our standard terms and conditions of sale typically provide that payment is due at a later date, usually 30 days after shipment or delivery. We assess credit risk through quantitative and qualitative analysis. From this analysis, we establish shipping and credit limits and determine whether we will seek to use one or more credit support protection devices, such as obtaining a parent guarantee, standby letter of credit or credit insurance. Credit losses may still be incurred due to bankruptcy, fraud or other failure of the customer to pay.
Distribution
Distributors typically handle a wide variety of products, including those that compete with our products, and fill orders for many customers. Customers may place orders directly with us or through distributors. We have several distribution warehouses that are located in proximity to key customers.
Seasonal Trends
Historically, our net revenue has typically been higher in the second half of the year than in the first half of the year, accelerating in the third quarter and peaking in the fourth quarter. In 2025, this trend was disrupted by our Q3 2025 divestiture of Altera (see "Note 10: Acquisitions and Divestitures" within Notes to Consolidated Financial Statements for further information). Net revenue seasonality in 2024 and 2023 was directionally consistent with the historical trend.
Marketing
Our global marketing objectives are to strengthen our leadership as a trusted, innovative technology partner by building a bold, differentiated and well-known corporate brand that drives preferences across businesses and consumers. The Intel Core Ultra, Intel Core and Intel Xeon processor families remain our flagship CPU brands.
In 2025, we focused on accelerating brand awareness and demand generation through our own direct marketing and co-marketing programs with partners. Our direct marketing activities primarily include advertising through digital and social media, as well as consumer and trade events, industry and consumer communications and public relations. We market to consumer and commercial audiences. Our key messaging reinforces the Intel brand pillars of exceptionally engineered, collaboratively innovative and responsibly built.
Certain customers participate in cooperative advertising and marketing programs. These cooperative advertising and marketing programs broaden the reach of our brands beyond the scope of our own direct marketing. Certain customers are licensed to place Intel® logos on computing devices containing our microprocessors and processor technologies and to use our brands in their marketing activities. The program partially reimburses customers for marketing activities for products featuring Intel brands, subject to customers meeting defined criteria. These marketing activities primarily include advertising through digital and social media and television, as well as press relations and at customer and trade events.
Research and Development
R&D investment is essential to our strategic initiatives, including advancing our technology roadmap, delivering leadership products and developing next-generation process technologies. R&D expenses were $13.8 billion in 2025, $16.5 billion in 2024 and $16.0 billion in 2023. In 2025, our R&D investments focused on AI integration, heterogeneous computing architectures and next-generation process technologies, including Intel 18A and Intel 14A. We prioritized efficiency through IP reuse, advanced packaging and software-first co-design. Ecosystem partnerships and automation, including AI-driven design tools, supported innovation. We seek to protect our R&D efforts through IP rights and may, from time to time, augment these initiatives through acquisitions, strategic investments, R&D agreements and the direct purchase or licensing of technology.
Intellectual Property
We own and develop significant IP and related IP rights around the world that support our products, services, R&D and other activities and assets. Our IP portfolio includes patents, copyrights, trade secrets, trademarks, mask works and other rights. We actively seek to protect our global IP rights and deter unauthorized use of our IP and other assets.
We have obtained patents in the U.S. and other countries. Because of the fast pace of innovation and product development, our products are often obsolete before the patents related to them expire, and in some cases our products may be obsolete before the patents are granted. As we expand our product offerings, particularly around our foundry business, we also seek to extend our patent development efforts. In addition to developing patents based on our own R&D efforts, we may purchase or license patents from third parties.
The software that we distribute, including software embedded in our products, is entitled to copyright and other IP protection. To distinguish our products from our competitors' products, we have obtained trademarks and trade names for our products, and we maintain cooperative advertising programs with customers to promote our brands and to identify products containing genuine Intel components. We also protect details about our processes, products and strategies as trade secrets, keeping confidential the information that we believe provides us with a competitive advantage.
Efforts to protect our IP can be difficult, particularly in countries that provide less protection to IP rights and in the absence of harmonized international IP standards. Competitors and others may already have IP rights covering similar products. There is no assurance that we will be able to obtain IP rights covering our own products or that we will be able to obtain IP licenses from other companies on favorable terms or at all. For a discussion of IP-related risks, see "Risk Factors" within Risk Factors. While our IP rights are important to our success, our business as a whole is not significantly dependent on any single patent, copyright or other IP right.
Our people are fundamental to our success. Delivering on our strategy and growth ambitions requires attracting, developing and retaining top talent across the world. We strive to create an inclusive workplace where the world's best engineers and technologists can fulfill their dreams and create technology that delights our customers, delivers value for our stockholders and improves the life of every person on the planet. We invest in our highly skilled workforce, which was comprised of 85,1001 people as of December 27, 2025, by creating practices, programs and benefits that support the rapidly changing world of work and our employees' needs.
Cultural Transformation
In 2025, we initiated a company-wide cultural transformation designed to enhance agility, accountability and technical focus across our product and operational teams. As part of this effort, we streamlined organizational structures by reducing management layers and simplifying decision-making processes. These changes were implemented to accelerate execution, foster a more responsive workforce and improve alignment with strategic priorities. We placed increased emphasis on technical excellence, disciplined execution and customer impact, reinforcing a culture that prioritizes speed, clarity and innovation. These initiatives are an important element of our strategy and are intended to support long-term competitiveness and operational efficiency as we advance our product and process technology roadmaps and deliver differentiated computing solutions. As part of this transformation, we also evolved our workplace model to strengthen collaboration and execution, with employees generally expected to be on-site at least four days per week. This change is intended to support business priorities and foster vibrant hubs of teamwork and innovation. We believe the benefits of in-person collaboration, including stronger teams, faster decision-making and greater innovation, are essential to our long-term success.
Talent Management
We continue to see significant competition for talent throughout the semiconductor industry. In 2025, we limited hiring in line with our financial performance and cost-reduction measures and implemented headcount reductions under our 2025 Restructuring Plan. However, our investments to advance both process technology and our product roadmap require focused efforts to attract and retain talent, particularly in technical roles. Our undesired turnover rate2 was 7.9% in 2025 and 5.9% in 2024.
We invest resources to develop the talent needed to remain at the forefront of innovation and make us an employer of choice. We offer training programs and provide rotational assignment opportunities. Our job architecture is designed to help employees create custom learning curricula for building skills and owning their careers. To further support the growth and development of our people, we offer mentoring in our technical community and promote engagement and health and wellness resources with all our people. Through our periodic employee experience survey, pulse surveys and a manager pulse tool, employees can voice their perceptions of the company, their managers, their work experiences and their learning and development opportunities. Our employees' voices are important to enable our culture of continuous improvement, and as a result, we link a portion of our executive and employee performance bonus to metrics focused on activating and empowering our talent through improved morale, engagement and retention. Our business depends on how we engage, manage and reward our people. Our performance management system is designed to support our culture and to increase our focus on disciplined execution.
Inclusion is a core element of our values and instrumental to driving innovation and positioning us for growth. We aim to create a workplace where individuals from all backgrounds are not only respected and valued but also challenged, acknowledged, rewarded and empowered to reach their highest potential.
1 Employee headcount includes our core Intel workforce as well as employees at Mobileye and other subsidiaries.
2 Undesired turnover includes all regular Intel employees who voluntarily left Intel, but does not include Intel contract employees, interns or employees who separated from Intel due to divestiture, retirement, voluntary separation packages, death, job elimination or redeployment, or Mobileye and other non-integrated subsidiaries employees.
Compensation and Benefits
We structure pay, benefits and services to meet the varying needs of our employees, helping support employee financial well-being with competitive compensation, investment opportunities and financial resources. Our total rewards package includes market-competitive pay, broad-based stock grants and bonuses, an employee stock purchase plan, healthcare and retirement benefits, paid time off and family leave, parent reintegration, family expansion assistance, flexible work schedules, sabbaticals and on-site services. We believe that our holistic approach toward compensation, career development and creating an inclusive culture enables us to cultivate a workplace that helps employees develop and progress in their careers at all levels.
Health, Safety and Wellness
We are committed to providing a safe and injury-free workplace. We regularly invest in programs designed to improve physical, mental and social well-being. We provide access to a variety of innovative, flexible and convenient health and wellness programs, including on-site health centers, and we aim to increase awareness of and support for mental and behavioral health. We offer various ergonomic programming, include return-to-office ergo to support wellness in the office. Employees are encouraged to join employee resource groups for community and connection, use the employee assistance program for matters impacting personal and professional life, or the modern health program for mental well-being. We intend to continue our efforts to build our strong safety culture and drive the global expansion of our corporate wellness program through employee education and engagement activities.
We believe that responsible business practices strengthen our position as a global corporate citizen and create shared value for our company, our supply chain, and our stakeholders, including our customers and communities. Unlike many companies in the technology industry that outsource their production, we manufacture the majority of our products in our own wafer fabrication and back-end assembly and test facilities. This approach means our direct environmental footprint is more significant than those of our fabless competitors, whose impacts sit in their supply chains. However, it also gives us a unique advantage: direct control over manufacturing processes, enabling us to integrate sustainable practices at the core of production.
Managing our sustainable business practices helps us reduce cost, optimize efficiencies, strengthen supply chain resilience and meet stakeholder expectations. We invest in environmental projects and set company-wide ambitions to cut greenhouse gas emissions, energy and water use and waste to landfills. Our products are designed with energy efficiency in mind, to help customers lower their own emissions, energy usage and costs.
Our supply chain practices are designed to drive responsible and sustainable business practices through robust education and engagement initiatives for suppliers, supporting our global manufacturing operations. We collaborate with industry peers to improve transparency around climate and water impacts in the electronics supply chain, and lead efforts on responsible minerals sourcing. These collaborations help establish industry-wide standards, develop auditable processes and deliver training that drives meaningful change.
Our commitment to integrity, accountability and responsible business practices applies to every employee. All employees are expected to uphold the Intel Code of Conduct and Intel's Global Human Rights Principles, which form the foundation of our policies, practices and ethical business culture.
Human Rights Commitment
We are committed to maintaining and improving systems and processes to avoid causing or contributing to adverse impacts on human rights in our operations, products and supply chain. Our integrated approach includes senior management involvement and board-level oversight. We also engage throughout the year with external stakeholders and experts to inform and evolve our policies and oversight processes. While we do not always know nor can we control what products our customers create or the applications end users may develop, we do not support or tolerate our products being used to adversely impact human rights. Where we become aware of a concern that our products are being used by a business partner in connection with abuses of human rights, we intend to evaluate and restrict or cease business with the third party unless and until we have high confidence that our products are not being used to adversely impact human rights.
Over the past decade, we have directly engaged with suppliers to verify compliance and build operational capacity to address risks of forced and bonded labor and other human rights issues. We conduct periodic supplier audits and engage critical direct suppliers through capability-building programs aligned with the Responsible Business Alliance and the Intel Code of Conduct. Additionally, we extend these efforts to indirect suppliers through initiatives focused on forced and bonded labor, responsible minerals and supply chain resilience.
Energy
We focus on reducing our own environmental footprint, which helps deliver financial and customer value. Over the past two decades, we have reduced our direct and indirect greenhouse gas emissions associated with energy consumption, lowering operational costs and improving efficiency. Our investments include renewable electricity and on-site alternative energy projects. In 2025, we reinforced accountability by tying a portion of executive and employee performance bonuses to achieving our target of 95% global renewable electricity use as of December 31, 2025. We continue to pursue emissions abatement and invest in renewable electricity, process and equipment optimization and energy conservation. Beyond our operations, we focus on addressing climate impacts upstream and downstream in the value chain by improving the energy efficiency of our products and leveraging Intel technologies to help other sectors reduce their climate and energy footprints.
Water
Water is critical to semiconductor manufacturing. We use ultrapure water to remove impurities from our silicon wafers and fresh or reclaimed water for facility systems. Guided by our Global Water Policy, our strategy is designed to optimize resource use, reduce costs and mitigate operational risks associated with water scarcity. By managing water responsibly, we aim to meet our business needs while supporting the communities where we operate.
Waste
We have long been committed to waste management, recycling and circular economy strategies that enable the recovery and productive re-use of waste streams. We continue to focus on opportunities to upcycle waste by improving waste segregation practices and collaborating with our suppliers to evaluate new technologies for waste recovery.
Governance and Disclosure
We aim to provide transparency around our carbon footprint and climate risks using the TCFD framework to inform our disclosure on governance, strategy, risk management and metrics. Our integrated approach involves multiple teams, senior management and board-level oversight through the Corporate Governance and Nominating Committee. Climate-related risks and opportunities are detailed in our annual Corporate Responsibility Report, Global Climate Change Policy, Climate Transition Action Plan and "Risk Factors" within this Form 10-K. The Corporate Responsibility Report also maps our disclosure to TCFD, GRI and SASB frameworks and is published annually along with CDP Questionnaire on our website.1 We continue to be subject to evolving climate-related disclosure requirements in multiple jurisdictions.
1 The contents of our website and our Corporate Responsibility Report, Global Climate Change Policy, Climate Transition Action Plan, and CDP Climate Change and Water Surveys are referenced for general information only and are not incorporated by reference in this Form 10-K.
| | | | | |
Management's Discussion and Analysis | |
| |
Overview
Our MD&A begins with an overview of significant events and key developments in 2025 that meaningfully impacted our financial results and/or business. We then provide a detailed discussion of our operating segment results, followed by our consolidated results of operations and other required disclosures for 2025, 2024 and 2023. We conclude with a discussion of our critical accounting estimates.
Significant Events and Trends Impacting Results
The following discussion highlights significant events, key developments, and trends that we believe meaningfully impacted our consolidated financial results and financial position during 2025 and that we believe may continue to influence our future operating results and financial position, as well as specific matters that occurred in 2024 that impact the comparability of our results.
U.S. Government Agreements
On August 22, 2025, we entered into a Warrant and Common Stock Agreement (U.S. Government Agreement) with the U.S. Department of Commerce (DOC) to support the continued expansion of U.S. semiconductor technology and manufacturing leadership. On August 27, 2025, pursuant to the terms of the U.S. Government Agreement:
▪we entered into an amendment to our commercial CHIPS Act agreement with the DOC removing the prior project milestone requirements and other conditions to disbursements under the agreement, as well as substantially all other requirements under the agreement other than those required by law, including those associated with the $2.3 billion previously received and recognized by us as government incentives pursuant to our government grant accounting policy;
▪we received the full amount of the accelerated disbursements remaining under the commercial CHIPS Act agreement of $5.7 billion;
▪we issued to the DOC 275 million shares of our common stock and a warrant to purchase up to 241 million shares of our common stock at $20.00 per share if we were to cease to directly or indirectly own at least 51% of our Intel Foundry business; and
▪we issued into escrow 159 million shares of our common stock, to be released to the U.S. government on a $20.00 per share basis as we receive the $3.2 billion of disbursements contemplated by our existing agreement and related performance obligations with the U.S. government under the CHIPS Act's Secure Enclave program. As of December 27, 2025, we had released 3 million Escrowed Shares upon our receipt of cash proceeds for our performance under Secure Enclave.
Our accounting conclusion for the U.S. Government Agreement as presented in our Consolidated Condensed Financial Statements that were included in our Q3 2025 Form 10-Q was subsequently adjusted based upon our consultation with the staff of the SEC on this matter, which concluded in our fourth quarter of fiscal 2025, subsequent to our Q3 2025 Form 10-Q filing date of November 6, 2025. Our results in this Annual Report on Form 10-K for the fiscal year ended December 27, 2025 are reflective of this consultation. We have concluded that such adjustments are immaterial to our Consolidated Condensed Financial Statements included in our Q3 2025 Form 10-Q. Refer to “Note 5: Earnings (Loss) Per Share and Stockholders' Equity" within Notes to Consolidated Financial Statements and to our Risk Factors section for additional details.
Private Placement Share Sale Agreements
In Q3 2025, we entered into two agreements for the issuance and sale of shares of our common stock in private placements to support our strategic investments in advanced manufacturing, AI infrastructure and long-term growth initiatives:
▪on August 18, 2025, we entered into an agreement with SoftBank Group to issue and sell to SoftBank Group 87 million shares of our common stock at $23.00 per share, representing an aggregate cash purchase price of $2.0 billion. The issuance and sale of the shares was completed on September 26, 2025; and
▪on September 15, 2025, we entered into an agreement with NVIDIA to issue and sell to NVIDIA 215 million shares of our common stock at $23.28 per share for an aggregate cash purchase price of $5.0 billion. The issuance and sale of the shares was completed on December 26, 2025.
Altera Divestiture
On April 14, 2025, we signed a transaction agreement with SLP VII Gryphon Aggregator, L.P., an affiliate of SLP, to sell 51% of all issued and outstanding common stock of Altera, our wholly owned subsidiary as of that date. On September 12, 2025, we completed the divestiture of 51% of Altera for net purchase consideration of $4.3 billion, consisting of $4.8 billion in cash proceeds received within the third quarter of 2025, $500 million in deferred cash proceeds payable to us no later than December 31, 2027, an offset of $400 million for cash transferred to Altera with the sale, an offset of approximately $469 million in separation and employee-related costs we have agreed to fund to the purchaser, and an offset for other direct and incremental costs incurred in connection with the sale. As of December 27, 2025, we recorded $463 million within other long-term assets for the present value of deferred consideration outstanding from SLP and $327 million and $97 million within other accrued liabilities and other long-term liabilities, respectively, for amounts payable to SLP for separation and employee-related costs that have not yet been paid.
Upon closing the transaction, we deconsolidated Altera from our Consolidated Financial Statements and retained a 49% minority investment in Altera which we accounted for under the equity method of accounting. The $3.2 billion value of our non-marketable equity method investment in Altera is classified within equity investments in the Consolidated Balance Sheets at December 27, 2025, and was recognized as a non-cash investing activity within the 2025 Consolidated Statements of Cash Flows. The Altera divestiture resulted in a pre-tax gain of $5.6 billion recognized within interest and other, net, which is net of certain costs we have agreed to fund to SLP, as well as direct and incremental costs we incurred to sell the business. Approximately $2.1 billion of the gain resulted from the remeasurement of our non-marketable equity investment in Altera to its fair value at the transaction close date. Refer to "Note 10: Acquisitions and Divestitures" within Notes to Consolidated Financial Statements for further information.
Restructuring
2025
In Q2 2025, we commenced an enterprise-wide initiative to transform our culture and the way in which we operate, which is designed to simplify the way we do business and drive transparency and accountability across the company. As part of this transformation, we implemented the 2025 Restructuring Plan to lower expenses, streamline our organizational structure and reduce management layers across functions while reallocating resources toward our core client and server businesses by reducing investment in lower-priority programs and initiatives. These headcount reduction initiatives reduced our core Intel workforce by approximately 15% by the end of fiscal 2025, as compared to our Q2 2025 ending employee headcount. In 2025, we recognized restructuring charges of $2.2 billion, consisting primarily of charges from initiating and deploying the 2025 Restructuring Plan and incurring charges as we substantially completed the 2024 Restructuring Plan. Charges in 2025 were primarily composed of cash-based employee severance and related employee exit charges of $1.8 billion and non-cash asset impairment charges of $474 million resulting from the exit of certain non-core lines of business and the consolidation and exit of certain real estate properties.
Our 2025 consolidated results of operations were also affected by accelerated depreciation and impairment charges recognized for certain manufacturing assets that were determined to have no remaining operational use. This determination was based on an evaluation of our current process technology node capacities relative to projected market demand for our products and services. These non-cash charges of $950 million, net of certain items, were recorded to cost of sales in 2025, impacting the results for our Intel Foundry segment.
2024
In 2024, we announced and initiated the 2024 Restructuring Plan, which reduced headcount, consolidated and reduced our global real estate footprint, and reduced our overall operating expenses. As a result of initiating and deploying our 2024 Restructuring Plan, we recognized restructuring charges of $2.8 billion in 2024 and $348 million in 2025.
Our 2024 consolidated results of operations were also materially impacted by the following:
▪$3.3 billion of charges, substantially all of which were recorded to cost of sales, related to non-cash impairments and the acceleration of depreciation for certain manufacturing assets, a substantial majority of which related to our Intel 7 process node;
▪$3.1 billion of non-cash charges associated with the impairment of goodwill for certain of our reporting units as well as certain acquired intangible assets (see "Note 7: Restructuring and Other Charges" within Notes to Consolidated Financial Statements); and
▪$9.9 billion of non-cash charges recorded to provision for income taxes that substantially related to valuation allowances recorded to our net deferred tax assets (see "Provision for (Benefit from) Taxes" within this MD&A below).
Non-Controlling Interests
Net income (loss) attributable to non-controlling interests is comprised of net income or loss attributable to the non-controlling interests in Mobileye, IMS Nanofabrication, Ireland SCIP and Arizona SCIP, all of which are our majority owned subsidiaries that we consolidate. Net income attributable to non-controlling interests was $293 million in 2025 and net loss attributable to non-controlling interests was $477 million and $14 million in 2024 and 2023, respectively. Net income attributable to non-controlling interests in 2025 was primarily driven by the placement of the first tranche of Arizona SCIP’s manufacturing assets into service during 2025 and the ramp of factory output from Fab 34 resold to us from Ireland SCIP. In 2024, net loss applicable to non-controlling interests related to the Q3 2024 non-cash impairment of goodwill related to our Mobileye reporting unit. We anticipate that net income attributable to non-controlling interests will continue to increase in 2026 as additional tranches of Arizona SCIP’s manufacturing assets are placed into service, and to increase significantly in 2027 following our expected completion of construction of Fab 34 in Ireland. Refer to "Note 4: Non-Controlling Interests" within Notes to Consolidated Financial Statements.
Manufacturing Expansion Projects and Future Node Development
As part of the transformation of the company, in Q2 2025 we announced that we would take a more disciplined approach to the deployment of capital. The design, development and manufacturing of leading-edge semiconductor manufacturing process technologies, or nodes, is risky and capital-intensive, and it takes years for capital investments to yield a return. Under our more disciplined approach, we intend to invest capital in future node development and new or upgraded manufacturing facilities only where we have a clear line of sight to an acceptable return on that capital.
On the manufacturing side, we initiated the consolidation of our Costa Rican assembly and test operations into larger existing sites in Vietnam and Malaysia, slowed the pace of construction for our new Ohio fab and discontinued planned expansions in Germany (fab) and Poland (assembly and test) to better align capital spending with market demand. These actions reflect our focus on deploying capital in coordination with tangible milestones and scaling capacity as needed.
With respect to leading-edge process technology development, we recently released the Intel Core Ultra Series 3 processors, our first products manufactured on our new leading-edge node, Intel 18A, and we continue to develop its derivative node, Intel 18A-P, designed for future Intel products and external Intel Foundry customers. We are also focused on the continued development of Intel 14A, the next generation node beyond Intel 18A and Intel 18A-P, and on securing a significant external customer for such node. However, if we are unable to secure a significant external customer and meet important customer milestones for Intel 14A, we face the prospect that it will not be economical to develop and manufacture Intel 14A and successor leading-edge nodes on a go-forward basis. In such event, we may pause or discontinue our pursuit of Intel 14A and successor nodes and various of our manufacturing expansion projects. While we continue to evaluate Intel 14A for use in future Intel products and our plan includes an initial product designed to utilize Intel 14A, at present we are maintaining the option to design future Intel products requiring nodes with performance beyond Intel 18A and Intel 18A-P to be produced internally or by an external foundry. If we were to discontinue development of Intel 14A and successor nodes, we expect that a majority of our products would continue to be manufactured in our own facilities utilizing our nodes up to Intel 18A-P through at least 2030. By focusing on our customers and delivering the best semiconductor products to the market, manufactured on the most appropriate internal or external node from a performance and cost perspective, and only deploying capital on new nodes and manufacturing facilities where we believe they will yield an attractive return, we believe we can improve the competitiveness of our products business, and the overall financial results for the company.
| | | | | |
Operating Segment Results | |
| |
In Q1 2025, we made an organizational change to integrate NEX into CCG and DCAI and modified our segment reporting to align to this and certain other business reorganizations. All prior period segment data has been retrospectively adjusted to reflect the way our CODM internally receives information and manages and monitors our operating segment performance. There were no changes to our Consolidated Financial Statements for any prior periods. As a result of these organizational changes, in 2025 we managed our business through the operating segments presented below and have included the 2025, 2024 and 2023 segment financial results and related discussions of our segments' results of operations. Our discussion regarding our segments' results of operations presented below excludes restructuring and other charges for all periods presented and $9.9 billion of 2024 charges resulting from valuation allowances recorded against our net deferred tax assets, in addition to certain other items, as our CODM receives, views and uses information for decision-making purposes based upon segment results that exclude such items. "Note 3: Operating Segments" within Notes to Consolidated Financial Statements of this Form 10-K reconciles our segment and consolidated results for each of the periods presented.
Intel Products
Intel Products consists substantially of the design, development, marketing, sale, support and servicing of CPUs and related semiconductor products for third-party customers. Intel Products is comprised of two operating segments: CCG and DCAI. CCG delivers platforms and processors that power PCs and edge devices, enabling enhanced performance, connectivity and user experiences for consumer and commercial markets with capabilities that also support retail, industrial robotics and AI ecosystems at the edge. DCAI delivers workload-optimized solutions based upon our x86 architecture for data centers, including CPUs, AI accelerators, NICs, IPUs and custom ASICs, enabling performance and scalability for cloud, enterprise, telecommunication and HPC environments. The manufacturing of our Intel Products offerings is performed by Intel Foundry and, to a lesser extent, by certain third party manufacturers.
Intel Products Financial Performance1
| | | | | | | | | | | | | | | | | | | | |
| | Dec 27, 2025 |
| Year Ended ($ In Millions) | | CCG | | DCAI | | Total |
| Revenue | | $ | 32,228 | | | $ | 16,919 | | | $ | 49,147 | |
Cost of sales and operating expenses | | 22,911 | | | 13,497 | | | 36,408 | |
Operating income | | $ | 9,317 | | | $ | 3,422 | | | $ | 12,739 | |
| | | | | | |
| Operating margin % | | 29% | | 20% | | 26% |
| | | | | | | | | | | | | | | | | | | | |
| | Dec 28, 2024 |
| Year Ended ($ In Millions) | | CCG | | DCAI | | Total |
| Revenue | | $ | 33,346 | | | $ | 16,125 | | | $ | 49,471 | |
Cost of sales and operating expenses | | 21,752 | | | 14,711 | | | 36,463 | |
Operating income | | $ | 11,594 | | | $ | 1,414 | | | $ | 13,008 | |
| | | | | | |
| Operating margin % | | 35% | | 9% | | 26% |
| | | | | | | | | | | | | | | | | | | | |
| | Dec 30, 2023 |
| Year Ended ($ In Millions) | | CCG | | DCAI | | Total |
| Revenue | | $ | 32,305 | | | $ | 15,980 | | | $ | 48,285 | |
Cost of sales and operating expenses | | 22,177 | | | 15,035 | | | 37,212 | |
Operating income | | $ | 10,128 | | | $ | 945 | | | $ | 11,073 | |
| | | | | | |
| Operating margin % | | 31% | | 6% | | 23% |
1 Operating segment results include intersegment financial activity; refer to "Note 3: Operating Segments" within Notes to Consolidated Financial Statements for a reconciliation between our operating segment and consolidated financial results for the periods presented.
| | | | | | | | | | | |
Operating Segment Revenue Summary |
2025 vs. 2024
Total Intel Products revenue was $49.1 billion in 2025, down $324 million from 2024.
| | | | | | | | | | | | | | |
▪CCG revenue decreased $1.1 billion from 2024. Client revenue (collectively notebook and desktop) was $27.6 billion in 2025, down $1.1 billion from 2024, primarily due to lower 2025 client volume resulting from incremental customer incentives offered to certain customers in the first half of 2024 and customer inventory level reductions in 2025. Customers normalized inventory levels through Q3 2025 and continued to reduce inventory levels in Q4 2025, when supply constraints on our internally manufactured wafers limited product availability despite underlying demand. This decrease in 2025 revenue was partially offset by higher Q3 2025 client volumes driven by higher demand; however, client volume decreased in Q4 2025 as market demand exceeded our available supply of products due to Intel Foundry wafer fabrication supply constraints, primarily with respect to our Intel 7 process node. We expect these supply constraints to persist into 2026, with the most severe constraints impacting Q1 2026, limiting our ability to fully meet customer demand. Client ASPs in 2025 were roughly flat with 2024. Other CCG revenue was $4.6 billion, roughly flat with 2024. |
▪DCAI revenue increased $794 million from 2024, primarily driven by higher server revenue due to higher hyperscale customer-related demand, which contributed to an increase in server volume of 9%. Server ASPs decreased by 4% from 2024, primarily due to pricing actions taken primarily during the first half of 2025 and a higher mix of lower core count products, both driven by a competitive environment, partially offset by higher ASPs in the second half of 2025 resulting from higher demand. Our 2025 server revenue was limited in Q4 2025 by our available supply of products due to Intel Foundry wafer fabrication supply constraints, primarily with respect to our Intel 7 and Intel 3 process nodes, impacting our ability to fully meet demand. We expect these supply constraints to persist into 2026, with the most severe constraints impacting Q1 2026. Other DCAI product revenue also increased from 2024 driven by higher networking customer-related demand. |
2024 vs. 2023
Total Intel Products revenue was $49.5 billion in 2024, up $1.2 billion from 2023.
| | | | | | | | | | | | | | |
▪CCG revenue increased $1.0 billion from 2023. Client revenue (collectively notebook and desktop) was $28.7 billion in 2024, up $1.6 billion from 2023, primarily due to an increase in 2024 client volume of 7% as customer inventory levels improved compared to higher levels in 2023. Client ASPs in 2024 were roughly flat with 2023. Other CCG revenue was $4.6 billion, down $521 million from 2023, primarily driven by the exit of legacy businesses. |
▪DCAI revenue increased $145 million from 2023, primarily driven by an increase in server revenue. Server ASPs increased 11% from 2023, primarily due to a higher mix of high core count products. Server volume decreased 8% from 2023, due to lower demand in a competitive environment and a higher mix of high core count products. Other DCAI product revenue was $2.7 billion, down $196 million from 2023, primarily due to 5G customers tempering purchases to reduce existing inventories. |
| | | | | | | | | | | |
Segment Operating Income Summary |
2025 vs. 2024
Total Intel Products operating income was $12.7 billion in 2025, down $269 million from 2024.
| | | | | | | | | | | | | | |
▪CCG operating income decreased $2.3 billion from 2024, primarily due to $2.9 billion of unfavorable impacts attributable to $1.8 billion of lower 2025 product profit due to lower revenue and higher client unit costs resulting from an increased mix of newer generation products sold in 2025, as well as $1.1 billion of higher 2025 period charges related to higher inventory reserves related to lower of cost or net realizable value charges and higher other costs. These unfavorable 2025 impacts were partially offset by 2025 favorable impacts of lower operating expenses of $590 million, primarily due to lower payroll-related expenditures as a result of headcount reductions taken under the 2025 and 2024 Restructuring Plans and the effects of various other cost-reduction measures. |
▪DCAI operating income increased $2.0 billion from 2024, primarily due to $1.5 billion of favorable impacts related to lower operating expenses, primarily driven by lower payroll-related expenditures as a result of headcount reductions taken under the 2025 and 2024 Restructuring Plans and the effects of various other cost-reduction measures. In addition, 2025 DCAI operating income was favorably impacted by lower 2025 Gaudi AI accelerator inventory-related charges relative to 2024. The 2025 impacts of higher 2025 DCAI revenue was substantially offset by higher server unit costs from an increased mix of newer generation products sold in 2025. |
2024 vs. 2023
Total Intel Products operating income was $13.0 billion in 2024, up $1.9 billion from 2023.
| | | | | | | | | | | | | | |
▪CCG operating income increased $1.5 billion from 2023, primarily due to $1.0 billion of favorable impacts attributable to higher product profit due to higher revenue in 2024 and lower period charges related to lower samples. Operating income also improved from 2023 due to favorable impacts from lower operating expenses of $423 million primarily driven by intersegment credits and various cost-reduction measures taken in 2024. |
▪DCAI operating income increased $469 million from 2023, primarily due to favorable impacts from lower period charges from the sell-through of previously reserved inventory and lower non-accelerator inventory reserves taken in 2024. These favorable impacts to operating income were partially offset by higher period charges due to $922 million in Gaudi AI accelerator inventory-related charges recognized in 2024 and higher operating expenses of $151 million primarily driven by increased product development costs in 2024. |
Intel Foundry
Intel Foundry, comprised of technology development, manufacturing and foundry services, develops new leading-edge semiconductor process technologies and advanced packaging technologies and provides manufacturing, assembly and test and advanced packaging capacity and design enablement solutions across multiple nodes and platforms. We continue to innovate and advance leading-edge semiconductor process technology and manufacturing in the U.S., where we are the only company conducting both leading-edge logic R&D and high-volume manufacturing. At present, nearly all of our Intel Foundry business supports internal manufacturing for Intel Products; however, we are offering our Intel Foundry services to external customers and aim to develop a more significant external foundry business in the future.
Intel Foundry Financial Performance1
| | | | | | | | | | | | | | | | | | | | | | |
| | | | | | | | |
| Years Ended ($ In Millions) | | Dec 27, 2025 | | Dec 28, 2024 | | Dec 30, 2023 | | |
| Revenue | | $ | 17,826 | | | $ | 17,317 | | | $ | 18,504 | | | |
| Cost of sales and operating expenses | | 28,144 | | | 30,608 | | | 25,587 | | | |
| Operating loss | | $ | (10,318) | | | $ | (13,291) | | | $ | (7,083) | | | |
| | | | | | | | |
| Operating loss % | | (58)% | | (77)% | | (38)% | | |
1 Operating segment results include intersegment financial activity; refer to "Note 3: Operating Segments" within Notes to Consolidated Financial Statements for a reconciliation between our operating segment and consolidated financial results for the periods presented.
| | |
Operating Segment Revenue Summary |
2025 vs. 2024
| | | | | | | | | | | | | | |
Revenue was $17.8 billion in 2025, up $509 million from 2024. Intersegment revenue was $17.5 billion, up $361 million from 2024, primarily due to higher back-end services revenue and higher wafer volume from our Intel 3, Intel 4 and Intel 18A process nodes, partially offset by lower intersegment samples revenue. External revenue was $307 million, up $148 million from 2024. |
2024 vs. 2023
| | | | | | | | | | | | | | |
Revenue was $17.3 billion in 2024, down $1.2 billion from 2023. Intersegment revenue was $17.2 billion, down $799 million from 2023, primarily due to lower intersegment ASPs, lower back-end services revenue, and higher intersegment credits, partially offset by higher intersegment revenue due to higher wafer volume primarily from Intel 3, Intel 4 and Intel 7 products. External revenue was $159 million, down $388 million from 2023, primarily due to lower traditional packaging services. |
| | | | | | | | | | | |
Segment Operating Loss Summary |
2025 vs. 2024
| | | | | | | | | | | | | | |
Operating loss was $10.3 billion in 2025, compared to an operating loss of $13.3 billion in 2024, primarily due to a reduction in asset impairments and accelerated depreciation charges. In 2025, we incurred $950 million of asset impairments and accelerated depreciation charges related to certain manufacturing assets determined to have no remaining operational use, compared to $3.3 billion of non-cash impairments and accelerated depreciation charges recognized in 2024 that were primarily related to manufacturing assets for our Intel 7 process node. Additionally, 2025 benefited from $1.2 billion of lower operating expenses, primarily due to lower payroll-related expenditures as a result of headcount reductions taken under the 2025 and 2024 Restructuring Plans and the effects of various other cost-reduction measures. These favorable 2025 impacts were partially offset by $849 million of higher 2025 intersegment inventory reserves related to lower of cost or net realizable value charges for products manufactured on the early ramp of our Intel 18A process node. |
2024 vs. 2023
| | | | | | | | | | | | | | |
Operating loss was $13.3 billion in 2024, compared to an operating loss of $7.1 billion in 2023, primarily driven by higher period charges related to non-cash impairments and accelerated depreciation of $3.3 billion for certain manufacturing assets, a substantial majority of which related to our Intel 7 process node; lower product profit of $2.5 billion primarily driven by higher costs from the ramp of advanced technologies and lower intersegment revenue; and higher operating expenses of $931 million primarily driven by increased investments in process technology. |
All Other
Our "all other" category includes the results of operations from non-reportable segments, including our Mobileye business, our IMS business, start-up businesses that support our initiatives and historical results of operations from divested businesses, including Altera. Effective September 12, 2025, Altera, previously a wholly-owned subsidiary, was deconsolidated from our Consolidated Financial Statements following the closing of the sale of 51% of Altera's issued and outstanding common stock. Altera's financial results of operations were included in our "all other" category through September 11, 2025. As of September 12, 2025, our retained non-marketable equity interest in Altera is accounted for as an equity method investment. See "Note 10: Acquisitions and Divestitures" within Notes to Consolidated Financial Statements for further information.
All Other Financial Performance1
| | | | | | | | | | | | | | | | | | | | |
| Years Ended ($ In Millions) | | Dec 27, 2025 | | Dec 28, 2024 | | Dec 30, 2023 |
| Revenue | | $ | 3,563 | | | $ | 3,601 | | | $ | 5,463 | |
Cost of sales and operating expenses | | 3,299 | | | 3,658 | | | 3,956 | |
| Operating income (loss) | | $ | 264 | | | $ | (57) | | | $ | 1,507 | |
| | | | | | |
Operating margin (loss) % | | 7% | | (2)% | | 28% |
1 Operating segment results include intersegment financial activity; refer to "Note 3: Operating Segments" within Notes to Consolidated Financial Statements for a reconciliation between our operating segment and consolidated financial results for the periods presented.
| | |
Operating Segments Revenue Summary |
2025 vs. 2024
All other revenue was $3.6 billion, down $38 million from 2024, primarily driven by lower revenue from our other non-reportable segments due to the Q3 2025 divestiture of Altera. This 2025 decrease was substantially offset by higher 2025 Mobileye revenue, which totaled $1.9 billion, up $240 million from 2024 due to improved customer inventory levels and higher demand for Eye Q® products.
2024 vs. 2023
All other revenue was $3.6 billion, down $1.9 billion from 2023. Altera revenue was $1.5 billion, down $1.3 billion from 2023, as customers tempered purchases to reduce existing inventories across all product lines. Mobileye revenue was $1.7 billion, down $425 million from 2023, as customers tempered purchases to reduce existing inventories of EyeQ® products.
| | | | | | | | | | | | | | |
Segments Operating Income (Loss) Summary |
2025 vs. 2024
All other operating income was $264 million in 2025, compared to an operating loss of $57 million in 2024, primarily driven by higher Mobileye 2025 revenue and improved 2025 operating income contribution from Altera.
2024 vs. 2023
All other operating loss was $57 million in 2024 compared to operating income of $1.5 billion in 2023, primarily driven by lower Altera and Mobileye revenue.
| | | | | |
Consolidated Results of Operations | |
| |
| | | | | | | | | | | | | | | | | | | | | | | | | | | | | | | | | | | | | | |
Years Ended
(In Millions, Except Per Share Amounts) | | December 27, 2025 | | December 28, 2024 | | December 30, 2023 |
| Amount | | % of Net Revenue1 | | Amount | | % of Net Revenue1 | | Amount | | % of Net Revenue1 |
| Net revenue | | $ | 52,853 | | | 100.0 | % | | $ | 53,101 | | | 100.0 | % | | $ | 54,228 | | | 100.0 | % |
| Cost of sales | | 34,478 | | | 65.2 | % | | 35,756 | | | 67.3 | % | | 32,517 | | | 60.0 | % |
| Gross profit | | 18,375 | | | 34.8 | % | | 17,345 | | | 32.7 | % | | 21,711 | | | 40.0 | % |
| Research and development | | 13,774 | | | 26.1 | % | | 16,546 | | | 31.2 | % | | 16,046 | | | 29.6 | % |
| Marketing, general, and administrative | | 4,624 | | | 8.7 | % | | 5,507 | | | 10.4 | % | | 5,634 | | | 10.4 | % |
| Restructuring and other charges | | 2,191 | | | 4.1 | % | | 6,970 | | | 13.1 | % | | (62) | | | (0.1) | % |
| | | | | | | | | | | | |
| Operating income (loss) | | (2,214) | | | (4.2) | % | | (11,678) | | | (22.0) | % | | 93 | | | 0.2 | % |
| Gains (losses) on equity investments, net | | 514 | | | 1.0 | % | | 242 | | | 0.5 | % | | 40 | | | 0.1 | % |
| Interest and other, net | | 3,257 | | | 6.2 | % | | 226 | | | 0.4 | % | | 629 | | | 1.2 | % |
| Income (loss) before taxes | | 1,557 | | | 2.9 | % | | (11,210) | | | (21.1) | % | | 762 | | | 1.4 | % |
| Provision for (benefit from) taxes | | 1,531 | | | 2.9 | % | | 8,023 | | | 15.1 | % | | (913) | | | (1.7) | % |
| Net income (loss) | | 26 | | | — | % | | (19,233) | | | (36.2) | % | | 1,675 | | | 3.1 | % |
| Less: net income (loss) attributable to non-controlling interests | | 293 | | | 0.6 | % | | (477) | | | (0.9) | % | | (14) | | | — | % |
| Net income (loss) attributable to Intel | | $ | (267) | | | (0.5) | % | | $ | (18,756) | | | (35.3) | % | | $ | 1,689 | | | 3.1 | % |
Earnings (loss) per share attributable to Intel—diluted | | $ | (0.06) | | | | | $ | (4.38) | | | | | $ | 0.40 | | | |
1 Totals may not sum due to rounding.
The following discussion includes the 2025, 2024 and 2023 consolidated financial results and related discussion of our consolidated results of operations for 2025 relative to 2024. A discussion regarding our consolidated results of operations for 2024 relative to 2023 is included in our 2024 Form 10-K. Our consolidated results exclude all intersegment transactions.
Consolidated Revenue
| | |
Consolidated Revenue Walk $B1 |
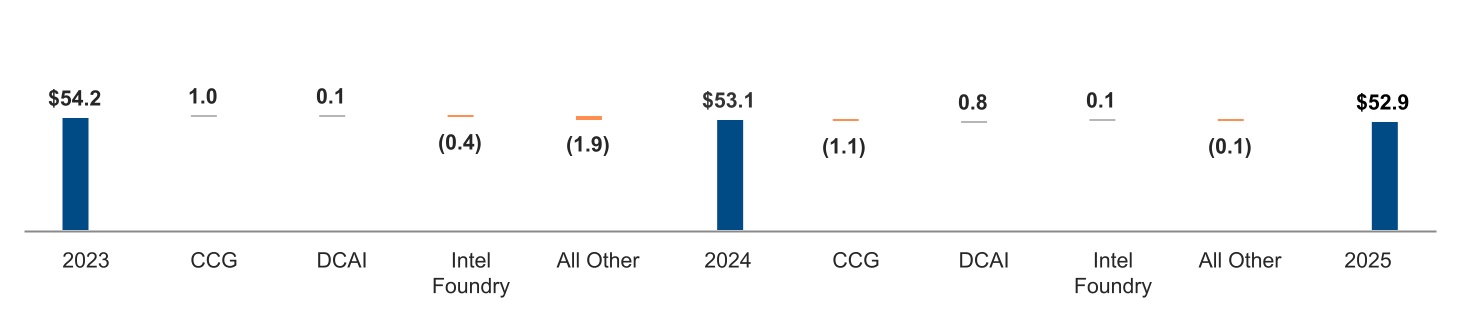
1 Excludes intersegment revenue; totals may not sum due to rounding.
2025 vs. 2024
| | | | | | | | | | | | | | |
Our 2025 revenue was $52.9 billion, down $248 million from 2024. Intel Products revenue was roughly flat with 2024, primarily due to lower CCG revenue that was substantially offset by higher DCAI revenue. CCG revenue decreased 3% from 2024 primarily due to lower client revenue in the first half of 2025 driven by lower client volumes that were primarily attributable to the reduction of incremental incentives offered to certain customers in the first half of 2024. In addition, CCG 2025 revenue was impacted by customer inventory level reductions in 2025 and by supply constraints on our internally manufactured wafers in 2025 which affected our ability to fully meet market demand primarily for our products manufactured using our Intel 7 process node. DCAI revenue increased 5% from 2024 driven by higher server revenue due to higher hyperscale customer-related demand and higher product revenue from higher networking customer-related demand. Our 2025 DCAI revenue was limited in Q4 2025 by our available supply of products due to wafer fabrication supply constraints at our manufacturing facilities, primarily with respect to our Intel 7 and Intel 3 process nodes, which impacted our ability to fully meet customer demand. We expect these supply constraints to persist into 2026 and industry wide shortages of substrates, memory and other critical components may further limit our ability to meet CCG and DCAI customer demand in 2026. |
Consolidated Gross Profit
We derived a majority of our consolidated gross profit in 2025 and 2024 from our Intel Products business sales through our CCG and DCAI operating segments.
| | | |
| Gross Profit $B |
| (Percentages in chart indicate gross profit as a percentage of total revenue) |
2025 vs. 2024
| | | | | | | | | | | | | | |
Our consolidated gross profit in 2025 increased by $1.0 billion, or 6%, compared to 2024, primarily due to a reduction in asset impairments and accelerated depreciation charges. In 2025, we incurred $950 million of asset impairments and accelerated depreciation charges related to certain manufacturing assets determined to have no remaining operational use, compared to $3.3 billion of non-cash impairments and accelerated depreciation charges recognized in 2024, primarily related to manufacturing assets for our Intel 7 process node. In addition, our consolidated gross profit in 2025 benefited from reduced Gaudi AI accelerator inventory-related charges relative to 2024. These favorable impacts to 2025 gross margin were partially offset by $878 million of higher 2025 inventory reserves, primarily related to lower of cost or net realizable value charges for products manufactured on the early ramp of our Intel 18A process node. |
We are making capital investments in furtherance of our strategy. As of December 27, 2025, our capital investments classified as construction in progress totaled $34.5 billion ($50.4 billion as of December 28, 2024) and decreased in 2025 as Arizona SCIP placed the first tranche of manufacturing assets into service in connection with the ramp of our 18A process node. Construction in progress assets have not yet been placed into service and have not yet begun depreciating. As these construction-in-progress assets are placed into service, we expect to incur depreciation expense that impacts future production costs and ultimately cost of sales. To the extent we are unable to grow our revenues to offset these production costs, our gross margin and operating income will be unfavorably affected. Additionally, we could incur asset impairments on property, plant and equipment assets if our strategy is not successful. |
Consolidated R&D and MG&A Expenses
Total R&D and MG&A expenses for 2025 were $18.4 billion, down 17% compared to 2024. These expenses represented 34.8% of revenue for 2025 and 41.5% of revenue for 2024. In support of our strategy, we continue to make investments to advance our product and process technology roadmaps. As a result of our 2025 and 2024 Restructuring Plans and other related cost-reduction measures and the divestiture of Altera, we expect total R&D and MG&A expenses to decrease in 2026 relative to recent historical periods.
| | | | | | | | |
| Research and Development $B | | Marketing, General, and Administrative $B |
(Percentages in chart indicate operating expenses as a percentage of total revenue) |
2025 vs. 2024
| | | | | | | |
| | | |
2025 R&D expenses decreased by $2.8 billion, or 17%, from 2024, primarily driven by lower payroll-related expenditures resulting from headcount reductions taken under the 2025 and 2024 Restructuring Plans and other related cost-reduction measures, and $610 million of lower share-based compensation. These 2025 R&D expense reductions were partially offset by higher 2025 incentive-based cash compensation of $418 million. | | |
| | | |
| | | |
| | | |
| | | |
| | | |
| | | |
| | | |
| | |
| | | |
| | |
| | | |
| | | |
| | | |
| | | |
| | | |
| | | |
| | | |
| | |
Marketing, General, and Administrative |
2025 vs. 2024
| | | | | | | |
| | | |
2025 MG&A expenses decreased by $883 million, or 16%, from 2024, primarily driven by lower payroll-related expenditures resulting from headcount reductions taken under the 2025 and 2024 Restructuring Plans and other related cost-reduction measures, and $109 million of lower share-based compensation. These 2025 MG&A expense reductions were partially offset by higher 2025 incentive-based cash compensation of $118 million. | | |
| | | |
| | | |
| | | |
| | | |
| | | |
| | |
| | | |
| | |
| | | |
| | | |
| | | |
| | | |
| | | |
| | | |
Restructuring and Other Charges
| | | | | | | | | | | | | | | | | | | | | | |
| Years Ended (In Millions) | | Dec 27, 2025 | | Dec 28, 2024 | | Dec 30, 2023 | | |
| Employee severance and benefit arrangements | | $ | 1,790 | | | $ | 2,481 | | | $ | 222 | | | |
| Litigation charges and other | | (121) | | | 858 | | | (329) | | | |
| Asset impairment charges | | 522 | | | 3,631 | | | 45 | | | |
| Total restructuring and other charges | | $ | 2,191 | | | $ | 6,970 | | | $ | (62) | | | |
In Q2 2025, we announced and commenced the 2025 Restructuring Plan, which was designed to streamline our organizational structure, enable us to focus on our core businesses and lower our overall operating expenses (see "Note 7: Restructuring and Other Charges" within Notes to Consolidated Financial Statements). A majority of the actions contemplated by the 2025 Restructuring Plan were completed by the end of Q4 2025, with the remainder expected to be completed in 2026. Any changes to the estimates or timing will be reflected in our results of operations.
The 2024 Restructuring Plan, which we initiated in Q3 2024, was substantially completed by the end of Q4 2025, with the remainder expected to be completed in 2026.
The 2022 Restructuring Plan, which we initiated in Q3 2022, was completed in Q1 2024.
2025 vs. 2024
Employee severance and benefit arrangements includes net charges relating to the 2025 Restructuring Plan of $1.5 billion, and 2024 Restructuring Plan and other actions of $281 million in 2025. The charges in 2024 primarily related to the 2024 Restructuring Plan and 2022 Restructuring Plan.
Litigation charges and other includes a $163 million benefit recorded in 2025 from the reduction of a previously accrued fine imposed in 2023 by the EC. The 2024 charges include $780 million arising out of the R2 litigation. Refer to "Note 19: Commitments and Contingencies" within Notes to Consolidated Financial Statements and our 2024 Form 10-K for information about the EC fine and R2 litigation, respectively.
Asset impairment charges in 2025 primarily included $522 million of non-cash charges associated with the 2025 Restructuring Plan resulting from the exit of certain non-core lines of business and the consolidation and exit of certain real estate properties. The asset impairment charges in 2024 included non-cash charges associated with the 2024 Restructuring Plan, including $442 million of non-cash impairments of construction-in-progress assets associated with our decision to exit and outsource manufacturing capabilities for certain internal test hardware; and $103 million of non-cash impairments of operating leased assets and related leasehold improvements resulting from real estate consolidations and exits. Real estate consolidations and exits did not significantly change our operating lease liabilities and may result in future cash outlays for facility restoration or the relocation of operations. In addition, we incurred non-cash impairments relating to goodwill and acquired intangibles of $3.1 billion in 2024. Refer to "Note 7: Restructuring and Other Charges" and "Note 11: Goodwill" within Notes to Consolidated Financial Statements for further information about these items.
Gains (Losses) on Equity Investments, Net and Interest and Other, Net
| | | | | | | | | | | | | | | | | | | | |
| Years Ended (In Millions) | | Dec 27, 2025 | | Dec 28, 2024 | | Dec 30, 2023 |
| Unrealized gains (losses) on marketable equity investments, net | | $ | (311) | | | $ | (218) | | | $ | (99) | |
Unrealized gains (losses) on non-marketable equity investments, net1 | | 490 | | | 92 | | | 17 | |
| Impairment charges on non-marketable equity investments | | (300) | | | (347) | | | (214) | |
| Unrealized gains (losses) on equity investments, net | | (121) | | | (473) | | | (296) | |
| Realized gains (losses) on sales of equity investments, net | | 635 | | | 715 | | | 336 | |
| Gains (losses) on equity investments, net | | $ | 514 | | | $ | 242 | | | $ | 40 | |
| Interest and other, net | | $ | 3,257 | | | $ | 226 | | | $ | 629 | |
1 Unrealized gains (losses) on non-marketable investments includes observable price adjustments and our share of equity method investee gains (losses) and certain distributions.
Gains (Losses) on Equity Investments, Net
2025 vs. 2024
In 2025, we recognized net gains on equity investments of $514 million that were primarily driven by realized gains on sales of equity investments, partially offset by 2025 net unrealized losses on equity investments. Included in 2025 unrealized gains (losses) on non-marketable equity investments, net was $396 million of upward observable price adjustments related to a single investee.
In 2024, we recognized net gains on equity investments of $242 million, primarily due to $460 million of net gains related to our marketable equity investment portfolio, the majority of which related to the sale of our interest in Astera Labs and was included within realized gains (losses) on sales of equity investments, net.
Interest and Other, Net
2025 vs. 2024
In 2025, interest and other, net, increased primarily due to a gain recognized from the sale of 51% of Altera, which resulted in a $5.6 billion pre-tax gain. This was partially offset by a $1.8 billion net loss from the change in fair value of the derivative liability for the Escrowed Shares and $229 million in charges related to the sale of our NAND memory business. Refer to "Note 5: Earnings (Loss) Per Share and Stockholders' Equity" and "Note 10: Acquisitions and Divestitures" within Notes to Consolidated Financial Statements.
Provision for (Benefit from) Taxes
| | | | | | | | | | | | | | | | | | | | |
Years Ended ($ In Millions) | | Dec 27, 2025 | | Dec 28, 2024 | | Dec 30, 2023 |
Income (loss) before taxes | | $ | 1,557 | | | $ | (11,210) | | | $ | 762 | |
| Provision for (benefit from) taxes | | $ | 1,531 | | | $ | 8,023 | | | $ | (913) | |
| Effective tax rate | | 98.3 | % | | 71.6 | % | | (119.8) | % |
2025 vs. 2024
Our effective tax rate increased in 2025 compared to 2024, primarily related to a change in 2025 valuation allowance against current year tax attributes relative to the corresponding 2024 activity, offset by a nonrecurring 2025 gain on the Altera divestiture. During Q3 2024, we first established a valuation allowance of $9.9 billion as a discrete non-cash tax expense against our U.S. deferred tax assets. We assess the recoverability of our deferred tax assets quarterly, weighing available positive and negative evidence. As a result of our assessment in the third quarter of 2024, we determined it was more likely than not that the deferred tax assets will not be recoverable based upon our three-year cumulative historical loss position as of September 28, 2024, largely resulting from the asset impairment and restructuring and other charges incurred during the quarter.
On July 4, 2025, the One Big Beautiful Bill Act ("the Act") was signed into law. The Act makes permanent key elements of the Tax Cuts and Jobs Act, including 100 percent bonus depreciation, domestic research cost expensing, increases the AMIC credit rate to 35 percent from 25 percent for qualifying assets and makes modifications to the international tax framework. The Act includes multiple effective dates, with certain provisions effective in 2025 and others phased in through 2027. We continue to evaluate the impact of the Act's provisions that take effect in future years.
Liquidity and Capital Resources
We believe we have sufficient sources of funding to meet our business requirements for the next 12 months and in the longer term. Our primary sources of liquidity are cash generated by operations and our total cash and short-term investments (defined below), supplemented by undrawn committed credit facilities and other borrowing capacity, recent equity securities agreements and issuances, possible future debt and equity issuances pursuant to our shelf registration statement, monetization of non-core assets and contributions from our Arizona SCIP partner.
| | | |
| Cash from Operating Activities and Adjusted Free Cash Flow $B |
| | | | | | | | |
| ■ Cash from Operating Activities | ■ Adjusted Free Cash Flow |
Cash from Operating Activities
Cash from operations is primarily made up of collections from customers and non-capital payments related to the manufacturing and sale of our products, including employee-related expenses. The amount of cash generated from our operations can vary depending on factors such as product pricing, volumes sold, production-related costs and other factors. Refer to "Operating Activities" below for additional information.
Adjustments to Cash from Operating Activities
Adjusted Free Cash Flow is a non-GAAP financial measure and an additional means used by management to evaluate the cash flow trends of our business as it is viewed as helpful in understanding our capital requirements and sources of liquidity. The measure is calculated using cash flow from operations and adjusted for the following:
▪additions to property, plant and equipment, net of proceeds from capital-related government incentives and net SCIP partner contributions; and
▪payments on financing leases.
This non-GAAP financial measure should not be considered a substitute for, or superior to, financial measures calculated in accordance with U.S. GAAP, and the financial results calculated in accordance with U.S. GAAP and reconciliations from these results should be carefully evaluated.
The following is the reconciliation of our most comparable U.S. GAAP measure to our non-GAAP measure presented:
| | | | | | | | | | | | | | | | | | | | | | | |
| Years Ended (In Millions) | | | Dec 27, 2025 | | Dec 28, 2024 | | Dec 30, 2023 |
| Net cash provided by (used for) operating activities | | | $ | 9,697 | | | $ | 8,288 | | | $ | 11,471 | |
| Net purchase of property, plant and equipment (net capital expenditures) | | | (11,204) | | | (10,515) | | | (23,228) | |
| Payments on finance leases | | | (105) | | | (1) | | | (96) | |
| | | | | | | |
| | | | | | | |
| Adjusted free cash flow | | | $ | (1,612) | | | $ | (2,228) | | | $ | (11,853) | |
| | | | | | | |
| Net cash provided by (used for) investing activities | | | $ | (14,821) | | | $ | (18,256) | | | $ | (24,041) | |
| Net cash provided by (used for) financing activities | | | $ | 11,587 | | | $ | 11,138 | | | $ | 8,505 | |
Short-Term Investing and Borrowing
When assessing our current sources of liquidity, we consider our total cash and short-term investments balances as follows:
| | | | | | | | | | | | | | |
| (In Millions) | | Dec 27, 2025 | | Dec 28, 2024 |
| Cash and cash equivalents | | $ | 14,265 | | | $ | 8,249 | |
| Short-term investments | | 23,151 | | | 13,813 | |
| | | | |
| | | | |
| | | | |
Total cash and short-term investments | | $ | 37,416 | | | $ | 22,062 | |
| Total debt | | $ | 46,585 | | | $ | 50,011 | |
| | | | |
| | | | |
In 2025, we settled in cash $3.7 billion of our senior notes that matured in March 2025 and July 2025. We expect to replace or amend the 364-day $5.0 billion credit facility agreement prior to its maturity at the end of January 2026. We have other potential sources of liquidity, including a $7.0 billion revolving credit facility, which remains available until February 2029, our commercial paper program and our automatic shelf registration statement on file with the SEC, pursuant to which we may offer an unspecified amount of debt, equity and other securities. Under our commercial paper program, we have an ongoing authorization from our Board of Directors to borrow up to $10.0 billion. We borrowed and repaid $3.5 billion in 2025 pursuant to our commercial paper program. As of December 27, 2025, we had no commercial paper obligations outstanding and no outstanding borrowings on the revolving credit facilities. See "Note 13: Borrowings" within Notes to Consolidated Financial Statements for further information.
Our total cash and investments and related cash flows may be affected by certain discretionary actions we may take with customers and suppliers to accelerate or delay certain cash receipts or payments to manage liquidity, among other factors, for our strategic business requirements. In 2025, these actions included, among others, negotiating with suppliers to optimize our payment terms and conditions, adjusting the amounts and timing of cash flows associated with customer sales programs and collections, managing inventory levels and purchasing practices and selling certain of our accounts receivable on a non-recourse basis to third-party financial institutions. While such actions have benefited, and may further benefit, cash flow in the near term, we may experience a corresponding detriment to cash flow in future periods as these actions cease or as the impacts of these actions reverse or normalize.
In August 2025, a major credit rating agency downgraded our corporate credit rating from BBB+ to BBB, citing execution risks tied to our technology roadmap and foundry strategy, delayed deleveraging and weaker than expected demand for our offerings. The downgrade may affect our future borrowing costs and access to capital markets.
We maintain a diverse investment portfolio that we continually analyze based on issuer, industry and country. Substantially all of our investments in debt instruments were in investment-grade securities in 2025.
Other Sources of Liquidity
As described in the introduction of this MD&A section, in the second half of 2025 we entered into and concluded upon certain investing and financing transactions, including the Altera divestiture and retained equity investment, an amendment to our CHIPS Act commercial agreement that accelerated $5.7 billion of funding to us, and private placement share sales agreements.
Also in 2025, we received net proceeds of $921 million from the net sale of 57.5 million of our Mobileye Class A shares, and we received $1.8 billion of cash proceeds, net of certain adjustments, related to the completion of the second phase of our NAND memory business divestiture. See "Note 4: Non-Controlling Interests" and "Note 10: Acquisitions and Divestitures" within Notes to Consolidated Financial Statements for further information.
Funding Requirements
Our short-term funding requirements include capital expenditures for worldwide manufacturing and assembly and test, including investments in our process technology roadmap; investments in our product roadmap; working capital requirements, including cash outlays associated with the 2025 Restructuring Plan and prepayments we may enter into to secure supply; partner distributions to our non-controlling interest holders; pending and potential acquisitions; and strategic investments. Our long-term funding requirements incrementally contemplate investments in significant manufacturing expansion plans and investments to accelerate our process technology. These plans include expanding existing operations in Arizona, New Mexico and Oregon and investing in a new leading-edge manufacturing facility in Ohio in the long term.
We adjust the cadence of our investments based on the execution of our roadmap and changing business conditions. As of December 27, 2025, we had commitments for capital expenditures of $9.1 billion for 2026 and had $3.7 billion in capital expenditures committed in the long term. As of December 27, 2025, other purchase obligations and commitments in 2026 under our binding commitments for purchases of goods and services were $2.2 billion, with an additional $4.5 billion committed in the long term.
In 2025, we recorded a $163 million benefit from the reduction of the previously accrued EC-imposed fine of $401 million recorded in 2023. While the fine remains unpaid on appeal, our obligation is guaranteed by a third party. We funded the guarantee in 2025 by depositing $340 million in legally restricted accounts.
In January 2026, Mobileye entered into a definitive agreement to acquire Mentee Robotics for an aggregate purchase price of approximately $900 million, subject to customary adjustments and closing conditions. Refer to "Note 10: Acquisitions and Divestitures" within Notes to Consolidated Financial Statements for additional details.
We have additional obligations as part of our ordinary course of business, which include the following:
▪related to our SCIP arrangements: variable distribution payments that we expect to make to our co-investment partners and liquidated damage provisions that trigger should we fail to meet certain construction milestones or operational metrics;
▪lease obligations which include supply agreements structured as leases; and
▪debt obligations.
Obligations outlined above are discussed in greater detail in "Note 4: Non-Controlling Interests", "Note 19: Commitments and Contingencies" and "Note 13: Borrowings" within Notes to Consolidated Financial Statements.
The expected timing of payments of our obligations is estimated based on current information. Timing of payments and actual amounts paid may be different, depending on the timing of receipt of goods or services or changes to agreed-upon amounts for some obligations. In addition, some of our purchasing requirements are not current obligations and are therefore not included in the amounts above. For example, some of these requirements are not subject to binding contractual arrangements or are fulfilled by vendors on a purchase order basis within short time horizons.
Cash Flows
Cash flows from operating, investing and financing activities were as follows:
| | | | | | | | | | | | | | | | | | | | |
| Years Ended (In Millions) | | Dec 27, 2025 | | Dec 28, 2024 | | Dec 30, 2023 |
| Net cash provided by (used for) operating activities | | $ | 9,697 | | | $ | 8,288 | | | $ | 11,471 | |
| Net cash provided by (used for) investing activities | | (14,821) | | | (18,256) | | | (24,041) | |
| Net cash provided by (used for) financing activities | | 11,587 | | | 11,138 | | | 8,505 | |
| | | | | | |
| Net increase (decrease) in cash and cash equivalents | | $ | 6,463 | | | $ | 1,170 | | | $ | (4,065) | |
Operating Activities
2025 vs. 2024
Operating cash flows consist of net income (loss) adjusted for certain non-cash items and changes in certain assets and liabilities.
Cash provided by operations in 2025 was higher by $1.4 billion compared to 2024, primarily due to generating net income in 2025 compared to a net loss in 2024. Net income in 2025 was favorably impacted by lower 2025 payroll related expenses resulting from headcount reductions under the 2025 and 2024 Restructuring Plans and other cost-reduction measures. These 2025 cash-favorable impacts were partially offset by lower favorable operating cash flow adjustments for non-cash items and certain cash unfavorable changes in working capital, both of which occurred in 2025 compared to 2024.
Investing Activities
2025 vs. 2024
Investing cash flows consist primarily of capital expenditures; investment purchases, sales, maturities and disposals; proceeds from capital-related government incentives; and proceeds from divestitures.
The decrease in cash used for investing activities in 2025 compared to 2024 was primarily due to lower capital expenditures, higher proceeds from the divestitures of our Altera and NAND memory businesses, and other cash-favorable investing activity, in each case in 2025 as compared to 2024. These 2025 cash-favorable activities were partially offset by the cash-unfavorable effects of higher purchases of short-term investments, net of sales and maturities, lower sales of equity investments, and lower proceeds from capital-related government incentives, in each case in 2025 as compared to 2024.
Financing Activities
2025 vs. 2024
Financing cash flows consist primarily of proceeds from strategic initiatives, including SCIP partner contributions, equity-related issuances, issuance and repayment of short-term and long-term debt, financing for capital expenditures with extended payment terms, and payments of dividends to stockholders.
The increase in cash provided by financing activities in 2025 compared to 2024 was primarily due to higher accelerated funds received from the U.S. government that we attributed for accounting purposes to common stock, warrants and Escrowed Shares issued, proceeds received from private sales of our common stock to Nvidia and Softbank Group, the absence of dividend payments, and proceeds from the sale of Mobileye shares, in each case in 2025 as compared to 2024. These 2025 cash favorable financing activities were partially offset by lower SCIP partner contributions, lower debt and commercial paper issuances, higher debt repayments, higher capital expenditures, and other cash-unfavorable financing activity in 2025 as compared to 2024.
Properties
As of December 27, 2025, our major facilities consisted of:
| | | | | | | | | | | | | | | | | | | | |
Square Feet (In Millions) | | United
States | | Other
Countries | | Total |
| Owned facilities | | 35 | | | 25 | | | 60 | |
| Leased facilities | | 2 | | | 3 | | | 5 | |
| Total facilities | | 37 | | | 28 | | | 65 | |
The facilities described above, including our principal executive offices located in the U.S., are suitable for our present purposes. The productive capacity in our facilities is being utilized or being prepared for utilization in support of our strategy. For more information on our manufacturing sites, see "Foundry" within "Our Business" in this Form 10-K.
We do not identify or allocate assets by operating segment; however, the majority of our facilities footprint supports manufacturing capabilities used by our Intel Foundry operating segment. For information on property, plant and equipment, net by country, see "Note 6: Other Financial Statement Details" within Notes to Consolidated Financial Statements.
Quantitative and Qualitative Disclosures About Market Risk
We are affected by changes in currency exchange and interest rates, as well as equity and commodity prices. Our risk management programs are designed to reduce, but may not eliminate, the impacts of these risks. All of the following potential changes are based on sensitivity analyses performed on our financial positions as of December 27, 2025 and December 28, 2024. Actual results may differ materially.
Currency Exchange Rates
We are exposed to currency exchange risks of non-U.S.-dollar-denominated investments in debt and equity instruments, and may economically hedge these risks with foreign currency contracts, such as currency forward contracts, currency swaps or interest rate swaps. Gains or losses on these non-U.S.-dollar investments are generally offset by corresponding losses or gains on the related hedging instruments.
Substantially all of our revenue is transacted in U.S. dollars. However, a portion of our operating expenditures and capital purchases are incurred in other currencies, primarily the Israeli shekel, the Malaysian ringgit, the European Union euro, the Japanese yen, and the Chinese yuan. We have established currency risk management programs to protect against currency exchange rate risks associated with non-U.S.-dollar forecasted future cash flows and existing non-U.S.-dollar monetary assets and liabilities. We may also hedge currency risk arising from funding of foreign currency-denominated future investments. We may utilize foreign currency contracts, such as currency forwards or option contracts in these hedging programs. We considered the historical trends in currency exchange rates and determined that it was reasonably possible that a weighted average adverse change of 10% in currency exchange rates could be experienced in the near term. Such an adverse change, after taking into account balance sheet hedges only and offsetting recorded monetary asset and liability positions outstanding as of December 27, 2025 and December 28, 2024 would result in an adverse impact on income before taxes of less than $38 million and less than $54 million, respectively.
Interest Rates
We are exposed to interest rate risk related to our fixed-rate investment portfolio and outstanding debt. The primary objective of our investment policy is to preserve principal and provide financial flexibility to fund our business while maximizing yields, which generally track SOFR. We generally enter into interest rate contracts to convert the returns on our fixed-rate debt investments with remaining maturities longer than six months into SOFR-based returns. We also entered into swaps to convert fixed-rate coupon payments into floating-rate coupon payments for a portion of our existing indebtedness. Gains or losses on these instruments are generally offset by corresponding losses or gains on the related hedging instruments.
A hypothetical change in benchmark interest rates of 1%, after taking into account investment hedges, would have resulted in a change in the fair value of our investment portfolio of less than $100 million as of December 27, 2025 and as of December 28, 2024.
Taking into account fixed-rate debt that is swapped to floating-rate debt, a hypothetical increase in interest rates of 1% would result in an increase in annual interest expense of approximately $97 million from debt outstanding as of December 27, 2025 ($120 million increase in annual interest expense from debt outstanding as of December 28, 2024).
Equity Prices
We are exposed to equity market risk through our investments in marketable equity investments, which we typically do not attempt to reduce or eliminate through hedging activities.
As of December 27, 2025, the fair value of our marketable equity investments was $484 million ($848 million as of December 28, 2024). The majority of our marketable equity investments portfolio as of December 27, 2025 was concentrated in securities traded on the New York Stock Exchange and the Hong Kong Stock Exchange. To determine reasonably possible decreases in the market value of our marketable equity investments, we have analyzed the historical market price sensitivity of our portfolio. Assuming a decline of 45% in market prices, the aggregate value of our marketable equity investments could decrease by $218 million, based on the value as of December 27, 2025 (a decrease in value of $466 million, based on the value as of December 28, 2024 using an assumed decline of 55%).
We utilize total return swaps to offset changes in liabilities related to the equity market risks of certain deferred compensation arrangements. Gains or losses from changes in fair value of these total return swaps are generally offset by the losses or gains on the related liabilities.
Many of the same factors that could result in an adverse movement of equity market prices affect our non-marketable equity investments, although we cannot always quantify the impacts directly. Financial markets are volatile, which could negatively affect the prospects of the companies we invest in, their ability to raise additional capital, and the likelihood of our ability to realize value in our investments through liquidity events such as IPOs, mergers and private sales. These types of investments involve a great deal of risk, and there can be no assurance that any specific company will grow or become successful; consequently, we could lose all or part of our investment. Our non-marketable equity investments had a carrying amount of $8.0 billion as of December 27, 2025 ($4.5 billion as of December 28, 2024).
Commodity Price Risk
Although we operate facilities that consume commodities, we are not directly affected by commodity price risk to a material degree. We have established forecasted transaction risk management programs to protect against fluctuations in commodity prices. We may use commodity derivatives contracts, such as commodity swaps, in these hedging programs. In addition, we have sourcing plans in place that are designed to mitigate the risk of a potential supplier concentration for our key commodities.
Critical Accounting Estimates
Our Consolidated Financial Statements are prepared in accordance with U.S. GAAP, which requires us to make certain estimates, judgments and assumptions that can affect the reported amounts of assets, liabilities, revenues, expenses and related disclosures. Critical accounting estimates are those estimates that involve a significant level of estimation uncertainty and have had, or are reasonably likely to have, a material impact on our financial condition or results of operations. We believe that the estimates, judgments and assumptions upon which we rely are reasonable based upon information available to us at the time such estimates, judgments and assumptions are made. To the extent that there are differences between these estimates, judgments or assumptions and actual results, our Consolidated Financial Statements could be affected. We have critical accounting estimates in the areas of inventories, property, plant and equipment, goodwill and loss contingencies. The discussion below supplements "Note 2: Accounting Policies" within Notes to Consolidated Financial Statements.
Inventories
Inventory is valued at the lower of cost or net realizable value and includes assumptions about future demand and market conditions. The valuation of inventory requires us to estimate obsolete and excess inventory, as well as inventory that is not of saleable quality. We use a demand forecast to develop our short-term manufacturing plans to enable consistency between inventory valuations and build decisions. Significant assumptions and estimates, which evolve each forecast cycle, that are utilized in our demand forecast and obsolete and excess inventory reserves process include:
▪customer and product-related factors, including a review of our customer base, the stage of the product life cycle, including limitations to demand forecasting for new products with minimal historical data, variations in market pricing and an assessment of selling price in relation to product cost;
▪market and economic factors, including cyclical changes in market conditions, the introduction of new or alternative products in the marketplace and the associated pricing environment; and
▪other factors, including tariff and export controls.
Each reporting period, we compare our demand forecast estimate to work-in-process and finished goods inventory levels to determine the amount, if any, of obsolete or excess inventory, which would be reflected in cost of sales and result in a negative impact to our gross profit in that period. If our assumptions and estimates for our demand forecast materially fluctuate and we fail to adjust manufacturing output accordingly or such assumptions and estimates are materially inaccurate, the related obsolete and excess inventory reserves can be materially impacted and result in reduced inventory values for products that we estimate have substantial sales risk. Our estimates for obsolete and excess inventory reserves were materially consistent with actual results in 2025, 2024 and 2023; however, our assumptions and estimates are inherently uncertain, and our gross profit would be adversely affected if future demand is less favorable than forecasted.
Property, Plant and Equipment
At least annually, we evaluate the period over which we expect to recover the economic value of our property, plant and equipment, considering factors such as the process technology cadence between node transitions, changes in machinery and equipment technology, and re-use of machinery and tools across each generation of process technology. As we make manufacturing process conversions and other factory planning decisions, we use assumptions involving the use of management judgments regarding the remaining useful lives of assets, primarily process-specific semiconductor manufacturing tools and building improvements. When we determine that the useful lives of assets are shorter or longer than we had originally estimated, we adjust the rate of depreciation to reflect the assets' revised useful lives. In 2025 and 2024, we evaluated our current process technology node capacities relative to projected market demand for our products and services, and concluded that our manufacturing asset portfolio exceeded manufacturing capacity requirements, which resulted in us shortening the useful lives of certain placed-in-service equipment and recording accelerated depreciation charges of $456 million and $992 million, respectively. These amounts exclude charges associated with certain business exits that we incurred in connection with our 2025 Restructuring Plan and 2024 Restructuring Plan.
Our property, plant and equipment are subject to periodic impairment reviews. Factors that we consider in deciding when to perform an impairment review include significant changes or planned changes in our use and fungibility of certain property, plant and equipment, significant under-performance of a business or product line in relation to expectations for which property, plant and equipment relate, and significant negative industry or economic trends. To perform an impairment review, our property, plant and equipment are grouped and evaluated for impairment at the lowest level of identifiable cash flows, which requires management judgment to form asset groupings and to estimate expected cash flows that are attributable to asset groupings, among other factors. If an indicator of impairment is identified at the asset grouping level, we measure the recoverability of the assets by comparing the carrying value of the asset grouping to our estimate of the related total future undiscounted net cash flows arising from the use of that asset grouping. If an asset grouping carrying value is not determined to be recoverable through this undiscounted cash flows analysis, the fair value of the asset grouping must be determined. An impairment is recognized if the carrying value of the asset grouping exceeds the determined fair value. The resulting charge is classified to expense, which is typically to cost of sales in a similar manner as the corresponding depreciation expense and results in a negative impact to our gross profit in that period. In 2025 and 2024, we determined certain property, plant and equipment, which had not yet been placed in service, exceeded our projected capacity requirements and incurred non-cash impairment charges of $494 million and $2.3 billion, respectively. These amounts exclude charges associated with business exits that we incurred in connection with our 2025 Restructuring Plan and 2024 Restructuring Plan.
Goodwill
We perform an annual impairment assessment of goodwill at the reporting unit level in the fourth quarter of each year, or more frequently if indicators of potential impairment exist. We have five reporting units with allocated goodwill, which generally align to our operating segments. We reevaluate our identified reporting units annually or when triggered, such as upon reorganization of our operating segments or due to business reasons that result in material changes as to how our reporting units are organized and managed. Impairment assessments may be qualitative or quantitative in nature. A quantitative assessment is required if we determine, based on a qualitative assessment, that it is more likely than not that a reporting unit’s fair value is less than its carrying value, or if there are material changes to the structure of our reporting units. The reporting unit's carrying value used in an impairment assessment represents the allocation of various assets and liabilities, excluding certain corporate assets and liabilities, such as cash, investments and debt. While a substantial majority of our allocable assets, primarily property, plant and equipment, are attributable to our Intel Foundry reporting unit, that reporting unit has no remaining allocated goodwill.
Our qualitative assessment considers industry and market considerations, overall financial performance and other relevant events and factors affecting our reporting units or Intel as a whole. More specifically, qualitative factors may include a sustained decrease in our consolidated market capitalization or one of our reporting units’ market capitalization relative to each’s respective net book value; significant company specific actions, including changes to the structure of our reporting units; and current, historical or projected deterioration of our financial performance. We may also perform a quantitative analysis to support the qualitative factors by applying sensitivities to assumptions and inputs used in measuring a reporting unit's fair value.
Our quantitative impairment assessment considers both the income approach and the market approach to estimate a reporting unit's fair value. The income approach estimates fair value using discounted future cash flows for a reporting unit primarily using the following major assumptions and inputs: revenue, based on assumed market segment growth rates and our assumed market segment share; estimated costs; and appropriate discount rates based on a reporting unit's weighted average cost of capital. Our quantitative impairment assessment is sensitive to changes in underlying estimates and assumptions, the most sensitive of which is the discount rate. The major inputs and assumptions used in estimating discounted cash flows are derived from historical data, various internal estimates and a variety of external sources, which are similar to those used in our business planning and forecasting processes. We test the reasonableness of the inputs and outcomes of our discounted cash flow analysis against available market data. Our estimates and assumptions are inherently uncertain and change over time based on operating results, market conditions and other factors and could materially affect the determination of the fair value and potential goodwill impairment for each reporting unit.
The market approach estimates fair value using financial multiples and transaction prices of comparable companies.
To corroborate our fair value conclusions, we combine the estimated fair values for all reporting units and perform a market capitalization reconciliation as of the goodwill assessment date to validate the reasonableness of the implied control premium relative to relevant market transactions in similar industries. For this reconciliation, we calculate market capitalization using both the spot stock price as of the assessment date as well as the average stock price over a reasonable period of time preceding the assessment date. If the reconciliation were to result in an unreasonable control premium, we would reassess the key inputs and assumptions underlying our valuation, which could result in the recognition of an impairment charge.
During the fourth quarter of 2025, we completed our annual goodwill impairment assessment which indicated that a more detailed quantitative analysis was necessary for our Mobileye reporting unit, primarily due to the decline in Mobileye's market capitalization below the carrying value of Mobileye's net assets. Our quantitative assessment was performed by measuring Mobileye's fair value using the income approach. When using the income approach, we tested the reasonableness of the inputs and outcomes of our discounted cash flow analysis against available market data. As a result of this impairment test, no impairment charge was recognized as the estimated fair value was higher than the assigned carrying value of the Mobileye reporting unit. As of December 27, 2025, our Mobileye reporting unit had $8.2 billion in recorded goodwill and our estimated fair value exceeded the assigned carrying value by less than 10%. Should our estimates change based on Mobileye's operating results, market conditions, long-term growth projections, or other assumptions underlying our forecast, including changes to the discount rate, the Mobileye reporting unit may become subject to impairment in future periods. For example, a 1% increase in the discount rate would have resulted in an impairment of our Mobileye reporting unit’s goodwill of approximately $871 million in the fourth quarter of 2025. Finally, to corroborate our estimated fair value of the Mobileye reporting unit, we performed a reconciliation to Mobileye's market capitalization as of December 27, 2025, concluding that the implied control premium was reasonable as compared to relevant market transactions in similar industries. Our impairment conclusion is sensitive to Mobileye's market capitalization in that a further sustained decline in Mobileye's market capitalization would require additional analysis to support the reasonability of our implied control premium, and may require adjustments to certain key assumptions underlying our valuation and may result in an impairment charge in a future period. Subsequent to our assessment date, we continued to closely monitor the Mobileye reporting unit's financial performance, business forecasts, and market capitalization noting no material changes. Notwithstanding Mobileye, our annual qualitative assessment did not indicate that a more detailed quantitative analysis was necessary for our other reporting units as the most recently calculated fair value substantially exceeded the assigned carrying value for each reporting unit as of our assessment date.
Our quarterly qualitative impairment assessment for the third quarter of 2024 indicated that a more detailed quantitative analysis was necessary for certain of our reporting units, primarily due to the decline in our market capitalization below the carrying value of our net assets, as well as the decline in our Mobileye reporting unit's market capitalization below the carrying value of Mobileye's net assets. As a result of our impairment tests, we recognized a non-cash goodwill impairment charge of $2.8 billion in the third quarter of 2024, substantially all of which related to our Mobileye reporting unit, as the estimated fair value of the reporting unit was lower than the assigned carrying value. For each of our non-impaired reporting units, the estimated fair value substantially exceeded the assigned carrying value as of the assessment date. Additionally, we performed a market capitalization reconciliation as of September 28, 2024, for both Intel and Mobileye, concluding that the implied control premiums were reasonable. In the fourth quarter of 2024, as a part of our annual goodwill impairment assessment, we determined that the estimated fair value of each reporting unit substantially exceeded the assigned carrying value, with the exception of one reporting unit with a significant amount of assigned goodwill: Mobileye. While no additional impairment was recognized during the fourth quarter of 2024 for the Mobileye reporting unit as the most recently calculated fair value exceeded the assigned carrying value, our impairment conclusion remained sensitive to changes in Mobileye's operating results, market conditions, long-term growth projections, and other assumptions underlying our forecast, including changes to the discount rate.
Loss Contingencies
We are subject to loss contingencies, including various legal and regulatory proceedings, asserted and potential claims, liabilities related to repair or replacement of parts in connection with product defects, as well as product warranties that arise in the ordinary course of business and are subject to change, including due to sudden or rapid developments in proceedings or claims. An estimated loss from such contingencies is recognized as a charge to income if it is probable that a loss has been incurred and the amount of the loss can be reasonably estimated. We evaluate developments that could affect prior disclosures or previously accrued liabilities, and make adjustments as appropriate. Significant judgment is required to determine both the likelihood of there being, and the estimated amount of, a loss related to such matters. Certain factors have resulted in significant changes to our judgments and estimates that we made regarding these matters in previous quarters based on updated information that became available. If one or more of these matters were resolved against us for amounts in excess of management's estimates of losses, our results of operations and financial condition could be materially adversely affected.
The following summarizes what we believe to be the material factors that make an investment in our securities speculative or risky. When any one or more of the following risks materialize from time to time, our business, reputation, financial condition, cash flows and results of operations may be materially and adversely affected, and the trading price of our common stock could decline. These risk factors do not identify all risks that we face; we may also be affected by factors that are not presently known to us or that we currently consider to be immaterial, or by various risks that are generally applicable to most companies. Due to risks and uncertainties, known and unknown, our past financial results may not be a reliable indicator of future performance, and historical trends should not be used to anticipate results or trends in future periods. Some of the factors, events and contingencies discussed below may have occurred in the past, and while we highlight certain noteworthy examples from recent years where occurrences of such factors, events or contingencies had a material adverse effect on our business, such examples do not represent all of the instances where the factors, events or contingencies have occurred. Refer also to the other information set forth in this Form 10-K, including in the MD&A and Financial Statements and Supplemental Details sections.
We are in a highly competitive and rapidly changing industry.
The industry in which we operate is highly competitive and subject to rapid technological, geopolitical and market developments; changes in industry standards; changes in customer and end-user needs, expectations and preferences; and frequent product introductions and improvements. When we do not anticipate or respond to these developments, our competitive position can weaken and our products or technologies can become uncompetitive or obsolete. Our competitive environment has intensified in recent years, and we expect it to continue to do so in the future, including as a result of the proliferation of AI and high demand for AI-related products and services. In addition, many of our competitors have substantially greater financial resources than us. If we are not able to compete effectively, or if our external foundry strategy is unsuccessful, our financial results will be adversely affected, including through reduced revenue and gross margin, and we may be required to accelerate the write-down of the value of certain assets.
We face intense competition across our product portfolio. Our competitors include companies offering platform products, such as AMD and Qualcomm; accelerator products such as GPUs, including those offered by NVIDIA and AMD; other accelerator products such as ASICs, application-specific standard products and FPGAs; memory and storage products; connectivity and networking products; and other semiconductor products. Some of these competitors have developed or utilize competing computing architectures and platforms, such as the ARM architecture, and these architectures and platforms can produce beneficial network effects for competitors when an ecosystem of customers and application developers for such architectures and platforms grows at scale. ARM-based products and the ARM ecosystem have seen increased development and adoption in recent years. We also compete with internally developed semiconductors from OEMs, cloud service providers, and others, some of whom are customers. Some of these customers vertically integrate their own semiconductor designs with their software assets and/or customize their designs for specific computing workloads. For example, in 2020, Apple introduced PC products utilizing its own internally developed ARM-based semiconductor designs in place of our client CPUs, and we face increasing competition from Apple's products and ecosystem. More recently, a number of hyperscaler customers have increasingly developed their in-house semiconductor design capabilities and moved to using custom or semi-custom products.
Most of our competitors rely on third-party foundries, such as TSMC or Samsung, for the manufacture and assembly and test of their semiconductor components and products. Manufacturing process and assembly and test improvements introduced by such foundries have contributed, and may continue to contribute, to increasingly competitive offerings by our competitors. Our process technology roadmap to regain transistor performance and power performance competitiveness is subject to a number of risks, and we could fail to realize our goals, including due to changes in competitor technology roadmaps, changes affecting our projections regarding our technology or competing technology, and the risks inherent in the development and implementation of new semiconductor products and manufacturing process technologies. As an integrated device manufacturer, we have higher capital expenditures and R&D spending than many of our fabless competitors due to the high ongoing investments required to maintain leading-edge process technology and manufacturing capacity. We also face new sources of competition as a result of changes in industry participants through, for example, acquisitions or business collaborations, as well as new entrants, including in China, which could have a significant impact on our competitive position. For example, we could face increased competition as a result of China's programs to promote a domestic semiconductor industry and supply chains.
Our products compete based on a number of factors, including performance, energy efficiency, ease-of-integration, ease-of-use, innovative design, features, workload optimization, price, quality, reliability, security, software ecosystem and developer support, time-to-market, reliable product roadmap execution, brand recognition, customer support and customization and availability. The importance of these factors varies by product and market segment. To the extent our products do not meet our customers' requirements across these factors in an increasingly competitive landscape, our business and results of operations can be harmed. For example, we have lost market share in recent years, including in both client and data center markets, in the market for x86-based semiconductor products, and more generally in the markets for semiconductor compute products, as competitors have introduced highly competitive data center and client platform products. Our data center business has been further negatively impacted in the past few years by the significant shift of customer spend toward GPUs optimized for AI workloads, a rapidly developing and very significant compute market where we have been unsuccessful to date in becoming a meaningful participant. Additionally, to the extent we rely upon third party foundries for our products, our margins may be negatively impacted.
We have limited experience in the highly competitive and capital-intensive third-party foundry business. As we pursue our strategy to establish Intel Foundry as a major provider of foundry capacity to manufacture semiconductors for others, we face intense competition from well-established competitors such as TSMC, Samsung, Global Foundries, UMC and SMIC. To succeed, we need to compete effectively across factors such as availability and time-to-market of manufacturing technology; advances in manufacturing processes in areas such as performance, performance per watt and density; multi-chip packaging; system integration; manufacturing capacity; price; margin; ease of use; quality; yields; customer satisfaction; and ecosystem support. Building and maintaining a competitive foundry business requires significant ongoing investments to maintain leading-edge process technology and manufacturing capacity, which investments in many instances must be made ahead of customer commitments and may not be recouped. As we have reassessed demand and our "shell ahead" strategy, and our financial results in the last few years have constrained our ability to make capital investments, we have delayed or cancelled manufacturing facility construction or expansion projects in Ohio, Germany, Poland, Malaysia and Israel and initiated the consolidation of our assembly and test facility in Costa Rica into our other facilities, and we may have additional project delays or project cancellations in the future. Moreover, many of the largest potential foundry customers are fabless semiconductor companies whose products compete with our own. As a result, our strategy requires us to overcome customer concerns regarding protection of confidentiality information, intellectual property, and foundry capacity, among other competitive concerns, to attract and retain such customers. Our limited third-party foundry experience also means we must continue to hire and retain talented employees with relevant foundry experience with respect to both leading-edge and legacy nodes. Our efforts may be hindered by the higher costs of, regulatory and environmental restrictions imposed upon, and time it takes to build fabrication and assembly and test facilities in the jurisdictions in which we operate and plan to build new or upgrade existing foundry facilities as compared to the jurisdictions in which our competitors predominantly operate their foundry facilities. Our construction projects to expand capacity require available sources of labor, materials and equipment. Increasing demand for such sources, including from other foundries; supply constraints, labor shortages and other adverse market conditions; issues with permits or approvals; on-site incidents; and other construction issues arise from time to time and can result in significant delays and increased costs for our projects, as well as legal and reputational harm. These significant hurdles to our foundry strategy make it highly risky and our success highly uncertain.
We are making significant, long-term and inherently risky investments in R&D and manufacturing facilities that may not realize a favorable return.
To compete successfully, we must maintain an effective R&D program, develop new products and manufacturing processes, improve our products and processes and make significant capital investments in new and existing manufacturing facilities, all ahead of competitors and market demand. The R&D efforts and capital investments we require are significant as we compete across both product and process technologies and we may not have the ability to fund such investments at the level needed to be competitive. We incurred R&D expenses of $13.8 billion in 2025, $16.5 billion in 2024 and $16.0 billion in 2023. We are focusing our R&D efforts across several key areas, including process and packaging technology, our xPU products and features, AI and software. Our investments are typically long-term and, even where successful, often do not contribute to our operating results for a number of years. We cannot guarantee that our efforts will deliver the benefits we anticipate, including as a result of our new products or technologies falling short of expectations or the offerings of competitors. In recent years, we have had a number of delays in the release of new products, including as a result of defects or errata, late changes to features due to customer requests, or other design challenges for our products. We have similarly had delays in our development of new process technologies and advanced packaging techniques, including with respect to performance and yield. These delays have allowed competitors using third-party foundries, such as TSMC, to benefit from advancements in manufacturing processes introduced ahead of us, including improvements in performance, energy efficiency and other features, which have helped increase the competitiveness of their products. We also missed the significant shift in compute demand to GPUs optimized for AI workloads and have been unsuccessful to date in becoming a meaningful participant in that market while certain of our key competitors have been highly successful in that market. Our most recent efforts to compete in the accelerator market with our Gaudi AI accelerators was unsuccessful, as a result of which we recognized Gaudi AI accelerator inventory-related charges of $375 million in 2025 and $922 million in 2024. To the extent we do not timely introduce new products and manufacturing process technologies that improve performance, performance per watt, transistor density, die utilization, core counts and/or new features such as optimizations for AI and other workloads, with sufficient manufacturing yields and operational efficiency, relative to competitors and competing foundry processes, we have faced and will face cost, product performance and time-to-market disadvantages relative to our competitors. This has in the past and may in the future result in higher operating costs, including as a result of additional costs from unused manufacturing capacity, higher leverage and borrowing costs and pressure on our credit ratings.
When the introduction of next-generation process technologies is delayed, adding cores or other competitive features to our products can result in larger die size products, manufacturing supply constraints and increased product costs. Lower manufacturing yields and longer manufacturing throughput times, compared to previous process nodes, can increase our product costs, adversely affect our gross margins and contribute to manufacturing supply constraints. A new process node typically has higher costs compared to a mature node due to factors that include higher depreciation costs and lower yields, and costs and yields at times do not improve at the same rate as on prior nodes. In addition, the cost of new leading-edge process nodes continues to increase at a higher rate relative to legacy process nodes due to a number of factors, including the cost of procuring and operating advanced manufacturing equipment. As the die size of our products has increased and our manufacturing process nodes have increased the number of transistors per die, our products and manufacturing processes have grown increasingly complex and more susceptible to product defects and errata, which at times also contribute to production timing delays and lower yields that may also increase our costs to manufacture and warranty our products.
We have adopted a disaggregated design architecture for most of our newer and more high-end products and a number of our future products in which different processors and components, or tiles, can be manufactured on different processes and connected by advanced packaging technology into a single package. This approach introduces new areas of complexity in design and manufacturability, particularly in the deployment of advanced packaging technologies, several of which are novel, have a limited manufacturing history or have increased costs. Delays or failures in implementing disaggregated designs or the individual components thereof could adversely affect our ability to timely introduce competitive products. Further, some of our newer and more high-end products and a number of our future products involve the use of tiles manufactured by TSMC, a key competitor on the foundry side of our business, or other third-party foundry suppliers. To the extent there is any interruption in the supply of tiles manufactured by TSMC or any other third-party foundry supplier, whether as a result of a dispute or otherwise, we would be unable to complete assembly of complete products requiring such tiles until such time as we could design and manufacture replacement tiles and source such tiles from an alternative supplier, which would likely involve a substantial delay given the bespoke design of each tile to the particular manufacturing process utilized. As such, our disaggregated design approach involves significant supply chain risk to our ability to manufacture and sell our products that could have a material adverse impact on business and financial results. Further, to the extent we adopt a disaggregated design approach for products that compete with competitors’ products that use a more traditional monolithic chip design, we may be at a significant cost disadvantage that adversely impacts the profitability or the success of our products.
The investments required for our leading-edge process technology development and our worldwide manufacturing and assembly and test require capital expenditures above our historical levels. In recent years, the semiconductor manufacturing industry has seen very significant increases in the capital investments required for manufacturing facilities utilizing leading-edge process technologies, including as a result of the use of EUV and high-NA EUV lithography tools. Our ownership and operation of such high-tech fabrication facilities, and our need to build new and expand or upgrade existing facilities in anticipation of future products and demand, has resulted and will continue to result in our incurring large capital outlays and high costs that are fixed or difficult to reduce in the short term. Such capital outlays and costs include those related to utilization of existing facilities, facility construction and equipment, R&D, and the employment and training of a highly skilled workforce. To the extent customers are unwilling to pay prices to access the features that our process and product investments are expected to deliver, or if demand for our products, foundry capacity and assembly and test capacity decreases or we fail to forecast demand accurately, our gross margin and operating income can be disproportionately affected due to our high fixed cost structure, which is difficult to reduce quickly in response to lower demand and other unfavorable market factors. As we have reassessed demand and our "shell ahead" strategy, and our financial results in the last few years have constrained our ability to make capital investments, we have delayed or cancelled manufacturing facility construction or expansion projects in Ohio, Germany, Poland, Malaysia and Israel and initiated the consolidation of our assembly and test facility in Costa Rica into our other facilities. We could also be required to write off inventory or record excess manufacturing capacity charges, which would also lower our gross margin and operating income. To the extent the demand decrease is prolonged, our manufacturing or assembly and test capacity could be underutilized, and we may be required to write down our long-lived assets, which would increase our expenses. We may also be required to shorten the useful lives of under-used facilities and equipment and accelerate depreciation. For example, in 2025 and 2024 we recorded $950 million and $3.3 billion, respectively, of charges related to non-cash impairments and the accelerated depreciation for certain manufacturing assets that were determined to have no remaining or reduced operational use.
If we are unable to secure a significant external foundry customer for Intel 14A, our next generation semiconductor manufacturing process technology, we may pause or discontinue our pursuit of next generation leading-edge process technologies.
As an integrated design manufacturer (IDM) with a products business that depends on access to leading-edge semiconductor manufacturing process technologies, or nodes, to produce competitive products, we have historically invested significant capital resources to continually develop new generations of leading-edge nodes and foundry capacity to produce such nodes. However, as described above, the design, development and manufacturing of leading-edge nodes is risky and capital-intensive, and it takes years for capital investments to yield a return. If we are unable to secure a significant external customer for our Intel 14A node, we may pause or discontinue development of Intel 14A and subsequent next generation leading-edge nodes. While we remain focused on continued development of Intel 14A and securing such a significant external customer, we have taken steps to reduce our overall investment and have further slowed down the construction of the new leading-edge fabrication facilities we are building in Ohio. In addition, while we continue to evaluate Intel 14A for use in future Intel products and our plan includes an initial product designed to utilize Intel 14A, at present we are maintaining the option to design future Intel products requiring nodes with performance beyond Intel 18A and Intel 18A-P to be produced internally or by an external foundry. We have been unsuccessful to date in securing any significant external foundry customers for any of our nodes and our prospects for securing a significant external foundry customer for Intel 14A are uncertain.
If we were to pause or discontinue the design, development and manufacturing of Intel 14A and other next generation leading-edge nodes, we would be subject to a number of significant strategic business, financial, operational and reputational risks and repercussions including, but not limited to:
▪Dependence on Third-Party Foundries. Our products business would, over time, become dependent on third-party foundries, particularly TSMC, as we develop products for nodes beyond Intel 18A and Intel 18A-P. We have no long-term contract with TSMC, and if we are unable to secure and maintain sufficient capacity on favorable pricing terms, we may be unable to manufacture our products in sufficient volume and at a cost that supports the continued success of our products business. Further, most of our competitors have longer and more established relationships with TSMC and other third-party foundries than we do, which may put us at a competitive disadvantage. There are few foundries capable of producing the leading-edge and near-leading-edge nodes needed for our products – currently only TSMC and Samsung. To the extent our competitors are more successful than us in securing capacity with those foundries than we are, our product roadmap, market position and customer relationships would be materially adversely impacted.
▪Losses with Respect to our Investments in R&D and Manufacturing Facilities and Equipment: We had over $100 billion of property, plant and equipment, net on our balance sheet as of December 27, 2025, the substantial majority of which we estimate relate to our foundry business. While the significant majority of this relates to our existing and in-development nodes, including Intel 18A and Intel 18A-P, with each transition to a new node we continue to utilize some R&D and manufacturing assets from prior nodes. If we were to pause or discontinue the design, development and manufacturing of Intel 14A and other next generation leading-edge nodes, we would expect to incur significant material impairments with respect to foundry assets that may impact our results of operations. For example, we would likely discontinue the new leading-edge fabrication facilities we are building in Ohio. We also would expect to incur additional costs and expenses as we wind down other projects and facilities and reduce headcount.
▪Loss of Eligibility for Government Incentives. We have also entered into government incentive arrangements with local, regional and national governments, both U.S. and non-U.S. If we were to pause or discontinue the design, development and manufacturing of Intel 14A, we may lose eligibility for various incentives contemplated by these arrangements, and we may be required to repay amounts already received under these arrangements.
▪Potential Penalty Payments Under our SCIP Agreements. To support our capital investments in recent years, we pursued alternative financing arrangements including our 2022 joint investment with Brookfield in the manufacturing expansion of our Arizona campus and our 2024 joint investment with Apollo related to Fab 34 in Ireland. Our potential pause or discontinuation of the design, development and manufacture of Intel 14A may accelerate our move to third-party foundry services for our products and result in our inability to satisfy construction and/or wafer demand and purchase commitments in those arrangements, potentially requiring substantial additional payments to our SCIP partners.
▪Loss of Talent. Historically, as one of the only companies in the world, and the only company in the U.S., pursuing the design, development and manufacturing of next generation leading-edge nodes, we have benefitted from being in a unique position as an employer to hire and retain scientists, engineers, and other technical talent interested in being on the cutting edge of semiconductor innovation. If we were to pause or discontinue leading-edge node design, development and manufacturing, or any perception that we may do so in the future, may materially adversely impact our ability to hire and retain key talent across our foundry organization and the company more broadly, and we risk substantial loss of historical, technical and other expertise.
▪Limited External Foundry Potential. We have been unsuccessful to date in attracting significant customers to our external foundry business. If we were to pause or discontinue our pursuit of Intel 14A and successor nodes, it is highly uncertain whether we would be able to develop this business. Among other things, our existing nodes (Intel 7, Intel 4 and Intel 3) were designed for Intel products, and if potential customers for our upcoming Intel 18A-P node believe we are no longer committed to continued development of next generation leading-edge nodes (Intel 14A and beyond), they may be inclined to remain with their current foundry partners and unwilling to make the significant investments of time and resources needed to develop products on our nodes.
▪Other Significant Financial, Operational and Reputational Risks. If we pause or discontinue the design, development and manufacture of Intel 14A and future leading-edge nodes, it may give rise to additional material risks that we are not able to foresee or that are more significant than we anticipate, including, but not limited to, adverse impacts to our relationships and the terms of our engagements with customers, suppliers and strategic partners, potential credit rating risk, and diminished investor confidence and increased stock price volatility. It is also uncertain what actions, if any, may be taken by the U.S. and other governments to the extent they view a potential discontinuation of our leading-edge process technology design, development and manufacturing as a strategic risk from a national economic or defense perspective.
Any of the foregoing could have a material adverse impact on our revenue, operations, financial position, cash flows, access to financing, cost structure, competitiveness, reputation, profitability and prospects and could exacerbate other risks discussed in this Form 10-K. Further, given the decades of significant continuous investments in R&D, talent accumulation, intellectual property, state-of-the-art facilities and technical know-how needed to compete in leading-edge node design, development and manufacturing, any decision to pause or discontinue our pursuit of Intel 14A and successor leading-edge process technologies may be effectively irreversible.
Our alternative financing arrangements and pursuit of government grants involve risks and may not be successful.
To support our capital investments, we have pursued alternative financing arrangements, such as our 2022 joint investment with Brookfield in the manufacturing expansion of our Arizona campus, and our 2024 joint investment with Apollo related to Fab 34 in Ireland, and may enter into similar arrangements in the future. These transactions may fail to advance our business strategy, may include unfavorable pricing or other terms such as penalties should key metrics not be attained as prescribed by our agreements, and may fail to achieve their anticipated benefits. Both arrangements include commitments we may not be able to satisfy, including commitments relating to construction and/or wafer demand or purchase, in which case we may be required to make additional payments to our partners. For example, in the fourth quarter of 2024, we recognized a $755 million charge related to penalties we expect to pay in connection with Ireland SCIP for construction delays we decided to make as we reduced our near-term capacity requirements. Further, both arrangements are expected to significantly and increasingly impact our net income (loss) attributable to Intel and earnings (loss) per share attributable to Intel in future periods as wafer production volumes increase at our expanded Arizona campus and at Fab 34 in Ireland. Our partners may also fail to satisfy financial or other obligations on which we rely and we may fail to resolve any potential disputes. Any of these risks, including our ability to effectuate any additional transactions at all, could have a material adverse effect on our business, results of operations, financial condition or cash flows, which may limit our ability to raise sufficient capital for our required investments.
In addition, we have applied for, received and expect to receive additional grants and incentives from domestic and foreign local, regional and national governments. Legislation in the U.S. and EU has been adopted to provide government funding for semiconductor manufacturing expansions in those regions. However, any amounts we may receive under any agreements enabled by such legislation may not be sufficient in amount or timeliness to support our capital investment plans and offset the higher costs of operations in many of the locations of our facilities as compared to those of many of our competitors, we may be unable to comply with the requirements and limitations of any such grants and incentives, or such agreements may contain restrictions that limit our flexibility to pursue changes in business strategy or transactions that may enhance stockholder value. To the extent funding is below our expectations, we elect not to accept any grants or incentives due to burdensome compliance requirements, we are required to return any amounts received from any grants or incentives due to an inability to comply with any requirements or limitations contained therein, we are subject to restrictions as a result of any awards we have accepted, or the U.S. government delays or does not provide any awards that have been agreed upon, our anticipated cash requirements may increase, our strategy, business and financial results may be adversely affected, and we may be constrained in our ability to engage in transactions that are in the best interests of our stockholders.
There are a number of risks and uncertainties associated with the U.S. government’s acquisition of significant equity interests in us.
Our transactions with the U.S. government during the third quarter of 2025, including the equity issuances and the amendment to our commercial CHIPS Act agreement, are complex and subject to a number of risks and uncertainties:
▪The legislative, judicial or executive branches of the U.S. government could determine in the future that all or a portion of the transactions were unauthorized, void or voidable. While the U.S. Department of Commerce, or DOC, is contractually bound under the agreement, no other agency or branch of the U.S. government has made commitments to support, refrain from challenging or otherwise impeding the transaction. Legal challenges, administrative rulings, litigation by other parts of the U.S. government or third parties, or geopolitical developments could materially impair funding, alter obligations under our CHIPS Act agreements, or otherwise adversely affect the transactions and the benefits we expect to receive. In addition, enforcement against a government counterparty is inherently uncertain given the defenses available to the U.S. government.
▪The transactions eliminate our contractual rights to receive future funds under the commercial CHIPS Act agreement and Secure Enclave agreement in the form of grants and may limit our ability to secure grants from government entities in the future. In converting future grant funding into investments in common stock by the U.S. government, the transactions make it such that we will no longer benefit from the reduced future operating costs made possible by such grant funding. In addition, our business is highly capital intensive and we have a number of other current grant arrangements with government entities, and may seek to pursue such arrangements in the future. It is uncertain whether the transactions may cause other government entities to seek to convert their existing grant arrangements with us into equity investments or be unwilling to support us with future grants, either of which could limit our access to capital, increase our cost of capital or increase our future operating costs.
▪The transactions are dilutive to existing stockholders. The issuance of shares of common stock to the U.S. government at a discount to the current market price is dilutive to existing stockholders, and stockholders may suffer significant additional dilution if the conditions to the warrant are triggered and the warrant is exercised.
▪The U.S. government’s equity position reduces the voting and other governance rights of our other stockholders and may limit potential future transactions that may be beneficial to such stockholders. The transactions resulted in the U.S. government becoming one of our largest stockholders. The U.S. government’s interests in us may not be the same as those of other stockholders. The U.S. government has agreed to vote its shares of common stock as recommended by our board of directors, subject to applicable law and exceptions to protect the U.S. government’s interests. This will reduce the voting influence of other stockholders with respect to the selection of our directors and proposals voted on by our stockholders. The existence of a significant U.S. government equity interest, the voting of such shares either as directed by our board of directors or the U.S. government, and the U.S. government’s substantial additional powers with respect to the laws and regulations impacting us, may substantially limit our ability to pursue potential future strategic transactions that may be beneficial to stockholders, including by potentially limiting the willingness of other third parties to engage in such potential strategic transactions with us.
▪Our non-U.S. business may be adversely impacted by the U.S. government being a significant stockholder. Sales outside the U.S. accounted for 70% of our revenue for 2025. Having the U.S. government as a significant stockholder could subject us to additional regulations, obligations or restrictions, such as foreign subsidy laws or otherwise, in other countries.
Any of the foregoing could have a material adverse effect on our revenue, operations, financial position, cash flows, access to financing, cost structure, competitiveness, reputation, profitability and prospects and could exacerbate other risks discussed in this Form 10-K.
Changes in product demand and margins can adversely affect our financial results.
Our products are used in different market segments, and demand for our products varies within or among them. It is difficult to forecast these changes and their impact. For example, we expect the PC TAM to grow over time, driven by factors such as a larger installed base, demand for AI capabilities, new platforms, shorter replacement cycles, and adoption in new markets; however, the PC industry has been highly cyclical in the past, and these growth expectations may not materialize, or we may fail to capitalize on them. Changes in the demand for our products have in the past and may in the future reduce our revenue, lower our gross margin, or require us to write down the value of our assets.
Important factors that lead to variation in the demand for our products include:
▪business conditions, including downturns in the market segments in which we operate, or in global or regional economies;
▪consumer confidence, income levels and customer capital spending, which can be impacted by changes in market conditions, including changes in government borrowing or spending, taxation, interest rates, the credit market, current or expected inflation, employment, and energy or other commodity prices;
▪customer product needs and emerging technology trends, including changes in the levels and nature of customer and end-user computing workloads, such as the shift in data center spend to GPUs to support AI workloads;
▪geopolitical conditions, including trade policies, tariffs or other trade restrictions and geopolitical tensions and conflicts;
▪our ability to timely introduce competitive products;
▪competitive pricing pressures, new product introductions and other actions taken by competitors;
▪the level of our customers' inventories and computing capacity;
▪customer order patterns and order cancellations, including as a result of maturing product cycles for our products, customers' products and related products such as operating system upgrade cycles; and
▪industry disruptions affecting us and our customers, such as the industry substrate and component shortages that negatively impacted demand across several of our businesses in 2021, the delays in obtaining tools, components and other supplies as a result of COVID-19-related port shutdowns in China that negatively impacted demand for our business in 2022, and current industry supply constraints for memory chips, substrates and foundry capacity that may impact our customers’ abilities to assemble products incorporating our products.
Our pricing and margins vary across our products and market segments due in part to marketability of our products and differences in their features or manufacturing costs. For example, our core product offerings range from lower-priced and entry-level platforms to higher-end platforms. Our ancillary product offerings that extend beyond our core product lines typically have significantly lower margins than our higher-priced products, and at times are not profitable. Some of our higher-priced products, however, have lower margins as they are produced at external foundries rather than in our manufacturing facilities. To the extent demand shifts from our higher-margin to lower-margin products in any of our market segments, our gross margin percentage has decreased and may decrease again.
Macroeconomic conditions and geopolitical tensions and conflicts, including changes to trade policies and regulations, present significant risks to us in many jurisdictions.
We have manufacturing, assembly and test, R&D, sales and other operations in many countries, and some of our business activities are concentrated in one or more geographic areas. Our operations rely upon a supply chain that is also highly distributed, and with reliance in some instances on supplies or materials available in only one or more geographic areas. Moreover, sales outside the U.S. accounted for 70% of our revenue for the fiscal year ended December 27, 2025, with revenue from billings to China contributing 24% of our total revenue. As a result, our operations and our financial results, including our ability to execute our business strategy, manufacture, assemble and test, design, develop or sell products, and the demand for our products, are at times adversely affected by a number of global and regional factors outside of our control.
Adverse changes in global or regional economic conditions periodically occur, including as result of recession or slowing growth; changes or uncertainty in fiscal, monetary or trade policy; high interest rates; tighter credit; inflation; lower capital expenditures by businesses, including on IT infrastructure; increases in unemployment; and lower consumer confidence and spending. Adverse changes in macroeconomic conditions can significantly harm demand for our products and make it more challenging to forecast our operating results and make business decisions, including regarding prioritization of investments in our business. An economic downturn or increased uncertainty may also lead to: increased credit and collectability risks; higher borrowing costs or reduced availability of capital and credit markets; reduced liquidity; adverse impacts on our suppliers; failures of counterparties, including financial institutions and insurers; asset impairments; and declines in the value of our financial instruments.
Trade policies and disputes at times result in increased tariffs, trade barriers and other trade restrictions and protectionist measures, which can increase our manufacturing costs, make our products less competitive, reduce demand for our products, limit our ability to sell to certain customers, limit our ability to procure components or raw materials, or impede or slow the movement of our goods across borders. Increasing protectionism and economic nationalism may lead to further changes in trade policies and regulations, domestic sourcing initiatives, or other formal and informal measures that could make it more difficult to sell our products in, or restrict our access to, some markets. They can also result in declining consumer confidence and slowing economic growth or recession, and could cause our customers to reduce, cancel or alter the timing of their purchases with us. Sustained geopolitical tensions could lead to long-term changes in global trade and technology supply chains, domestic sourcing initiatives, and decoupling of global trade networks, which could make it more difficult to sell our products in, or restrict our access to, some markets and have a material adverse effect on our business and growth prospects.
Geopolitical and trade tensions between the U.S. and China, one of our largest markets, have led to increased tariffs and trade restrictions, including tariffs applicable to some of our products, and have affected customer ordering patterns. Further, the U.S. has imposed restrictions on the export of U.S.-regulated products and technology to certain Chinese technology companies, including certain of our customers, and China has responded with its own restrictions. More specifically, the period from 2022 through 2024 was characterized by escalating U.S. export controls and trade restrictions, including strengthened controls on semiconductor manufacturing equipment, AI and advanced computing products, as well as new caps on the global distribution of high-performance integrated circuits and additional limitations on critical minerals. The U.S., often in coordination with Japan and the Netherlands, imposed these restrictions while adding more Chinese firms to prohibited lists, and China responded with its own limitations on U.S. access to minerals and on companies supplying Taiwan's military. In 2025, the new U.S. administration further tightened export controls and trade measures, expanding the scope of restrictions, which has led to additional sales reductions and a greater need for specific government authorizations. It also resulted in China putting licensing requirements on critical minerals. These restrictions have in some instances reduced our sales and in a number of instances required specific governmental authorizations or exceptions. These and potential future restrictions, including also through application of antitrust laws and restrictions based on cybersecurity and other national security concerns, could adversely affect our financial performance and result in reputational harm to us. In addition, a number of semiconductor companies in China, including SMIC, are making significant investments, in many instances with the support of the Chinese government, in advanced semiconductor technologies to enable such companies to develop products and technologies that compete with ours. It is difficult to predict what further trade-related actions governments may take, the extent to which we may be able to mitigate the effects of any trade-related actions, and the longer-term implications of trade-related actions on the market opportunities for us and the competition we may face.
Geopolitical and security issues, such as armed conflict and civil or military unrest, political instability, human rights concerns and terrorist activity, present significant risks to our global operations. For example:
▪There have been significant hostilities in recent years affecting or in close proximity to Israel, where we have a leading-edge fabrication facility and multiple product development centers. This has included direct military actions between Israel and Iran, military strikes by the U.S. against Iran and hostilities in Gaza and Lebanon. Additional hostilities and escalations remain possible at any time. As a significant portion of our revenues are generated from products using our Intel 7 node that are manufactured at our fabrication facility in Israel and we are not insured for business interruptions resulting from war or political violence, a disruption of that facility could have a significant adverse impact on our business. Additionally, our property, plant and equipment assets in Israel are self-insured and could be impacted by the conflict. Further, our Mobileye business is headquartered and has most of its operations in Israel and could be similarly impacted;
▪Tensions between mainland China and Taiwan have increased significantly in recent years, presenting an elevated risk of hostilities. Many of our products depend on suppliers in Taiwan for critical components, including various compute die, that cannot be easily or quickly replaced. Other of our products are made entirely in Taiwan. As such, any disruption impacting Taiwan could significantly and adversely impact our ability to obtain critical components and supply our customers with products; and
▪Russia’s ongoing conflict with Ukraine has resulted in the imposition of financial and other sanctions and export controls against Russia and Belarus that has caused us and other companies to limit or suspend Russian operations (we had no exports to Russia in 2025, 2024 and 2023). The conflict has also resulted in Russia-imposed currency restrictions and regulations and other retaliatory trade and other actions, increased supply, commodity and other costs, and an increased risk of cyberattacks.
We can also be adversely affected by other global and regional factors that periodically occur, including:
▪severe weather events and natural disasters, public health issues (including pandemics) and other catastrophic events;
▪inefficient infrastructure and other disruptions, such as supply chain interruptions, materials shortages or delays and large-scale outages or unreliable provision of services from utilities, transportation, data hosting or telecommunications providers;
▪formal or informal imposition of new or revised export, import or doing-business regulations, including trade sanctions, tariffs and changes in the ability to obtain export licenses, which could be changed without notice;
▪government restrictions on, or nationalization of, our operations in any country, or restrictions on our ability to repatriate earnings from or distribute compensation or other funds in a particular country;
▪adverse changes relating to government grants, tax credits or other government incentives, including more favorable incentives provided to competitors;
▪differing employment practices and labor issues, including restricted access to talent;
▪ineffective legal protection of our IP rights in certain countries;
▪local business and cultural factors that differ from our current standards and practices;
▪continuing uncertainty regarding social, political, immigration and tax and trade policies in the U.S. and abroad; and
▪fluctuations in the market values of our domestic and international investments, and in the capital and credit markets, which can be negatively affected by liquidity, credit deterioration or losses, interest rate changes, financial results, political risk, sovereign risk or other factors.
We are subject to numerous risks associated with the evolving market for products with AI capabilities.
The markets and use cases for products with AI capabilities have been rapidly evolving, are difficult to predict, and may impact demand for our products. For example, in the last few years, the demand for high-end GPUs for model training increased dramatically and has resulted and may continue to result in a significant shift in data center customer spend. The investments we have made and expect to continue to make to develop products and software to address what we believe will be increasing demand for AI capabilities, most notably in AI PCs but also in the data center and in GPUs, may be insufficient, and we face significant hurdles, including whether demand will materialize, whether third-party developers will develop the software to utilize the AI capabilities of our products, and whether we will be successful in developing products that can compete with the more established offerings and ecosystems of our competitors. In addition, many of our competitors have substantially greater financial resources than us, are making substantially greater investments in AI than we are, including through internal development and through acquisitions and hiring and retention of talent, and are further along in their development of AI technologies than we are.
Our use of AI technology may subject us to reputational, financial, legal or regulatory risks. As we incorporate AI technology into our products and services, any failure to address concerns relating to the responsible use of the evolving AI technology in our products and services may cause harm to our reputation or financial liability and, as such, may increase our costs to address or mitigate such risks and issues. AI technology may create ethical issues, generate defective algorithms and present other risks that create challenges with respect to its adoption. In addition, evolving laws, rules, regulations and industry standards governing AI may require us to expend significant resources to modify, maintain or align our business practices or products. At the same time, to the extent we do not adopt AI technology in the operation of our business as effectively as our competitors, we may be competitively disadvantaged.
We rely upon a complex global supply chain.
We have a highly complex global supply chain composed of thousands of suppliers. These suppliers provide direct materials for our production processes; supply tools, equipment and IP (via licenses) for our factories; deliver logistics and packaging services; and supply software, lab and office equipment, and other goods and services used in our business. We also rely on suppliers to provide certain components for our products and to manufacture and assemble and test some of our components and products. From time to time, we are negatively impacted by supply chain issues, including:
▪suppliers extending lead times, experiencing capacity constraints, limiting or canceling supply, allocating supply to other customers including competitors, delaying or canceling deliveries or increasing prices (for example, we are currently being impacted by industry supply constraints for memory chips, substrates and foundry capacity);
▪supplier quality issues;
▪cybersecurity events, IP or other litigation, man-made or natural disasters, public health issues (including pandemics), operational failures or other events that disrupt suppliers;
▪long lead times to qualify alternate or additional suppliers, or the unavailability of qualified alternate suppliers; and
▪increased legislation, regulation or stakeholder expectations regarding sourcing, including with respect to national security, human rights and environmental impact concerns.
These and other supply chain issues can increase our costs, disrupt or reduce our production, delay our product shipments, prevent us from meeting customer demand, damage our customer relationships or negatively affect our reputation. They may keep us from successfully implementing our business strategy and can materially harm our business, competitive position, results of operations and financial condition. From time to time, our customers experience disruptions or shortages in their own supply chains that constrain their demand for our products. During the past several years, macroeconomic and geopolitical conditions, as well as outbreaks of COVID-19, caused supply chain disruptions and delays in obtaining tools and other components, and the semiconductor industry experienced widespread shortages of substrates and other components and available foundry manufacturing capacity. These shortages have previously limited our ability to supply customer demand in certain of our businesses, and have adversely affected customer demand for our products, as some customers have been unable to procure sufficient quantities of third-party components used together with our products to produce finished systems. It is difficult to predict the future impact of these shortages when they occur.
To obtain future supply of certain materials and components, particularly substrates, and third-party foundry manufacturing capacity, we have entered into arrangements with some of our suppliers that involve long-term purchase commitments and/or large prepayments. These arrangements may not be adequate to meet our requirements, or our suppliers may fail to deliver committed volumes on time or at all, or their financial condition may deteriorate. If future customer demand over the horizon of such arrangements falls below our expectations, we could have excess or obsolete inventory, unneeded capacity and increased costs, and our prepayments may not be fully utilized, and in some cases may not be fully recoverable.
We utilize third-party foundries and component suppliers to manufacture or supply a number of our products and components necessary for our products that we manufacture. As part of our strategy, we expect to continue to rely upon third-party foundries. Delays in the development of foundries' future manufacturing processes could delay the introduction of products or components we design for such processes, and insufficient foundry capacity could prevent us from meeting customer demand. We typically have less control over delivery schedules, design and manufacturing co-optimization, yields, quality, product quantities and costs for components and products that are manufactured by third parties.
For certain products, components, services, materials and equipment, we rely on a single or a limited number of suppliers, or upon suppliers in a single location, which can impact the nature, quality, availability and pricing of the products and services available to us. For example, ASML Holding N.V. (ASML) is currently the sole supplier of EUV lithography tools that we are deploying in our Intel 4, Intel 3, Intel 18A and planned future leading-edge manufacturing process nodes. These tools are highly complex to develop and produce, and increasingly costly, and from time to time there are increases in lead times or delays in their development and availability, which could delay the development or ramp of our future process nodes. As a further example, a limited number of third-party foundries offer leading-edge manufacturing processes, and these providers are geographically concentrated in Asia. Some of our most advanced current and future products are or will be either exclusively manufactured by TSMC or reliant upon critical components, including various compute die, manufactured by TSMC.
We are subject to the risks of product defects, errata or other product issues.
From time to time, we identify product defects, errata and other product issues, which can result from problems in our product design or our manufacturing and assembly and test processes. Components and products we purchase or license from third-party suppliers, or gain through acquisitions, can also contain defects. Product issues also sometimes result from the interaction between our products and third-party products and software. We face risks if products that we design, manufacture, or sell, or that include our technology, cause personal injury or property damage, even where the cause is unrelated to product defects or errata. These risks may increase as our products are introduced into new devices, market segments, technologies, or applications, including transportation, autonomous driving, healthcare, communications, financial services and other industrial, critical infrastructure and consumer uses.
Costs from defects, errata or other product issues could include:
▪writing off some or all of the value of inventory;
▪recalling products that have been shipped;
▪providing product replacements or modifications;
▪providing consideration to customers, including reimbursement for certain costs they incur;
▪defending against litigation and/or paying resulting damages;
▪paying fines imposed by regulatory agencies; and
▪reputational harm.
These costs could be large and may increase expenses and lower gross margin, and/or result in delay or loss of revenue. Mitigation techniques designed to address product issues, including software and firmware updates, are not always available on a timely basis—or at all—and do not always operate as intended or effectively resolve such issues for all applications. We and third parties, such as hardware and software vendors, make prioritization decisions about which product issues to address, which can delay, limit or prevent development or deployment of a mitigation and harm our reputation and result in costs. Product defects, errata or other product issues and/or mitigation techniques can result in product failures, adverse performance and power effects, reboots, system instability or unavailability, loss of functionality, data loss or corruption, unpredictable system behavior, decisions by customers and end users to limit or change the applications in which they use our products or product features and other issues. For example, during 2024, some of our customers experienced instability issues when using Intel Core 13th and 14th Gen desktop processors, which required us to undertake an investigation and deploy corrective actions. This adversely impacted sales volume during 2024 and may result in higher warranty costs in the future.
Product issues can damage our reputation, negatively affect product demand, delay product releases or deployment, result in legal liability, or make our products less competitive, which could harm our business and financial results. Subsequent events or new information can develop that change our assessment of the impact of a product issue. In addition, our liability insurance coverage has certain exclusions or may not adequately cover liabilities incurred. Our insurance providers may be unable or unwilling to pay a claim, and losses not covered by insurance could be large, which could harm our financial condition.
We face risks related to security vulnerabilities in our products.
We or third parties regularly identify security vulnerabilities with respect to our processors and other products, as well as the operating systems and workloads that run on them and the components that interact with them. Components and IP we purchase or license from third parties for use in our products, as well as industry-standard specifications we implement in our products, are also regularly subject to security vulnerabilities. Our processors and other products are being used in application areas that create new or increased cybersecurity and privacy risks, including applications that gather and process large amounts of data, such as the cloud or Internet of Things, and critical infrastructure and automotive applications. The security vulnerabilities identified in our processors include a category known as side-channel vulnerabilities, such as the variants referred to as "Spectre" and "Meltdown." Additional categories and variants have been identified and are expected to continue to be identified. Security and manageability features in our products cannot make our products absolutely secure, and these features themselves are subject to vulnerabilities and attempts by third parties to identify additional vulnerabilities. We, our customers, and the users of our products do not always promptly learn of or have the ability to fully assess the magnitude or effects of a vulnerability, including the extent, if any, to which a vulnerability has been exploited. Subsequent events or new information can develop that changes our assessment of the impact of a security vulnerability, including additional information learned as we develop and deploy mitigations or updates, become aware of additional variants, evaluate the competitiveness of existing and new products and address future warranty or other claims or customer satisfaction considerations, as well as developments in the course of any litigation or regulatory inquiries or actions over these matters.
Mitigation techniques designed to address security vulnerabilities in our products, including software and firmware updates or other preventative measures, are not always available on a timely basis—or at all—and at times do not operate as intended or effectively resolve vulnerabilities for all applications. In addition, we are often required to rely on third parties, including hardware, software and services vendors, as well as our customers and end users, to develop and/or deploy mitigation techniques, and the availability, effectiveness and performance impact of mitigation techniques can depend solely or in part on the actions of these third parties in determining whether, when, and how to develop and deploy mitigations. Export restrictions may impede our ability to provide updates or patches to customers in certain geographies or that appear on sanctions lists, potentially leaving systems unpatched and open to exploitation. Further, sanctions lists may include third parties with whom we need to interact for coordinated vulnerability disclosure, which may impair our ability to receive information about vulnerabilities and to deliver mitigations for them. We and such third parties make prioritization decisions about which vulnerabilities to address, which can delay, limit or prevent development or deployment of a mitigation and harm our reputation. Security vulnerabilities and/or mitigation techniques can result in adverse performance or power effects, reboots, system instability or unavailability, loss of functionality, data loss or corruption, unpredictable system behavior, decisions by customers and end users to limit or change the applications in which they use our products or product features and/or the misappropriation of data by third parties.
Security vulnerabilities and any limitations or adverse effects of mitigation techniques can adversely affect our results of operations, financial condition, customer relationships, prospects and reputation in a number of ways, any of which may be material. For example, whether or not vulnerabilities involve attempted or successful exploits, they may result in our incurring significant costs related to developing and deploying updates and mitigations, writing down inventory value, defending against product claims and litigation, responding to regulatory inquiries or actions, paying damages, addressing customer satisfaction considerations, providing product replacements or modifications or taking other remedial steps with respect to third parties. Adverse publicity about security vulnerabilities or mitigations could damage our reputation with customers or users and reduce demand for our products and services. These effects may be greater to the extent that competing products are not susceptible to the same vulnerabilities or if vulnerabilities can be more effectively mitigated in competing products. Moreover, third parties can release information regarding potential vulnerabilities of our products before mitigations are available, which, in turn, could lead to attempted or successful exploits, adversely affect our ability to introduce mitigations, or otherwise harm our business and reputation.
We are subject to increasing and evolving cybersecurity threats and privacy risks.
We face significant and persistent cybersecurity risks due to: the breadth and complexity of our global operations and systems; the technical sophistication, value, and widespread use of our systems, products and processes and their attractiveness to threat actors (including state-sponsored organizations) seeking to inflict harm on us or our customers, and supply chain risk through our use of third-party products, services and components. We also face additional risk with our foundry business where we expect to collect significant amounts of highly sensitive customer data, which may make us a target in an attempt to steal or corrupt such data. A cybersecurity incident, whether or not successful, could result in our incurring significant costs related to, for example, rebuilding our internal systems, writing down inventory value, implementing additional threat protection measures, providing modifications to our products and services, defending against litigation or enforcement proceedings, paying damages, providing customers with incentives to maintain a business relationship with us, or taking other remedial steps with respect to third parties, as well as incurring significant reputational harm.
We regularly face attempts by malicious attackers to, among other things: gain unauthorized access to our network or data centers or those of our suppliers, customers and partners; steal proprietary, personal or confidential information; sabotage or corrupt our systems or processes to design and manufacture hardware and associated software and services; interrupt operations; or demand ransom. Threats include malicious hackers, state-sponsored organizations, insider threats, including employees and third-party service providers and unauthorized physical facility access. In addition, service providers we use can experience breaches of their systems and products, or provide inadequate updates or support, which can impact the security of our systems and our proprietary or confidential information.
Cyber attack attempts are increasing in number, magnitude and technical sophistication, and if successful, may expose us and the affected parties to loss or misuse of proprietary or confidential information or disruptions to our supply chain or business operations, including our manufacturing operations, and could impact our financial results. We expect emerging technologies to contribute to the increasing sophistication of attacks and to lead to new threats. For example, threat actors are leveraging emerging AI technologies to develop new hacking tools and attack vectors, exploit vulnerabilities, obscure their activities and increase the difficulty of threat attribution. The proliferation of generative AI increases the risk of these technologies being used by threat actors to impersonate authorized individuals, which may make attacks even more difficult to detect and prevent. Moreover, the increased adoption of generative AI models within our internal systems, processes and tools may create new attack methods for threat actors.
We are required to comply with stringent, complex and evolving laws, rules, regulations and standards in many jurisdictions, as well as contractual obligations, relating to cybersecurity, data protection and privacy. Any failure or perceived failure by us to so comply, or any compromise of security that results in unauthorized access to, or unauthorized loss, destruction, use, modification, acquisition, disclosure, release or transfer of personal data, may result in our having to modify or cease certain operations or practices; the expenditure of substantial costs, time and other resources; legal proceedings or actions against us (including class action lawsuits); or governmental investigations or fines.
We are subject to IP risks, including related litigation and regulatory proceedings.
We cannot always protect our IP or enforce our IP rights. We regard our patents, copyrights, trade secrets and other IP rights as important to the success of our business. We rely on IP law—as well as confidentiality and licensing agreements with our customers, employees, technology development partners and others—to protect our IP and IP rights. Our ability to enforce these rights is subject to general litigation risks, as well as uncertainty as to the enforceability of our IP rights in various countries and other geopolitical factors. We are not always able to obtain protection for our IP or enforce or protect our IP rights. When we seek to enforce our rights, we may be subject to claims that our IP rights are invalid, not enforceable or licensed to an opposing party. Our assertion of IP rights may result in another party seeking to assert claims against us, which could harm our business. From time to time, governments adopt regulations and governments or courts render decisions requiring compulsory licensing of IP rights, or governments require products to meet standards that favor local companies. Our inability to enforce our IP rights under any of these circumstances can harm our competitive position and business. In some cases, our IP rights can offer inadequate protection for our innovations. In addition, the theft or unauthorized use or publication of our trade secrets and other confidential business information could harm our competitive position and reduce acceptance of our products; as a result, the value of our investment in R&D, product development and marketing could be reduced.
Our licenses with other companies and participation in industry initiatives at times allow competitors to use some of our patent rights. Technology companies often bilaterally license patents between each other to settle disputes or as part of business agreements. Some of our competitors have in the past had, and may in the future have, licenses to some of our patents, and under current case law, some of the licenses can exhaust our patent rights as to licensed product sales under some circumstances. Our participation in industry standards organizations or with other industry initiatives at times requires us to offer to license our patents to companies that adopt industry-standard specifications. Depending on the rules of the organization, government regulations, or court decisions, we sometimes have to grant licenses to some of our patents for little or no cost, and as a result, we may be unable to enforce certain patents against others, and the value of our IP rights may be impaired.
Third parties assert claims based on IP rights against us and our products, which could harm our business. We face claims based on IP rights from individuals, companies, investment litigation entities, other non-practicing entities, academic and research institutions and other parties. We have seen an increase in patent assertions and lawsuits initiated by well-funded non-practicing entities, including entities funded by third-party investment firms. These lawsuits can increase our cost of doing business, impact our reputation or relationship with customers and disrupt our operations if they succeed in blocking the trade of our products. The patent litigation environment has also become more challenging due to the emergence of venues adopting procedural and substantive rules that make them more favorable for patent asserters and courts in which injunctions are available for non-competitors. For example, in February 2024, R2 Semiconductor, Inc., a non-practicing entity, was able to obtain an injunction and recall order against us and our customers in the Dusseldorf Regional Court in Germany that, if enforced, could have caused significant potential disruption to our and our customers’ businesses in Europe. In the past few years, we have faced costly and lengthy lawsuits across multiple jurisdictions selected by non-practicing entities with well-funded third-party investment support, including most notably the VLSI and R2 litigation, which have resulted in significant adverse judgments and settlements.
We are typically engaged in a number of disputes involving IP rights. Claims that our products, technologies or processes infringe the IP rights of others, regardless of their merits, cause us to incur large costs to respond to, defend and resolve the claims, and they divert the efforts and attention of our management and technical personnel from our business and operations. In addition, we may face claims based on the alleged theft or unauthorized use or disclosure of third-party trade secrets, confidential information or end-user data that we obtain in conducting our business. Any such incidents and claims could severely disrupt our business, and we could suffer losses, including the cost of product recalls and returns and reputational harm. Furthermore, in many instances, we agree to indemnify customers for certain IP rights claims against them. IP rights claims against our customers could also limit demand for our products or disrupt our customers' businesses, which could in turn adversely affect our results of operations.
As a result of IP rights claims, we could:
▪pay monetary damages, payments to satisfy indemnification obligations, royalties, fines, penalties or provide accommodations to customers such as through cash payments or discounts;
▪stop manufacturing, using, selling, offering to sell or importing products or technology subject to claims;
▪need to develop other products or technology not subject to claims, which could be time-consuming or costly; or
▪enter into settlement or license agreements, which may not be available on commercially reasonable terms and may be costly.
These IP rights claims could harm our competitive position, result in expenses, or require us to impair our assets. If we alter or stop production of affected items, our revenue could be harmed.
We rely on access to third-party IP, which may not be available to us on commercially reasonable terms, if at all. Many of our products are designed to include third-party technology or implement industry standards, which may require licenses from third parties. In addition, from time to time, third parties notify us that they believe we are using their IP. There is no assurance that any necessary licenses or our existing licenses to such third-party IP can be obtained or are available on commercially reasonable terms or at all. Failure to obtain the right to use third-party technology, or to license IP on commercially reasonable terms, could preclude us from selling certain products or otherwise have a material adverse impact on our financial condition and operating results. To the extent our products include software that contains or is derived from open-source software, we may be required to make the software's source code publicly available and/or license the software under open-source licensing terms.
We are subject to risks associated with litigation and regulatory matters. From time to time, we face legal claims or regulatory matters involving stockholder, consumer, competition, commercial, IP, labor and employment, compliance and other issues. As described in "Note 19: Commitments and Contingencies" within Notes to Consolidated Financial Statements, we are engaged in a number of litigation and regulatory matters. Litigation and regulatory proceedings are inherently uncertain, and adverse rulings, excessive verdicts, or other events have occurred and could occur again, including monetary damages, fines, penalties or injunctions stopping us from manufacturing or selling certain products, engaging in certain business practices, or requiring other remedies, such as compulsory licensing of patents. An unfavorable outcome can result in a material adverse impact on our business, financial condition and results of operations. Regardless of the outcome, litigation and regulatory proceedings can be costly, time-consuming, disruptive to our operations, harmful to our reputation and distracting to management.
We must attract, retain and motivate key talent.
We believe that hiring and retaining qualified executives, scientists, engineers, technical talent, sales representatives and other professionals is critical to our business. The competition for highly skilled employees in our industry is intense, with the demand often exceeding supply. Competitors for technical talent often seek to hire our employees, and the availability of flexible, hybrid or work-from-home arrangements has both intensified and expanded competition. In addition, changes in immigration policies may further limit the pool of available talent and impair our ability to recruit and hire technical and professional talent. Further, we have undertaken substantial headcount reductions in 2025, 2024 and 2022 and may be required to make additional reductions in the future. Such factors and developments have in the past and may in the future be disruptive, adversely impact employee morale, compromise our ability to deliver on our strategy and workforce goals (including as a result of the loss of historical, technical or other expertise) and impact our ability to recruit. To help attract, retain and motivate qualified employees, we use share-based awards, such as RSUs, and performance-based cash incentive awards. Sustained declines in our stock price or lower stock price performance relative to our competitors in recent years have reduced the retention value of our share-based awards, which has impacted the competitiveness of our compensation. To the extent our compensation programs and workplace culture are not viewed as competitive, or changes in our workforce and related restructuring, reduction-in-force, or other initiatives are not viewed favorably, our ability to attract, retain and motivate employees can be weakened, which could harm our results of operations.
Changes in our management team, especially those that are unplanned and occur abruptly, can also disrupt our business and adversely affect our results of operations given the long development cycle for semiconductor process technologies and products and the large capital investments over a long time period required for semiconductor manufacturing operations. We have had a number of changes in our senior leadership team in recent years, including CEO transitions in 2025, 2024, 2021 and 2019 and numerous changes in other senior management positions, a number of which were unplanned. To the extent we do not effectively hire, onboard, retain and motivate key employees and leadership, our business may be harmed.
We are subject to risks associated with our strategic transactions and investments.
We routinely evaluate opportunities and enter into agreements for possible acquisitions, divestitures and other strategic transactions. These transactions involve numerous risks, including:
▪failure of the transaction to advance our business strategy and failure of its anticipated benefits to materialize;
▪disruption of our ongoing operations and diversion of our management's attention;
▪our inability to retain key personnel of acquired or majority-owned businesses or our difficulty in integrating or separating employees, business systems and technology or otherwise operating the acquired or majority-owned business, including in areas such as AI where there is a high demand for talent;
▪our failure to realize a satisfactory return on our investment, potentially resulting in an impairment of goodwill and other assets, such as the $2.8 billion charge we recorded in the third quarter of 2024 primarily related to Mobileye goodwill;
▪controls, processes and procedures of acquired or majority-owned businesses that do not adequately ensure compliance with laws and regulations and create complexity and inconsistency in application of controls, processes and procedures and our failure to identify and/or address compliance issues, including accounting or tax errors or liabilities;
▪our failure to identify, or our underestimation of, commitments, liabilities, accounting, tax and other risks associated with acquired businesses or assets, majority-owned businesses or novel transactions; and
▪the potential for our transactions to result in dilutive issuances of our equity securities or significant additional debt.
Any of these risks could have a material adverse effect on our business, results of operations, financial condition, or cash flows, particularly in the case of a large acquisition, divestiture or partial divestiture, or several concurrent strategic transactions. Moreover, our resources are limited and our decision to pursue a transaction has opportunity costs; accordingly, if we pursue a particular transaction, we at times need to forgo the prospect of entering into other transactions or otherwise investing our resources in a manner that could help us achieve our financial or strategic objectives.
We are subject to sales-related risks.
We face risks related to sales through distributors and other third parties. We sell a significant portion of our products through third parties, such as distributors, value-added resellers and channel partners (collectively referred to as distributors), as well as OEMs and ODMs. We depend on many distributors to help us create end-customer demand, provide technical support and other value-added services to customers, fill customer orders and stock our products. At times, we rely on one or more key distributors for a product, and a material change in our relationship with one or more of these distributors or their failure to perform as expected could reduce our revenue. Our ability to add or replace distributors for some of our products is limited. In addition, our distributors' expertise in the determination and stocking of acceptable inventory levels for some of our products is not always easily transferable to a new distributor; as a result, end customers may be hesitant to accept the addition or replacement of a distributor. Using third parties for distribution exposes us to many risks, including competitive pressure and concentration, credit and compliance risks. Distributors and other third parties often sell products that compete with our products, and we sometimes need to provide financial and other incentives to focus them on the sale of our products. From time to time, they may face financial difficulties, including bankruptcy, which could harm our collection of accounts receivable and financial results. Further, any violations of the Foreign Corrupt Practices Act or similar laws by distributors or other third-party intermediaries could have a material impact on our business, including subjecting us to litigation or regulatory risk. In addition, to the extent we are not able to keep our products away from the “gray market,” demand and pricing dynamics can become distorted in our distribution channel and certain geographies, adversely affecting our revenue. Failure to manage risks related to our use of distributors and other third parties may reduce sales, increase expenses and weaken our competitive position.
We receive a significant portion of our revenue from a limited number of customers. Collectively, our three largest customers accounted for 43% of our net revenue in 2025, 45% of our net revenue in 2024 and 40% of our net revenue in 2023. We expect a small number of customers will continue to account for a significant portion of our revenue in the foreseeable future. The loss of key customers, a substantial reduction in sales to them, or changes in the timing of their orders can lead to a reduction in our revenue, increase the volatility of our results and harm our results of operations and financial condition.
Industry trends, such as the increase in AI workloads and shift of data center workloads to the public cloud, have increased the significance and purchasing power of certain customers, particularly hyperscalers, in some of our data center-focused businesses. Our competitive position can be eroded, as it has been in the last few years, to the extent we are not effective in addressing the particular needs of these customers in this rapidly evolving and increasingly competitive environment.
We face risks related to our debt obligations.
We have incurred significant debt obligations that could adversely affect our business and financial condition, including our ability to fully implement our strategy. As of December 27, 2025, we had $47.2 billion in aggregate principal amount of senior unsecured notes and other borrowings outstanding. In addition, we have a commercial paper program of up to $10.0 billion and credit facilities to backstop these programs and otherwise provide access to committed capital of up to $12.0 billion. As we continue to pursue our strategy, we may incur additional indebtedness, refinance our existing debt and issue additional notes or other debt securities in the future at a variety of interest rates, maturities and terms. The semiconductor industry is a cyclical business and our revenue, cash flows and outlook often fluctuate in accordance with this cycle, as well as prevailing macroeconomic and geopolitical conditions, our business strategy, and other risks described in these risk factors. These fluctuations, together with our debt level and related debt service obligations, could have the effect of, among other things, reducing our flexibility to respond to changing business and economic conditions and increasing the risk of a future downgrade in our credit ratings that can impact the value of our outstanding debt and increase our borrowing costs. During 2025 and in prior years, we suffered multiple credit rating downgrades that adversely impacted our borrowing costs and access to capital, and we may continue to suffer additional such downgrades if our business and financial results do not measurably improve. We may also be required to raise additional financing for working capital, capital expenditures, debt service obligations, debt refinancing, future acquisitions, or other general corporate purposes, which will depend on, among other factors, our financial position and performance, as well as prevailing market conditions and other factors beyond our control. Consequently, we may not be able to obtain additional financing or refinancing on terms acceptable to us, or at all, which could adversely impact our ability to finance our business strategy and service and repay outstanding indebtedness as it becomes due, all of which could adversely impact our business, financial condition and the cost of borrowing.
Laws and regulations can have a negative impact on our business.
We are subject to complex and evolving laws and regulations worldwide that differ among jurisdictions and affect our operations in areas including, but not limited to: IP ownership and infringement; tax; import and export requirements; anti-corruption; foreign exchange controls and cash repatriation restrictions; data privacy and localization requirements; competition; advertising; employment and labor; product regulations; environment, health and safety requirements; and consumer laws. Compliance with such requirements can be onerous and expensive and may otherwise impact our business operations negatively. Expanding privacy legislation and compliance costs of privacy-related and data-protection measures could adversely affect our customers and their products and services, particularly in cloud, Internet of Things and AI applications, which could in turn reduce demand for our products used for those workloads. Our policies, controls and procedures designed to help provide for compliance with applicable laws cannot provide assurance that our employees, contractors, suppliers or agents will not violate such laws or our policies. Violations of these laws and regulations can result in fines; criminal sanctions against us, our officers or our employees; prohibitions on the conduct of our business; and damage to our reputation.
Catastrophic events can have a material adverse effect on our operations and financial results.
Our operations and business, and those of our customers and suppliers, can be disrupted by: severe weather events and natural disasters; industrial accidents; public health issues and global pandemics such as COVID-19; cybersecurity incidents; interruptions of service from utilities, transportation restrictions or disruptions, telecommunications or IT systems providers; manufacturing equipment failures; geopolitical conflict; terrorism; or other catastrophic events. For example, we have at times experienced disruptions in our manufacturing processes as a result of power outages, improperly functioning equipment and disruptions in supply of raw materials or components, including cybersecurity incidents affecting our suppliers. Our headquarters and many of our operations and facilities are in locations that are prone to earthquakes and other natural disasters. Global climate change can result in certain natural disasters occurring more frequently or with greater intensity, such as drought, wildfires, storms, sea-level rise and flooding, and could disrupt the availability of water necessary for the operation of our fabrication facilities, including our facilities located in water-sensitive regions such as Arizona and Israel.
We are affected by fluctuations in currency exchange rates.
We are exposed to adverse as well as beneficial movements in currency exchange rates. Although most of our sales occur in U.S. dollars, operating expenses and capital expenditures may be paid in local currencies. An increase in the value of the dollar can increase the real cost to our customers of our products in those markets outside the U.S. where we sell in dollars, and a weakened dollar can increase the cost of expenses such as payroll, utilities, tax and marketing expenses, as well as non-U.S. dollar capital expenditures. We also conduct certain investing and financing activities in local currencies. Our hedging programs may not be effective to offset any, or more than a portion, of the adverse impact of currency exchange rate movements; therefore, changes in exchange rates can harm our results of operations and financial condition.
Changes in our effective tax rate may impact our net income.
A number of factors can impact our future effective tax rate or cash payments, which could cause significant variability in our financial results, including:
▪changes in the volume and mix of profits earned and location of assets across jurisdictions with varying tax rates;
▪changes in our business or legal entity operating model;
▪the resolution of issues arising from tax audits, including payment of interest and penalties;
▪changes in the valuation of our deferred tax assets and liabilities, and in deferred tax valuation allowances;
▪adjustments to estimated taxes upon finalization of tax returns;
▪increases in expenses not deductible for tax purposes, including impairments of goodwill;
▪changes in available tax credits, including non-U.S. tax credits, R&D credits and refundable tax credits;
▪expirations or changes in our ability to secure new tax holidays and incentives;
▪changes in U.S. federal, state or foreign tax laws or their interpretation, including the global implementation of a minimum tax under Pillar Two of the OECD BEPS initiative;
▪changes in U.S. GAAP and non-U.S. IFRS; and
▪our decision to repatriate non-U.S. earnings for which we have not previously provided for incremental taxes, including any local country withholding taxes incurred upon repatriation.
We are subject to risks associated with environmental, health, safety and product regulations.
The design, manufacturing, assembly and test of our products require the use and purchase of materials and chemicals that are subject to a broad array of environmental, health and safety laws and regulations. Our operations and those of our suppliers are further governed by laws and regulations governing the use, transportation, emissions, discharge, storage, recycling or disposal of hazardous materials, prohibiting the use of forced labor (e.g., mining conflict minerals), and placing restrictions on other materials, as well as laws or regulations governing the operation of our facilities, sale and distribution of our products and use of our real property. The scope and interpretation of such laws and regulations, including the materials they govern, are complex and continue to evolve. The procedures and processes in place under our compliance program may become onerous or increasingly expensive to maintain and cannot guarantee compliance by employees or third parties to whom such laws apply. The amendment or expansion of these laws or regulations, as well as the failure or inability of us or our suppliers to comply with them (including as a result of acquired entities), can result in regulatory penalties, fines and legal liabilities; increased costs; additional remediation obligations; suspension of production; alteration, suspension or termination of our manufacturing and assembly and test processes, including due to an inability to find, afford or attain adequate substitute materials, equipment or processes; damage to our reputation; and restrictions on our operations or sales.
For example, environmental regulations, including with respect to the materials and processes we are permitted to use and as to air quality and wastewater requirements, may impede our ability to manufacture products or expand or modify our manufacturing capability in the future. Environmental laws and regulations sometimes require us to acquire additional pollution abatement or remediation equipment, modify product designs, cease the use of a particular material or process, remove or remediate hazardous substances or incur other expenses or liabilities. Semiconductor manufacturing uses perfluorocarbons, which have historically made up a large portion of our direct greenhouse gas emissions. New or increased regulations limiting the use of such compounds, or other greenhouse gas emissions, could require us to install additional abatement equipment, purchase carbon offsets and/or alter, where feasible, our production processes and sources. New or more stringent climate change regulations could increase our manufacturing costs associated with meeting air pollution requirements and our energy costs, for example as a result of carbon pricing impacts on electrical utilities. In addition, regulations in response to human health concerns may also limit or prohibit the use of a class of chemicals known as per- and polyfluoroalkyl substances (PFAS), which are found in parts, components, process chemicals and other materials used in semiconductor manufacturing. Such chemicals are critical to the manufacturing and functioning of many semiconductor products and there are limited technically and commercially feasible alternatives. As we expand our manufacturing capacity, the impacts of future laws and regulation could be magnified. Many new materials that we are evaluating for use in our operations are also subject to regulation under environmental laws. These restrictions could harm our business and results of operations by increasing our expenses or requiring us to alter manufacturing and assembly and test processes.
Information About Our Executive Officers
| | | | | | | | | | | | | | |
Name Current Title | | Age | | Experience |
| | | | |
Lip-Bu Tan | | 66 | | Lip-Bu Tan has been our Chief Executive Officer since March 2025 and serves on the company’s Board of Directors. Mr. Tan previously served as Chief Executive Officer of Cadence Design Systems, a computational software company, from 2009 to December 2021, and as Executive Board Chair at Cadence from December 2021 to May 2023. Mr. Tan was previously a director of Intel from September 2022 until August 2024. Mr. Tan is the chairman of Walden International, an international venture capital firm he founded in 1987, and the founding managing partner of two other funds, Celesta Capital and Walden Catalyst Ventures. He is on the board of directors of Schneider Electric SE, a digital automation and energy management company. Mr. Tan holds a Bachelor of Science in Physics from Nanyang Technological University in Singapore, a Master of Science in Nuclear Engineering from the Massachusetts Institute of Technology and a Master of Business Administration from the University of San Francisco. |
Chief Executive Officer | | | |
| | | |
| | | |
| | | | |
| Nagasubramaniyan Chandrasekaran | | 51 | | Naga Chandrasekaran has been our Executive Vice President, Chief Technology and Operations Officer, and General Manager of Intel Foundry since September 2025. Mr. Chandrasekaran oversees technology development, manufacturing, customer engagement, and ecosystem operations for silicon, packaging, and test technologies. Before that he served as our Chief Technology and Operations Officer and Executive Vice President of Intel’s Foundry Technology and Manufacturing after originally joining Intel in August 2024 as the Executive Vice President of Foundry Manufacturing & Supply Chain. Prior to joining Intel, he worked at Micron Technology, Inc., a semiconductor manufacturing company, for 23 years, from October 2008 to August 2024, where he held several senior leadership positions, most recently as the Senior Vice President of Technology Development. He earned a Bachelor’s Engineering Degree in Mechanical Engineering from the University of Madras; a Master of Science Degree and a Doctorate in Mechanical Engineering from Oklahoma State University; a Master’s of Information and Data Science from the University of California, Berkeley; and dual executive Master of Business Administration degrees from the University of California, Los Angeles, and the National University of Singapore. Mr. Chandrasekaran is a member of the Board of Directors of Mobileye Global, Inc. |
| Executive Vice President and Chief Technology and Operations Officer, General Manager of Intel Foundry | | | |
| | | |
| | | |
| | | | |
| April Miller Boise | | 57 | | Ms. Miller Boise has been our Executive Vice President and Chief Legal Officer since July 2022 and Corporate Secretary since August 2022. Ms. Miller Boise leads the corporate affairs, policy, integrity, trade and legal functions, is a member of Intel's Executive Team, and is a key strategic partner to Intel's Board of Directors. Prior to joining Intel, Ms. Miller Boise was Executive Vice President and Chief Legal Officer at Eaton Corp., an intelligent power management company, from January 2020 to July 2022. Before joining Eaton in 2020, she was Senior Vice President, Chief Legal Officer, and Corporate Secretary at Meritor Inc., a manufacturer of powertrain solutions for commercial vehicles, later acquired by Cummins Inc. Ms. Miller Boise has more than 30 years of experience and has served in executive leadership roles at companies in various industries including semiconductors, aerospace, power management, automotive, climate control, financial services, and oil and gas. She serves on the Board of Directors of Trane Technologies, plc. Ms. Miller Boise holds a Juris Doctor from the University of Chicago Law School and a Bachelor of Business Administration from the University of Michigan. |
Executive Vice President and Chief Legal Officer | | | |
| | | |
| | | |
| | | | |
| David Zinsner | | 57 | | David Zinsner has been our Executive Vice President and Chief Financial Officer (CFO) since January 2022. In this capacity, Mr. Zinsner leads Intel’s global finance organization, overseeing finance, accounting and reporting, tax, treasury, internal audit, and investor relations. His responsibilities also encompass Real Estate and Workplace Services and Corporate Development. Mr. Zinsner was previously executive vice president and CFO at Micron Technology, Inc., where he served on the executive leadership team and directed the global finance organization from 2018 to 2022. With three decades of financial and operational experience in semiconductors, manufacturing, and the technology industry, Mr. Zinsner has held several senior leadership roles. His prior positions include president and chief operating officer of Affirmed Networks, senior vice president of finance and CFO at Analog Devices, and senior vice president and CFO at Intersil Corporation. In addition to his work with Intel, Mr. Zinsner serves on the boards of Albertsons Companies Inc., Mobileye Global Inc., and Altera Corporation. Previously, he served on the board of Credo Semiconductor for over five years, including the company’s initial public offering. Mr. Zinsner holds a Master of Business Administration in Finance and Accounting from Vanderbilt University, as well as a Bachelor of Science in Industrial Management from Carnegie Mellon University. |
| Executive Vice President and Chief Financial Officer | | | |
| | | |
| | | |
| | | | |
Market for Our Common Stock
The principal U.S. market on which our common stock (symbol INTC) is traded is the Nasdaq Global Select Market.
As of January 16, 2026, there were approximately 87,000 registered holders of record of our common stock. A substantially greater number of holders of our common stock are "street name" or beneficial holders, whose shares of record are held by banks, brokers and other financial institutions.
Stock Performance Graph
The graph and table that follow compare the cumulative TSR of our common stock with the cumulative total return of the S&P 100 Index, the S&P 500 Index, the S&P 500 IT Index and the SOX Index1 for the five years ended December 27, 2025. The cumulative returns shown on the graph are based on Intel's fiscal year.
Comparison of Five-Year Cumulative Return for
Intel, S&P 100 Index, S&P 500 Index, S&P 500 IT Index and SOX Index
| | | | | | | | | | | | | | | | | | | | | | | | | | | | | | | | | | | | | | |
| Years Ended | | Dec 26, 2020 | | Dec 25, 2021 | | Dec 31, 2022 | | Dec 30, 2023 | | Dec 28, 2024 | | Dec 27, 2025 |
| Intel Corporation | | $ | 100 | | | $ | 112 | | | $ | 60 | | | $ | 116 | | | $ | 48 | | | $ | 85 | |
| | | | | | | | | | | | |
| S&P 100 Index | | $ | 100 | | | $ | 131 | | | $ | 104 | | | $ | 138 | | | $ | 184 | | | $ | 220 | |
| S&P 500 Index | | $ | 100 | | | $ | 129 | | | $ | 107 | | | $ | 135 | | | $ | 171 | | | $ | 201 | |
| S&P 500 IT Index | | $ | 100 | | | $ | 135 | | | $ | 97 | | | $ | 154 | | | $ | 215 | | | $ | 265 | |
| SOX Index | | $ | 100 | | | $ | 145 | | | $ | 95 | | | $ | 158 | | | $ | 195 | | | $ | 277 | |
1 The graph and table assume that $100 was invested on the last day of trading for the fiscal year ended December 26, 2020 in our common stock, the S&P 100 Index, S&P 500 Index, S&P 500 IT Index and PHLX Semiconductor Sector Index (SOX), and that all dividends were reinvested.
Issuer Purchases of Equity Securities
We have an ongoing authorization, originally approved by our Board of Directors in 2005 and subsequently amended on October 24, 2019, to repurchase shares of our common stock in open market or negotiated transactions. Our last share repurchase under this authorization occurred in Q1 2021, and no shares were repurchased during the fiscal year ending December 27, 2025. As of December 27, 2025, we were authorized to repurchase up to $110.0 billion, of which $7.2 billion remained available.
We issue RSUs as part of our equity incentive plans. In our Consolidated Financial Statements, we treat shares of common stock withheld for tax purposes on behalf of our employees in connection with the vesting of RSUs as common stock repurchases because they reduce the number of shares that would have been issued upon vesting. These withheld shares of common stock are not considered common stock repurchases under our authorized common stock repurchase program.
Rule 10b5-1 Trading Arrangements
Our directors and officers (as defined in Rule 16a-1 under the Exchange Act) may from time to time enter into plans or other arrangements for the purchase or sale of our shares that are intended to satisfy the affirmative defense conditions of Rule 10b5–1(c) or may represent a non-Rule 10b5-1 trading arrangement under the Exchange Act. During the quarter ended December 27, 2025, no such plans or arrangements were adopted or terminated, including by modification.
Cybersecurity
We face significant and persistent cybersecurity risks as a developer of leading-edge manufacturing processes and widely utilized semiconductor products. We are committed to maintaining robust governance and oversight of cybersecurity risks and to implementing mechanisms, controls, technologies and processes designed to help us assess, identify and manage these risks. See "Risk Factors" for more information on our cybersecurity risks and product vulnerability risks. While we have not, as of the date of this Form 10-K, experienced a cybersecurity threat or incident that resulted in a material adverse impact to our business or operations, there can be no guarantee that we will not experience such an incident in the future. We have seen an increase in cyberattack volume, frequency and sophistication. Our cybersecurity program and governance approach are designed to protect our network and information systems, and we have policies, procedures, processes and controls in place to identify, manage and respond to risks from cybersecurity threats. We seek to detect and investigate unauthorized attempts and attacks against our network, products and services and to prevent their occurrence and recurrence where practicable through changes or updates to our internal processes and tools and changes or updates to our products and services; however, we remain potentially vulnerable to known or unknown threats. In some instances, we, our suppliers, our customers and the users of our products and services can be unaware of a threat or incident or its magnitude and effects. Further, there is increasing regulation regarding responses to cybersecurity incidents, including reporting to regulators, which could subject us to additional liability and reputational harm.
We aim to incorporate industry best practices throughout our cybersecurity program. Our cybersecurity program includes written policies, standards and procedures for information security, product security, data protection and privacy; is designed to be aligned with applicable industry standards; and is assessed annually by independent third-party auditors. Our cybersecurity strategy focuses on implementing effective and efficient controls, technologies and other processes to assess, identify, manage and address material cybersecurity threats, risks and incidents. These include, among other things: annual and ongoing security awareness training for employees; mechanisms to detect and monitor unusual network activity; and containment and incident response tools. We actively engage with industry groups for benchmarking and awareness of best practices. We monitor issues that are internally discovered or externally reported and have processes to assess those issues for potential cybersecurity impact or risk. We also have a process in place to manage cybersecurity risks associated with third-party service providers. We impose security requirements upon our suppliers, including: maintaining an effective security management program; abiding by information handling and asset management requirements; and notifying us in the event of any known or suspected cyber incident.
Our Board of Directors has ultimate oversight of cybersecurity risk, which it manages as part of our enterprise risk management program. That program is utilized in making decisions with respect to company priorities, resource allocations and oversight structures. The Board of Directors is assisted by the Audit & Finance Committee, which regularly reviews our cybersecurity program with management and reports to the Board of Directors. Cybersecurity reviews by the Audit & Finance Committee or the Board of Directors generally occur at least twice annually, or more frequently as determined to be necessary or advisable. A number of Intel directors have experience in assessing and managing cybersecurity risk.
Our cybersecurity program is run by our CISO, who reports to our CIO. Our CISO is informed about and monitors prevention, detection, mitigation and remediation efforts through regular communication and reporting from professionals in the information security team—many of whom hold cybersecurity certifications such as a Certified Information Systems Security Professional or Certified Information Security Manager—and through the use of technological tools and software and results from third-party audits. Our CISO has extensive experience assessing and managing cybersecurity programs and cybersecurity risk. Our CISO has served in that position since 2015 and, before Intel, was the Chief Security Officer at McAfee and the Chief Information Officer and CISO for the U.S. House of Representatives. Our CISO regularly reports directly to the Audit & Finance Committee or the Board of Directors on our cybersecurity program and efforts to prevent, detect, mitigate and remediate issues. In addition, we have an escalation process in place to inform senior management and the Board of Directors of material issues.
Disclosure Pursuant to Section 13(r) of the Securities Exchange Act of 1934
Section 13(r) of the Exchange Act requires an issuer to disclose certain information in its periodic reports if it or any of its affiliates knowingly engaged in certain activities, transactions or dealings with individuals or entities subject to specific US economic sanctions during the reporting period, even when the activities, transactions or dealings are conducted in compliance with applicable law. On March 2, 2021, the U.S. Secretary of State designated the Federal Security Service of the Russian Federation (FSB) as a party subject to one such sanction. Though Intel has suspended sales in Russia, there may be a need to file documents or engage with FSB as Intel winds up our local Russian offices. All such dealings are explicitly authorized by General License 1B issued by the U.S. Department of the Treasury's Office of Foreign Assets Control (OFAC), and there are no gross revenues or net profits directly associated with any such dealings by us with the FSB.
On April 15, 2021, the U.S. Department of the Treasury designated Pozitiv Teknolodzhiz, AO (Positive Technologies), a Russian IT security firm, as a party subject to one of the sanctions specified in Section 13(r). Prior to the designation, we communicated with Positive Technologies regarding its IT security research and coordinated disclosure of security vulnerabilities identified by the firm. Based on a license issued by OFAC, we resumed such communications. There are no gross revenues or net profits directly associated with any such activities. We plan to continue these communications in accordance with the terms and conditions of the OFAC license.
Financial Statements and Supplemental Details
We have defined certain terms and abbreviations used throughout our Form 10-K in "Key Terms" within this section.
| | | | | | | | | | | |
| Index to Consolidated Financial Statements | Page |
| Reports of Independent Registered Public Accounting Firm | (PCAOB ID: 42) | | |
| | | |
| | | |
Consolidated Statements of Operations | |
Consolidated Statements of Comprehensive Income (Loss) | |
| Consolidated Balance Sheets | |
| Consolidated Statements of Cash Flows | |
| Consolidated Statements of Stockholders' Equity | |
| | | |
| Notes to Consolidated Financial Statements | |
| | | |
| Basis | |
| Note 1: Basis of Presentation | |
| Note 2: Accounting Policies | |
| | | |
| Performance and Operations | |
| Note 3: Operating Segments | |
| Note 4: Non-Controlling Interests | |
| Note 5: Earnings (Loss) Per Share and Stockholders' Equity | |
| |
| Note 6: Other Financial Statement Details | |
| Note 7: Restructuring and Other Charges | |
| Note 8: Income Taxes | |
| Investments, Long-Term Assets, and Debt | |
| Note 9: Investments | |
| Note 10: Acquisitions and Divestitures | |
| Note 11: Goodwill | |
| Note 12: Identified Intangible Assets | |
| | | |
| Note 13: Borrowings | |
| Note 14: Fair Value | |
| Risk Management and Other | |
| Note 15: Accumulated Other Comprehensive Income (Loss) | |
| Note 16: Derivative Financial Instruments | |
| Note 17: Retirement Benefit Plans | |
| Note 18: Employee Equity Incentive Plans | |
| Note 19: Commitments and Contingencies | |
| Key Terms | |
| | | |
| Index to Supplemental Details | |
| | | |
| Controls and Procedures | |
| Exhibits | |
| Form 10-K Cross-Reference Index | |
| | | | | |
| Report of Independent Registered Public Accounting Firm | |
| |
To the Stockholders and the Board of Directors of Intel Corporation
Opinion on the Financial Statements
We have audited the accompanying consolidated balance sheets of Intel Corporation (the Company) as of December 27, 2025 and December 28, 2024, the related consolidated statements of operations, comprehensive income (loss), cash flows and stockholders' equity for each of the three years in the period ended December 27, 2025 and the related notes (collectively referred to as the "consolidated financial statements"). In our opinion, the consolidated financial statements present fairly, in all material respects, the financial position of the Company at December 27, 2025 and December 28, 2024, and the results of its operations and its cash flows for each of the three years in the period ended December 27, 2025, in conformity with U.S. generally accepted accounting principles.
We also have audited, in accordance with the standards of the Public Company Accounting Oversight Board (United States) (PCAOB), the Company's internal control over financial reporting as of December 27, 2025, based on criteria established in Internal Control—Integrated Framework issued by the Committee of Sponsoring Organizations of the Treadway Commission (2013 framework) and our report dated January 22, 2026 expressed an unqualified opinion thereon.
Basis for Opinion
These financial statements are the responsibility of the Company's management. Our responsibility is to express an opinion on the Company's financial statements based on our audits. We are a public accounting firm registered with the PCAOB and are required to be independent with respect to the Company in accordance with the U.S. federal securities laws and the applicable rules and regulations of the Securities and Exchange Commission and the PCAOB.
We conducted our audits in accordance with the standards of the PCAOB. Those standards require that we plan and perform the audit to obtain reasonable assurance about whether the financial statements are free of material misstatement, whether due to error or fraud. Our audits included performing procedures to assess the risks of material misstatement of the financial statements, whether due to error or fraud, and performing procedures that respond to those risks. Such procedures included examining, on a test basis, evidence regarding the amounts and disclosures in the financial statements. Our audits also included evaluating the accounting principles used and significant estimates made by management, as well as evaluating the overall presentation of the financial statements. We believe that our audits provide a reasonable basis for our opinion.
Critical Audit Matters
The critical audit matters communicated below are matters arising from the current period audit of the financial statements that were communicated or required to be communicated to the audit committee and that: (1) relate to accounts or disclosures that are material to the financial statements and (2) involved our especially challenging, subjective or complex judgments. The communication of critical audit matters does not alter in any way our opinion on the consolidated financial statements, taken as a whole, and we are not, by communicating the critical audit matters below, providing separate opinions on the critical audit matters or on the accounts or disclosures to which they relate.
| | | | | | | | |
| | Inventory Valuation |
| | |
| Description of the Matter | | The Company's net inventory totaled $11.6 billion as of December 27, 2025, representing 5.5% of total assets. As explained in "Note 2: Accounting Policies" within the consolidated financial statements, the Company computes inventory cost on a first-in, first-out basis, and applies judgment in determining saleability of products and the valuation of inventories. The Company assesses inventory at each reporting date in order to assert that it is recorded at net realizable value, giving consideration to, among other factors: whether the products have achieved the substantive engineering milestones to qualify for sale to customers; the determination of normal capacity levels in its manufacturing process to determine which manufacturing overhead costs can be included in the valuation of inventory; whether the product is valued at the lower of cost or net realizable value; and the estimation of excess and obsolete inventory or that which is not of saleable quality. |
| |
| Auditing management's assessment of net realizable value for inventory was challenging because the determination of excess and obsolete inventory reserves is judgmental and considers a number of factors that are affected by market and economic conditions, such as customer forecasts and industry supply and demand. Additionally, for certain new product launches there is limited historical data with which to evaluate forecasts. |
| | |
How We Addressed
the Matter in Our Audit | | We evaluated the design and tested operating effectiveness of the Company's internal controls over the costing of inventory, the determination of whether inventory is of saleable quality, and the determination of demand forecasts and related application against on hand inventory. |
| |
| Our audit procedures included, among others, testing the significant assumptions (e.g., estimated product demand forecasts) of the underlying data used in management's inventory valuation assessment. We compared the significant assumptions used by management to current industry and economic trends. We assessed whether there were any potential sources of contrary information, including historical forecast accuracy or history of significant revisions to previously recorded inventory valuation adjustments, and performed sensitivity analyses over significant assumptions to evaluate the changes in inventory valuation that would result from changes in the assumptions. |
| | |
| | |
| | |
| |
| |
| | |
| | |
| |
| |
| | | | | | | | |
| | Goodwill Impairment Assessment - Mobileye Reporting Unit |
| | |
| Description of the Matter | | At December 27, 2025, the balance of the Company’s goodwill was $23.9 billion. The goodwill attributed to the Mobileye reporting unit was $8.2 billion and represented 3.9% of total assets. As discussed in “Note 2: Accounting Policies” within the consolidated financial statements, goodwill is assessed at the reporting unit level in the fourth quarter of each year, or more frequently if indicators of potential impairment exist. The assessment may include both qualitative and quantitative evaluations. If it is determined, based on the qualitative assessment, that it is more likely than not that the fair value of the unit is less than its carrying amount, a quantitative goodwill impairment test is performed. As discussed in “Note 11: Goodwill” to the consolidated financial statements, the Company identified certain impairment indicators in the three months ended December 27, 2025 which required further quantitative analysis. As a result of this assessment, no goodwill impairment charges related to the Mobileye reporting unit were recorded. |
| |
| Auditing the Company’s Mobileye goodwill impairment evaluation was complex and judgmental due to the significant estimation required in determining the fair value using the income approach. Determining fair value involved assumptions with forward-looking elements that can be affected by future economic and market conditions. In particular, the fair value estimate was sensitive to significant assumptions such as revenue terminal growth rate and the weighted average cost of capital. |
| | |
How We Addressed
the Matter in Our Audit | | We evaluated the design and tested the operating effectiveness of the Company’s internal controls over the Mobileye reporting unit goodwill impairment review process, including controls over management’s review of the valuation model and the significant assumptions discussed above. |
| |
| Our audit procedures included, among others, assessing the suitability and application of the valuation methodology and evaluating the significant assumptions (e.g., revenue terminal growth rate and the weighted average cost of capital) and the underlying data used by the Company in its analysis. We compared the significant assumptions used by management to current industry and economic trends, market information, and other relevant factors. We performed sensitivity analyses of significant assumptions to determine what changes in assumptions are particularly sensitive when assessing the likelihood of impairment, or when calculating the amount of the impairment. We assessed the historical accuracy of management’s estimates. In addition, we utilized internal valuation specialists to assist in our evaluation of the methodology used by the Company and certain significant assumptions. |
| | |
| | |
| | |
| |
| |
| | |
| | |
| |
| |
/s/ Ernst & Young LLP
We have served as the Company's auditor since 1968.
San Jose, California
January 22, 2026
| | | | | |
| Report of Independent Registered Public Accounting Firm | |
| |
To the Stockholders and the Board of Directors of Intel Corporation
Opinion on Internal Control Over Financial Reporting
We have audited Intel Corporation's internal control over financial reporting as of December 27, 2025, based on criteria established in Internal Control—Integrated Framework issued by the Committee of Sponsoring Organizations of the Treadway Commission (2013 framework) (the COSO criteria). In our opinion, Intel Corporation (the Company) maintained, in all material respects, effective internal control over financial reporting as of December 27, 2025, based on the COSO criteria.
We also have audited, in accordance with the standards of the Public Company Accounting Oversight Board (United States) (PCAOB), the 2025 consolidated financial statements of the Company and our report dated January 22, 2026 expressed an unqualified opinion thereon.
Basis for Opinion
The Company's management is responsible for maintaining effective internal control over financial reporting and for its assessment of the effectiveness of internal control over financial reporting included in the accompanying Management Report on Internal Control Over Financial Reporting. Our responsibility is to express an opinion on the Company's internal control over financial reporting based on our audit. We are a public accounting firm registered with the PCAOB and are required to be independent with respect to the Company in accordance with the U.S. federal securities laws and the applicable rules and regulations of the Securities and Exchange Commission and the PCAOB.
We conducted our audit in accordance with the standards of the PCAOB. Those standards require that we plan and perform the audit to obtain reasonable assurance about whether effective internal control over financial reporting was maintained in all material respects.
Our audit included obtaining an understanding of internal control over financial reporting, assessing the risk that a material weakness exists, testing and evaluating the design and operating effectiveness of internal control based on the assessed risk, and performing such other procedures as we considered necessary in the circumstances. We believe that our audit provides a reasonable basis for our opinion.
Definition and Limitations of Internal Control Over Financial Reporting
A company's internal control over financial reporting is a process designed to provide reasonable assurance regarding the reliability of financial reporting and the preparation of financial statements for external purposes in accordance with generally accepted accounting principles. A company's internal control over financial reporting includes those policies and procedures that (1) pertain to the maintenance of records that, in reasonable detail, accurately and fairly reflect the transactions and dispositions of the assets of the company; (2) provide reasonable assurance that transactions are recorded as necessary to permit preparation of financial statements in accordance with generally accepted accounting principles, and that receipts and expenditures of the company are being made only in accordance with authorizations of management and directors of the company; and (3) provide reasonable assurance regarding prevention or timely detection of unauthorized acquisition, use, or disposition of the company's assets that could have a material effect on the financial statements.
Because of its inherent limitations, internal control over financial reporting may not prevent or detect misstatements. Also, projections of any evaluation of effectiveness to future periods are subject to the risk that controls may become inadequate because of changes in conditions, or that the degree of compliance with the policies or procedures may deteriorate.
/s/ Ernst & Young LLP
San Jose, California
January 22, 2026
| | | | | |
Consolidated Statements of Operations | |
| |
| | | | | | | | | | | | | | | | | | | | |
| Years Ended (In Millions, Except Per Share Amounts) | | Dec 27, 2025 | | Dec 28, 2024 | | Dec 30, 2023 |
| Net revenue | | $ | 52,853 | | | $ | 53,101 | | | $ | 54,228 | |
| Cost of sales | | 34,478 | | | 35,756 | | | 32,517 | |
Gross profit | | 18,375 | | | 17,345 | | | 21,711 | |
| Research and development | | 13,774 | | | 16,546 | | | 16,046 | |
Marketing, general, and administrative | | 4,624 | | | 5,507 | | | 5,634 | |
| Restructuring and other charges | | 2,191 | | | 6,970 | | | (62) | |
| | | | | | |
| Operating expenses | | 20,589 | | | 29,023 | | | 21,618 | |
| Operating income (loss) | | (2,214) | | | (11,678) | | | 93 | |
| Gains (losses) on equity investments, net | | 514 | | | 242 | | | 40 | |
| Interest and other, net | | 3,257 | | | 226 | | | 629 | |
| Income (loss) before taxes | | 1,557 | | | (11,210) | | | 762 | |
| Provision for (benefit from) taxes | | 1,531 | | | 8,023 | | | (913) | |
| Net income (loss) | | 26 | | | (19,233) | | | 1,675 | |
| Less: net income (loss) attributable to non-controlling interests | | 293 | | | (477) | | | (14) | |
| Net income (loss) attributable to Intel | | $ | (267) | | | $ | (18,756) | | | $ | 1,689 | |
| Earnings (loss) per share attributable to Intel—basic | | $ | (0.06) | | | $ | (4.38) | | | $ | 0.40 | |
Earnings (loss) per share attributable to Intel—diluted | | $ | (0.06) | | | $ | (4.38) | | | $ | 0.40 | |
| | | | | | |
| Weighted average shares of common stock outstanding: | | | | | | |
| Basic | | 4,530 | | | 4,280 | | | 4,190 | |
| Diluted | | 4,530 | | | 4,280 | | | 4,212 | |
See accompanying notes.
| | | | | | | | | | | |
| Financial Statements | Consolidated Statements of Operations | 60 |
| | | | | |
Consolidated Statements of Comprehensive Income (Loss) | |
| |
| | | | | | | | | | | | | | | | | | | | |
| Years Ended (In Millions) | | Dec 27, 2025 | | Dec 28, 2024 | | Dec 30, 2023 |
| Net income (loss) | | $ | 26 | | | $ | (19,233) | | | $ | 1,675 | |
| Changes in other comprehensive income (loss), net of tax: | | | | | | |
| | | | | | |
| | | | | | |
| Net unrealized holding gains (losses) on derivatives | | 743 | | | (555) | | | 272 | |
| Actuarial valuation and other pension benefits (expenses), net | | 78 | | | 60 | | | 66 | |
| Translation adjustments and other | | 3 | | | (1) | | | 9 | |
| Other comprehensive income (loss) | | 824 | | | (496) | | | 347 | |
| Total comprehensive income (loss) | | 850 | | | (19,729) | | | 2,022 | |
| Less: comprehensive income (loss) attributable to non-controlling interests | | 293 | | | (477) | | | (14) | |
| Total comprehensive income (loss) attributable to Intel | | $ | 557 | | | $ | (19,252) | | | $ | 2,036 | |
See accompanying notes.
| | | | | | | | | | | |
| Financial Statements | Consolidated Statements of Comprehensive Income (Loss) | 61 |
| | | | | |
| Consolidated Balance Sheets | |
| |
| | | | | | | | | | | | | | |
| (In Millions, Except Par Value) | | Dec 27, 2025 | | Dec 28, 2024 |
| Assets | | | | |
| Current assets: | | | | |
| Cash and cash equivalents | | $ | 14,265 | | | $ | 8,249 | |
| Short-term investments | | 23,151 | | | 13,813 | |
| | | | |
| Accounts receivable, net | | 3,839 | | | 3,478 | |
| Inventories | | 11,618 | | | 12,198 | |
| | | | |
| | | | |
| Other current assets | | 10,815 | | | 9,586 | |
| Total current assets | | 63,688 | | | 47,324 | |
| | | | |
Property, plant and equipment, net | | 105,414 | | | 107,919 | |
| Equity investments | | 8,512 | | | 5,383 | |
| | | | |
| Goodwill | | 23,912 | | | 24,693 | |
| Identified intangible assets, net | | 2,772 | | | 3,691 | |
| Other long-term assets | | 7,131 | | | 7,475 | |
| Total assets | | $ | 211,429 | | | $ | 196,485 | |
| | | | |
| Liabilities and stockholders' equity | | | | |
| Current liabilities: | | | | |
| Accounts payable | | $ | 9,882 | | | $ | 12,556 | |
| Accrued compensation and benefits | | 3,990 | | | 3,343 | |
| Short-term debt | | 2,499 | | | 3,729 | |
| | | | |
| | | | |
| | | | |
| Income taxes payable | | 604 | | | 1,756 | |
| Other accrued liabilities | | 14,600 | | | 14,282 | |
| Total current liabilities | | 31,575 | | | 35,666 | |
| | | | |
| Debt | | 44,086 | | | 46,282 | |
| | | | |
| | | | |
| | | | |
| Other long-term liabilities | | 9,408 | | | 9,505 | |
| Commitments and Contingencies (Note 19) | | | | |
| | | | |
| Stockholders' equity: | | | | |
| Preferred stock, $0.001 par value, 50 shares authorized; none issued | | — | | | — | |
| Common stock, $0.001 par value, 10,000 shares authorized; 4,994 shares issued and outstanding (4,330 issued and outstanding in 2024) and capital in excess of par value | | 65,185 | | | 50,949 | |
| Accumulated other comprehensive income (loss) | | 113 | | | (711) | |
| Retained earnings | | 48,983 | | | 49,032 | |
| Total Intel stockholders' equity | | 114,281 | | | 99,270 | |
| Non-controlling interests | | 12,079 | | | 5,762 | |
| Total stockholders' equity | | 126,360 | | | 105,032 | |
| Total liabilities and stockholders' equity | | $ | 211,429 | | | $ | 196,485 | |
See accompanying notes.
| | | | | | | | | | | |
| Financial Statements | Consolidated Balance Sheets | 62 |
| | | | | |
| Consolidated Statements of Cash Flows | |
| |
| | | | | | | | | | | | | | | | | | | | |
| Years Ended (In Millions) | | Dec 27, 2025 | | Dec 28, 2024 | | Dec 30, 2023 |
| Cash and cash equivalents, beginning of period | | $ | 8,249 | | | $ | 7,079 | | | $ | 11,144 | |
| Cash flows provided by (used for) operating activities: | | | | | | |
| Net income (loss) | | 26 | | | (19,233) | | | 1,675 | |
| Adjustments to reconcile net income (loss) to net cash provided by operating activities: | | | | | | |
| Depreciation | | 10,757 | | | 9,951 | | | 7,847 | |
| Share-based compensation | | 2,434 | | | 3,410 | | | 3,229 | |
| | | | | | |
| Restructuring and other charges | | 476 | | | 3,491 | | | (424) | |
| Amortization of intangibles | | 949 | | | 1,428 | | | 1,755 | |
| (Gains) losses on equity investments, net | | (514) | | | (246) | | | (42) | |
| Mark-to-market (gains) losses on Escrowed Shares | | 1,796 | | | — | | | — | |
| | | | | | |
| (Gains) losses on divestitures | | (5,323) | | | — | | | — | |
| Deferred taxes | | 328 | | | 6,132 | | | (2,033) | |
| Impairments and net (gain) loss on retirement of property, plant and equipment | | 515 | | | 2,252 | | | 33 | |
| Changes in assets and liabilities: | | | | | | |
| Accounts receivable | | (449) | | | (75) | | | 731 | |
| Inventories | | (138) | | | (1,105) | | | 2,097 | |
| Accounts payable | | 297 | | | 634 | | | (801) | |
| Accrued compensation and benefits | | 788 | | | (218) | | | (614) | |
| | | | | | |
| Income taxes | | (995) | | | (356) | | | (1,498) | |
| Other assets and liabilities | | (1,250) | | | 2,223 | | | (484) | |
| Total adjustments | | 9,671 | | | 27,521 | | | 9,796 | |
| Net cash provided by (used for) operating activities | | 9,697 | | | 8,288 | | | 11,471 | |
| Cash flows provided by (used for) investing activities: | | | | | | |
| Additions to property, plant and equipment | | (14,646) | | | (23,944) | | | (25,750) | |
| | | | | | |
| Proceeds from capital-related government incentives | | 1,577 | | | 1,936 | | | 1,011 | |
| | | | | | |
| Purchases of short-term investments | | (24,319) | | | (37,940) | | | (44,414) | |
| Maturities and sales of short-term investments | | 15,387 | | | 41,463 | | | 44,077 | |
| | | | | | |
| | | | | | |
| | | | | | |
| | | | | | |
| | | | | | |
| | | | | | |
| Sales of equity investments | | 671 | | | 1,047 | | | 472 | |
| | | | | | |
| Proceeds from divestitures, net | | 6,157 | | | — | | | — | |
| Other investing | | 352 | | | (818) | | | 563 | |
| Net cash provided by (used for) investing activities | | (14,821) | | | (18,256) | | | (24,041) | |
| Cash flows provided by (used for) financing activities: | | | | | | |
| Issuance of commercial paper, net of issuance costs | | 3,493 | | | 7,349 | | | — | |
| Repayment of commercial paper | | (3,493) | | | (7,349) | | | (3,944) | |
| | | | | | |
| | | | | | |
| Partner contributions | | 5,108 | | | 12,714 | | | 1,511 | |
| Net proceeds from sales of subsidiary shares | | 921 | | | — | | | 2,959 | |
| Additions to property, plant and equipment | | (3,026) | | | (1,178) | | | — | |
| | | | | | |
| Issuance of long-term debt, net of issuance costs | | — | | | 2,975 | | | 11,391 | |
| Repayment of debt | | (3,750) | | | (2,288) | | | (423) | |
| Proceeds from sales of common stock through employee equity incentive plans | | 771 | | | 987 | | | 1,042 | |
| Net proceeds attributed to common stock and warrants issued, and Escrowed Shares | | 12,706 | | | — | | | — | |
| | | | | | |
| | | | | | |
| | | | | | |
| Restricted stock unit withholdings | | (423) | | | (631) | | | (534) | |
| Payment of dividends to stockholders | | — | | | (1,599) | | | (3,088) | |
| | | | | | |
| | | | | | |
| | | | | | |
| | | | | | |
| Other financing | | (720) | | | 158 | | | (409) | |
| Net cash provided by (used for) financing activities | | 11,587 | | | 11,138 | | | 8,505 | |
| | | | | | |
| Net increase (decrease) in cash and cash equivalents | | 6,463 | | | 1,170 | | | (4,065) | |
| Cash, cash equivalents, and restricted cash, end of period | | $ | 14,712 | | | $ | 8,249 | | | $ | 7,079 | |
| Non-cash supplemental disclosures: | | | | | | |
| Acquisition of property, plant and equipment | | $ | 4,952 | | | $ | 8,125 | | | $ | 4,804 | |
| | | | | | |
| | | | | | |
| | | | | | |
| Cash paid during the year for: | | | | | | |
| Interest, net of capitalized interest | | $ | 1,106 | | | $ | 987 | | | $ | 613 | |
| | | | | | |
| | | | | | |
See accompanying notes. | | | | | | | | | | | |
| Financial Statements | Consolidated Statements of Cash Flows | 63 |
| | | | | |
| Consolidated Statements of Stockholders' Equity | |
| |
| | | | | | | | | | | | | | | | | | | | | | | | | | | | | | | | | | | | | | | | |
| | Common Stock and Capital
in Excess of Par Value | | Accumulated
Other
Comprehensive
Income (Loss) | | Retained Earnings | | Non-Controlling Interests | | Total | | |
| (In Millions, Except Per Share Amounts) | | Number of
Shares | | Amount | | | |
| | | | | | | | | | | | | | |
| | | | | | | | | | | | | | |
| | | | | | | | | | | | | | |
| | | | | | | | | | | | | | |
| Balance as of December 31, 2022 | | 4,137 | | | $ | 31,580 | | | $ | (562) | | | $ | 70,405 | | | $ | 1,863 | | | $ | 103,286 | | | |
| | | | | | | | | | | | | | |
| Net income (loss) | | — | | | — | | — | | 1,689 | | | (14) | | | 1,675 | | | |
| Other comprehensive income (loss) | | — | | | — | | 347 | | | — | | — | | | 347 | | | |
| | | | | | | | | | | | | | |
Proceeds from sales of subsidiary shares
and partner contributions | | — | | | 1,620 | | | — | | | — | | | 2,385 | | | 4,005 | | | |
| Employee equity incentive plans and other | | 107 | | | 1,044 | | | — | | — | | — | | | 1,044 | | | |
| Share-based compensation | | — | | | 3,088 | | | — | | — | | 141 | | | 3,229 | | | |
| | | | | | | | | | | | | | |
| Restricted stock unit withholdings | | (16) | | | (683) | | | — | | 150 | | | — | | | (533) | | | |
Cash dividends declared ($0.74 per share of common stock) | | — | | | — | | — | | (3,088) | | | — | | | (3,088) | | | |
| Balance as of December 30, 2023 | | 4,228 | | | $ | 36,649 | | | $ | (215) | | | $ | 69,156 | | | $ | 4,375 | | | $ | 109,965 | | | |
| | | | | | | | | | | | | | |
| Net income (loss) | | — | | | — | | — | | (18,756) | | | (477) | | | (19,233) | | | |
| Other comprehensive income (loss) | | — | | | — | | (496) | | | — | | — | | | (496) | | | |
| | | | | | | | | | | | | | |
| Net proceeds from partner contributions | | — | | | 11,012 | | | — | | — | | 1,702 | | | 12,714 | | | |
| Partner distributions | | — | | | — | | — | | — | | (43) | | | (43) | | | |
| Employee equity incentive plans and other | | 123 | | | 988 | | | — | | — | | — | | | 988 | | | |
| Share-based compensation | | — | | | 3,162 | | | — | | — | | 205 | | | 3,367 | | | |
| Restricted stock unit withholdings | | (21) | | | (862) | | | — | | 231 | | | — | | | (631) | | | |
Cash dividends declared ($0.38 per share of common stock) | | — | | | — | | — | | (1,599) | | | — | | | (1,599) | | | |
| Balance as of December 28, 2024 | | 4,330 | | | $ | 50,949 | | | $ | (711) | | | $ | 49,032 | | | $ | 5,762 | | | $ | 105,032 | | | |
| | | | | | | | | | | | | | |
Opening balance adjustment1 | | — | | | — | | | — | | | 49 | | | — | | | 49 | | | |
| Net income (loss) | | — | | | — | | | — | | | (267) | | | 293 | | | 26 | | | |
| Other comprehensive income (loss) | | — | | | — | | | 824 | | | — | | | — | | | 824 | | | |
| | | | | | | | | | | | | | |
Net proceeds from stock issuances and warrants2 | | 580 | | | 11,835 | | | — | | | — | | | — | | | 11,835 | | | |
| Net proceeds from sales of subsidiary shares and partner contributions | | — | | | 59 | | | — | | | — | | | 5,970 | | | 6,029 | | | |
Partner distributions | | — | | | — | | | — | | | — | | | (217) | | | (217) | | | |
| Employee equity incentive plans and other | | 101 | | | 771 | | | — | | | — | | | — | | | 771 | | | |
| Share-based compensation | | — | | | 2,163 | | | — | | | — | | | 271 | | | 2,434 | | | |
| | | | | | | | | | | | | | |
| Restricted stock unit withholdings | | (17) | | | (592) | | | — | | | 169 | | | — | | | (423) | | | |
| | | | | | | | | | | | | | |
| Balance as of December 27, 2025 | | 4,994 | | $ | 65,185 | | | $ | 113 | | | $ | 48,983 | | | $ | 12,079 | | | $ | 126,360 | | | |
1 We made a cumulative-effect adjustment to the opening balance of retained earnings upon adopting ASU 2023-08 in 2025.
2 Includes $110 million of allocated proceeds to warrants from the U.S. Government Agreement we entered into in August 2025.
See accompanying notes.
| | | | | | | | | | | |
| Financial Statements | Consolidated Statements of Stockholders' Equity | 64 |
| | | | | |
Notes to Consolidated Financial Statements | |
| |
| | | | | |
| Note 1 : | Basis of Presentation |
We have a 52- or 53-week fiscal year that ends on the last Saturday in December. Fiscal years 2025, 2024 and 2023 were 52-week fiscal years. Fiscal 2026 is a 52-week fiscal year. Our Consolidated Financial Statements include the accounts of Intel and our wholly owned and majority-owned subsidiaries, which include entities consolidated under the variable interest and voting interest models. We have eliminated intercompany accounts and transactions.
Use of Estimates
The preparation of Consolidated Financial Statements in conformity with U.S. GAAP requires us to make estimates and judgments that affect the amounts reported in our Consolidated Financial Statements and the accompanying notes. The actual results that we experience may differ materially from our estimates.
| | | | | |
| Note 2 : | Accounting Policies |
Revenue Recognition
We recognize net product revenue when we satisfy performance obligations as evidenced by the transfer of control of our products or services to customers. Substantially all of our revenue is derived from product sales. Our products often include a software component, such as firmware, that is highly interdependent and interrelated with the product and is substantially accounted for as a combined performance obligation. In accordance with contract terms, the revenue for combined performance obligations and standalone product sales is recognized at the time of product shipment from our facilities or delivery to the customer location, as determined by the agreed-upon shipping terms.
We measure revenue based on the amount of consideration we expect to be entitled to in exchange for products or services. Variable consideration is estimated and reflected as an adjustment to the transaction price. We determine variable consideration, which consists primarily of various sales price concessions, by estimating the most likely amount of net consideration we expect to receive from the customer based on historical analysis of customer purchase volumes. Sales rebates earned by customers are offset against their receivable balances. Rebates earned by customers when they do not have outstanding receivable balances are recorded within other accrued liabilities.
We make payments to our customers through cooperative advertising programs for marketing activities for some of our products. We generally record the payment as a reduction in revenue in the period that the revenue is earned, unless the payment is for a distinct service, which we record as an expense when the marketing activities occur.
Long-Lived Assets
Property, Plant and Equipment
We compute depreciation using the straight-line method over the estimated useful life of assets. We also capitalize interest on borrowings related to eligible capital expenditures. Capitalized interest is added to the cost of qualified assets and depreciated over the estimated useful life.
At least annually, we evaluate the period over which we expect to recover the economic value of our property, plant and equipment, considering factors such as the process technology cadence between node transitions, changes in machinery and equipment technology and re-use of machinery and tools across each generation of process technology. As we make manufacturing process conversions and other factory planning decisions, we use assumptions involving the use of management judgments regarding the remaining useful lives of assets, primarily process-specific semiconductor manufacturing tools and building improvements. When we determine that the useful lives of assets are shorter or longer than we had originally estimated, we adjust the rate of depreciation to reflect the assets' revised useful lives.
Assets are categorized and evaluated for impairment at the lowest level of identifiable cash flows. Factors that we consider in deciding when to perform an impairment review include significant under-performance of a business or product line in relation to expectations, significant negative industry or economic trends and significant changes or planned changes in our use and fungibility of the assets. If the carrying value of an asset grouping is not recoverable through the related undiscounted cash flows, the fair value of the asset grouping must be determined. An impairment is recognized if the carrying value of the asset grouping exceeds the determined fair value.
| | | | | | | | | | | |
| Financial Statements | Notes to Consolidated Financial Statements | 65 |
Identified Intangible Assets
We amortize intangible assets, including internal-use software, that are subject to amortization using the straight-line method over their estimated useful lives. We perform periodic reviews of significant finite-lived identified intangible assets to determine whether facts and circumstances indicate that the carrying amount may not be recoverable. An impairment is recognized if the carrying amount is not recoverable and exceeds the determined fair value. These reviews can be affected by various factors, including external factors such as industry and economic trends, and internal factors such as changes in our business strategy and our forecasts for specific product lines. Periodically, we also evaluate the estimated remaining useful lives of intangible assets and whether events or changes in circumstances warrant a revision to the remaining periods of amortization. We may adjust the period over which these assets are amortized to reflect the period over which they are expected to contribute to our cash flows.
Goodwill
We perform an annual impairment assessment of goodwill at the reporting unit level in the fourth quarter of each year, or more frequently if indicators of potential impairment exist. We have five reporting units with allocated goodwill, which generally align to our operating segments. We reevaluate our identified reporting units annually or when triggered, such as upon reorganization of our operating segments or due to business reasons that result in material changes as to how our reporting units are organized and managed. Impairment assessments may be qualitative or quantitative in nature. A quantitative assessment is required if we determine, based on a qualitative assessment, that it is more likely than not that a reporting unit’s fair value is less than its carrying value, or if there are material changes to the structure of our reporting units. The reporting unit's carrying value used in an impairment assessment represents the allocation of various assets and liabilities, excluding certain corporate assets and liabilities, such as cash, investments and debt.
Our qualitative assessment considers industry and market considerations, overall financial performance and other relevant events and factors affecting the reporting unit or Intel as a whole. Our quantitative impairment assessment considers both the market approach and the income approach to estimate a reporting unit's fair value. The market approach estimates fair value using financial multiples and transaction prices of comparable companies. The income approach estimates fair value using a discounted cash flow analysis which includes estimates for market segment growth rates, our assumed market segment share, estimated gross margins, operating expenses and discount rates based on a reporting unit's weighted average cost of capital, among others. We test the reasonableness of the inputs and outcomes of our discounted cash flow analysis against available market data. These estimates change from year to year based on operating results, market conditions and other factors and could materially affect the determination of the fair value and potential goodwill impairment for each reporting unit. Our quantitative assessment is sensitive to changes in underlying estimates and assumptions, the most sensitive of which is the discount rate.
Inventories
We compute inventory cost on a first-in, first-out basis. Our process and product development life cycle corresponds with substantive engineering milestones. These engineering milestones are regularly and consistently applied in assessing the point at which our activities and associated costs change in nature from R&D to cost of sales, and when cost of sales can be capitalized as inventory.
For a product to be manufactured in high volumes and sold to our customers under our standard warranty, it must meet our rigorous technical quality specifications. We have identified the start of manufacturing volume for sale to customers as the point at which the costs incurred to manufacture our products are included in the valuation of inventory. Prior to the start of manufacturing volume for sale to customers, costs that do not meet the criteria for R&D are included in cost of sales in the period incurred.
The valuation of inventory includes determining which fixed production overhead costs can be included in inventory based on the normal capacity of our manufacturing and assembly and test facilities. We apply our historical loading compared to our total available capacity to determine our expectations of normal capacity level. If the factory loading is below the established normal capacity level, a portion of our fixed production overhead costs would not be included in the cost of inventory; instead, it would be recognized as cost of sales in that period. We refer to these costs as excess capacity charges. Excess capacity charges were $493 million in 2025, $174 million in 2024 and $834 million in 2023.
Inventory is valued at the lower of cost or net realizable value, based upon assumptions about future demand and market conditions. Product-specific facts and circumstances reviewed in the inventory valuation process include a review of our customer base, the stage of the product life cycle, variations in market pricing and an assessment of selling price in relation to product cost. Lower of cost or net realizable value inventory reserves fluctuate as we ramp new process technologies, with costs generally improving over time due to scale and improved yields. Additionally, inventory valuation is impacted by cyclical changes in market conditions and the associated pricing environment.
The valuation of inventory also requires us to estimate obsolete and excess inventory, as well as inventory that is not of saleable quality. We use a demand forecast to develop our short-term manufacturing plans to enable consistency between inventory valuations and build decisions. For certain new products, we have limited historical data when developing these demand forecasts. We compare the estimate of future demand to work-in-process and finished goods inventory levels to determine the amount, if any, of obsolete or excess inventory. When our demand forecast for specific products is greater than actual demand and we fail to reduce manufacturing output accordingly, we write off amounts considered to be excess inventory.
| | | | | | | | | | | |
| Financial Statements | Notes to Consolidated Financial Statements | 66 |
Government Incentives
Government incentives, including cash grants and refundable tax credits, are recognized when there is reasonable assurance that the incentive will be received and we will comply with the conditions specified in the agreement or statutory requirements. We record capital-related incentives as a reduction to property, plant and equipment, net within our Consolidated Balance Sheets and recognize a reduction to depreciation expense over the useful life of the corresponding acquired asset. We record operating-related incentives as a reduction to expense in the same period and in the same line item on the Consolidated Statements of Operations as the expenditure for which the incentive is intended to compensate.
Equity Issuances
We recognize equity issuances on the settlement date, which is the date on which legal ownership transfers to the investor. We measure equity issuances at fair value on the settlement date determined using observable market prices of our common stock. If shares are issued at a discount to market price, we determine whether the discount represents other rights conveyed in the contract and, if not, record at the transacted amounts.
We may enter into financial instruments providing for the issuance of our common stock at future dates. These financial instruments are evaluated for classification and are included in equity within our Consolidated Balance Sheets based on their terms and conditions if the criteria for equity classification is met.
Direct and incremental costs incurred in connection with the issuances of equity or equity-classified instruments are recorded as a reduction to our capital in excess of par value.
Earnings Per Share
Basic earnings (loss) per share is computed using the weighted average number of shares of common stock outstanding during the period. Diluted earnings (loss) per share includes the impact of potentially dilutive securities, such as stock options, RSUs, warrants and Escrowed Shares, when the effect of including these securities is not anti-dilutive. The treasury stock method is applied to equity incentive plans and contractual issuances, while the if-converted method is used for instruments with conversion features. Shares are included in basic earnings (loss) per share only when they are no longer contingently issuable with weighted share impacts calculated based upon the date the contingency ends. Diluted earnings (loss) per share is adjusted for changes in fair value of derivative liabilities associated with shares released from escrow during the year.
Fair Value
When determining fair value, we consider the principal or most advantageous market in which we would transact, as well as assumptions that market participants would use when pricing the asset or liability. Our financial assets are measured and recorded at fair value on a recurring basis, except for equity securities measured using the measurement alternative, equity method investments, certain other receivables and grants receivable. We assess fair value hierarchy levels for our issued debt and fixed-income investment portfolio based on the underlying instrument type.
The three levels of inputs that may be used to measure fair value are:
▪Level 1. Quoted prices in active markets for identical assets or liabilities. We evaluate security-specific market data when determining whether a market is active.
▪Level 2. Observable inputs other than Level 1 prices, such as quoted prices for similar assets or liabilities, quoted prices in less active markets or model-derived valuations. All significant inputs used in our valuations, such as discounted cash flows, are observable or can be derived principally from or corroborated with observable market data for substantially the full term of the assets or liabilities. We use yield curves, overnight indexed swap curves, currency spot and forward rates and credit ratings as significant inputs in our valuations. Level 2 inputs also include non-binding market consensus prices, as well as quoted prices that were adjusted for security-specific restrictions. When we use non-binding market consensus prices, we corroborate them with quoted market prices for similar instruments or compare them to output from internally developed pricing models such as discounted cash flow models.
▪Level 3. Unobservable inputs to the valuation methodology that are significant to the measurement of the fair value of assets or liabilities. We monitor and review the inputs and results of these valuation models to help confirm that the fair value measurements are reasonable and consistent with market experience in similar asset and liability classes. Level 3 inputs also include non-binding market consensus prices, non-binding broker quotes and probability-weighted outcomes that we are unable to corroborate with observable market data.
Equity Investments
We regularly invest in equity securities of public and private companies to promote business and strategic objectives. Equity investments are measured and recorded as follows:
▪Marketable equity investments are equity securities with RDFV that are measured and recorded at fair value on a recurring basis with changes in fair value, whether realized or unrealized, recorded through our Consolidated Statements of Operations.
| | | | | | | | | | | |
| Financial Statements | Notes to Consolidated Financial Statements | 67 |
▪Non-marketable equity investments are equity securities without RDFV that are measured and recorded using a measurement alternative that measures the securities at cost minus impairment, if any, plus or minus changes resulting from qualifying observable price changes. Changes in carrying value of non-marketable equity investments are recorded through our Consolidated Statements of Operations.
▪Equity method investments are equity securities in investees we do not control but over which we have the ability to exercise significant influence. Equity method investments are measured at cost minus impairment, if any, plus or minus our share of equity method investee income or loss. Our proportionate share of the income or loss from equity method investments is typically recognized on a one-quarter lag in our Consolidated Statements of Operations due to investee reporting cycle timing.
Realized and unrealized gains and losses resulting from changes in fair value or the sale of our equity investments are recorded in gains (losses) on equity investments, net. The carrying value of our non-marketable equity investments is adjusted for qualifying observable price changes resulting from the issuance of similar or identical securities in an orderly transaction by the same issuer. Determining whether an observed transaction is similar to a security within our portfolio requires judgment based on the rights and preferences of the securities.
Non-marketable equity investments and equity method investments (collectively referred to as non-marketable equity investments) are also subject to periodic impairment reviews. Our quarterly impairment analysis considers both qualitative and quantitative factors. When indicators of impairment exist, we prepare quantitative assessments of the fair value of our non-marketable equity investments using both the market and income approaches.
▪Non-marketable equity investments are tested for impairment using a qualitative model similar to the model used for goodwill and property, plant and equipment. Upon determining that an impairment may exist, the security's fair value is calculated and compared to its carrying value, and an impairment is recognized immediately if the carrying value exceeds the fair value.
▪Equity method investments are subject to periodic impairment reviews using the other-than-temporary impairment model, which considers the severity and duration of a decline in fair value below carrying value and our ability and intent to hold the investment for a sufficient period of time to allow for recovery.
Impairments of non-marketable equity investments are recorded in gains (losses) on equity investments, net.
Derivative Financial Instruments
Our primary objective for holding derivative financial instruments is to manage currency exchange rate risk and interest rate risk, and, to a lesser extent, equity market risk, commodity price risk and credit risk. We enter into master netting arrangements to mitigate credit risk in derivative transactions by permitting net settlement of transactions with the same counterparty. We also enter into collateral security arrangements with certain of our counterparties to exchange cash collateral when the net fair value of certain derivative instruments fluctuates from contractually established thresholds. For presentation on our Consolidated Balance Sheets, we do not offset fair value amounts recognized for derivative instruments under master netting arrangements. Our derivative financial instruments, including related collateral amounts, are presented at fair value on a gross basis in our Consolidated Balance Sheets and are included in other current assets, other long-term assets, other accrued liabilities or other long-term liabilities.
Cash flow hedges use foreign currency contracts, such as currency forwards and currency swaps, to hedge exposures for variability in the U.S.-dollar equivalent of non-U.S.-dollar-denominated cash flows associated with our forecasted operating and capital purchases spending.
The after-tax gains or losses from the effective portion of a cash flow hedge are reported as a component of accumulated other comprehensive income (loss) and reclassified into earnings in the same period or periods in which the hedged transaction affects earnings, and in the same line item on the Consolidated Statements of Operations as the impact of the hedge transaction. For foreign currency contracts hedging our capital purchases, forward points are excluded from the hedge effectiveness assessment, and are recognized in earnings in the same income statement line item used to present the earnings effect of the hedged item. If the cash flow hedge transactions become improbable, the corresponding amounts deferred in accumulated other comprehensive income (loss) would be immediately reclassified to interest and other, net. Cash flows associated with these derivatives are classified in the Consolidated Statements of Cash Flows in the same section as the underlying item.
Fair value hedges use interest rate contracts, such as interest rate swaps, to hedge against changes in the fair value of certain of our fixed-rate indebtedness attributable to changes in the benchmark interest rate. The gains or losses on these hedges, as well as the offsetting losses or gains related to the changes in the fair value of the underlying hedged item attributable to the hedged risk, are recognized in earnings in the current period, primarily in interest and other, net. Cash flows associated with these derivatives are classified in the Consolidated Statements of Cash Flows in the same section as the underlying item.
| | | | | | | | | | | |
| Financial Statements | Notes to Consolidated Financial Statements | 68 |
Non-designated hedges use foreign currency contracts to economically hedge the functional currency equivalent cash flows of recognized monetary assets and liabilities, and non-U.S.-dollar-denominated debt investment instruments that we reference in this paragraph and the Debt Investments section below as hedged investments. We also use interest rate contracts to economically hedge interest rate risk related to our U.S.-dollar-denominated fixed-rate debt investments that we also reference as hedged investments. Lastly, certain of our contractual arrangements contain terms that meet the definition of a derivative and require bifurcation from the host contract. The change in fair value of these non-designated derivatives is recorded through earnings in the line item on the Consolidated Statements of Operations to which the derivatives most closely relate, primarily in interest and other, net and changes in the fair value of the underlying assets and liabilities associated with the hedged risk are generally offset by the changes in the fair value of the related derivatives.
Debt Investments
Debt investments include investments in corporate debt, government debt and financial institution instruments. Unhedged debt investments with original maturities of approximately three months or less from the date of purchase are classified within cash and cash equivalents. Unhedged debt investments with original maturities at the date of purchase greater than approximately three months and all economically hedged debt investments are classified as short-term investments, as they represent the investment of cash available for current operations.
For certain of our marketable debt investments, we economically hedge market risks at inception with a related derivative instrument, or the marketable debt investment itself is used to economically hedge currency exchange rate risk from remeasurement. These hedged investments are reported at fair value. Gains or losses on these investments arising from changes in fair value due to interest rate and currency market fluctuations and credit market volatility, largely offset by losses or gains on the related derivative instruments and balance sheet remeasurement, are recorded in interest and other, net. Our remaining unhedged marketable debt investments are reported at fair value, with unrealized gains or losses, net of tax, recorded in accumulated other comprehensive income (loss). We determine the cost of the investment sold at the individual security level and record the interest income and realized gains or losses on the sale of these investments in interest and other, net.
Unhedged debt investments are subject to periodic impairment reviews. For investments in an unrealized loss position, we determine whether a credit loss exists by considering information about the collectability of the instrument, current market conditions and reasonable and supportable forecasts of economic conditions. We recognize an allowance for credit losses, up to the amount of the unrealized loss when appropriate, and write down the amortized cost basis of the investment if it is more likely than not we will be required or we intend to sell the investment before recovery of its amortized cost basis. Allowances for credit losses and write-downs are recognized in interest and other, net and unrealized losses not related to credit losses are recognized in accumulated other comprehensive income (loss).
Credit Risk
Financial instruments that potentially subject us to concentrations of credit risk consist principally of investments in debt instruments, derivative financial instruments, reverse repurchase agreements and trade and other receivables. We generally place investments with high-credit-quality counterparties and, by policy, we limit the amount of credit exposure to any one counterparty based on our analysis of that counterparty's relative credit standing. As required per our investment policy, substantially all of our investments in debt instruments are in investment-grade instruments. Credit-rating criteria for derivative instruments are similar to those for other investments.
We enter into master netting arrangements to mitigate credit risk in derivative transactions by permitting net settlement of transactions with the same counterparty. Due to master netting arrangements, the amounts subject to credit risk related to derivative instruments are generally limited to the amounts, if any, by which the counterparty's obligations exceed our obligations with that counterparty. As of December 27, 2025 and December 28, 2024, our total credit exposure to any single counterparty, excluding money market funds invested in U.S. treasury and U.S. agency securities and reverse repurchase agreements collateralized by treasury and agency securities, did not exceed $5.2 billion and $1.4 billion, respectively. To further reduce credit risk, we enter into collateral security arrangements with certain of our derivative counterparties and obtain and secure collateral from counterparties against obligations, including securities lending transactions when we deem it appropriate. Cash collateral exchanged under our collateral security arrangements is included in other current assets, other long-term assets, other accrued liabilities or other long-term liabilities. For reverse repurchase agreements collateralized by other securities, we do not record the collateral as an asset or a liability unless the collateral is repledged.
A majority of our trade receivables are derived from sales to OEMs and ODMs. We also have accounts receivable derived from sales to industrial and communications equipment manufacturers in the computing and communications industries. We believe the net accounts receivable balances from our three largest customers (47% as of December 27, 2025 and December 28, 2024) do not represent a significant credit risk, based on cash flow forecasts, balance sheet analysis and past collection experience.
We have adopted credit policies and standards intended to accommodate industry growth and inherent risk. We believe credit risks are moderated by the financial stability of our major customers. We assess credit risk through quantitative and qualitative analysis. From this analysis, we establish shipping and credit limits and determine whether we will seek to use one or more credit support protection devices, such as obtaining a parent guarantee, standby letter of credit or credit insurance.
| | | | | | | | | | | |
| Financial Statements | Notes to Consolidated Financial Statements | 69 |
Variable Interest Entities
We have economic interests in entities that are VIEs. If we conclude we are the primary beneficiary of the VIE, we are required to consolidate the entity in our financial statements. To determine if we are the primary beneficiary, we evaluate whether we have the power to direct the activities that most significantly impact the VIE's economic performance and the obligation to absorb losses or the right to receive benefits of the VIE that could potentially be significant to the VIE. Our evaluation includes identification of significant activities and an assessment of our ability to direct those activities based on governance provisions and arrangements to provide services to the VIE. Periodically, we assess whether any changes in our interest or relationship with the entity affect our determination of whether the entity is a VIE and, if so, whether we are the primary beneficiary.
Non-Controlling Interests
Our Consolidated Financial Statements include the accounts of majority-owned subsidiaries consolidated under the variable interest and voting interest models. Non-controlling interests represent the portion of equity not attributable to Intel and are reported as a separate component of equity, net of tax and transaction costs, on our Consolidated Balance Sheets. The classification of non-controlling interests as a component of equity is determined based on the specific rights and obligations associated with the instruments held by minority interest holders. Net income (loss) and comprehensive income (loss) for majority-owned subsidiaries are attributed to Intel and to non-controlling interest holders on our Consolidated Statements of Operations and Consolidated Statements of Comprehensive Income (Loss) based on respective ownership percentages. We account for changes in ownership of our majority-owned subsidiaries as equity transactions when we retain a controlling financial interest.
Business Combinations
We allocate the purchase price paid for assets acquired and liabilities assumed in connection with our acquisitions based on their estimated fair values at the time of acquisition. This allocation involves a number of assumptions, estimates, and judgments in determining the fair value of the following:
▪inventory; property, plant and equipment; pre-existing liabilities or legal claims; and contingent consideration; each as may be applicable;
▪intangible assets, including the valuation methodology, estimations of future cash flows, discount rates, market segment growth rates and our assumed market segment share, as well as the estimated useful life of intangible assets;
▪deferred tax assets and liabilities, uncertain tax positions and tax-related valuation allowances, which are initially estimated as of the acquisition date; and
▪goodwill as measured as the excess of consideration transferred over the net of the acquisition date fair values of the assets acquired and the liabilities assumed.
Our assumptions and estimates are based upon comparable market data and information obtained from our management and the management of the acquired companies. These assumptions and estimates are used to value assets acquired and liabilities assumed, and to allocate goodwill to the reporting units of the business that are expected to benefit from the business combination. During the measurement period, which may be up to one year from the business acquisition date, we may recognize adjustments to the assets acquired, liabilities assumed and related goodwill.
Employee Equity Incentive Plans
We grant service-based RSUs, stock options and performance-based RSUs, called PSUs, which are subject to a combination of service, performance and/or market conditions. We estimate the fair value of RSUs and PSUs with a service or performance condition using the value of our common stock on the date of grant, reduced by the present value of any dividends expected to be paid on our shares of common stock prior to vesting. The fair value of stock option awards with only service and/or performance conditions is estimated on the grant or offering date using the Black-Scholes option-pricing model. The fair value of PSUs with a market condition is estimated using a Monte Carlo simulation model as of the date of grant.
For service-based stock awards, compensation expense is recognized over the service period of the award using the straight-line method. For PSUs with performance or market conditions, compensation expense is recognized ratably for each vesting tranche from the service inception date to the end of the requisite service period. For PSUs that include a performance condition, expense is recognized based on the probable outcome of the performance conditions. For PSUs that contain only a market condition, expense is recognized regardless of whether the market condition is ultimately satisfied. Share-based compensation expense is recognized net of forfeitures.
Under our Employee Stock Purchase Plan (2006 ESPP), eligible employees may purchase common stock at 85% of the fair market value on the last trading day of each six-month offering period. The 15% discount is included in the estimate of fair value as of the offering period start date and recognized as compensation expense over the offering period.
Upon exercise, cancellation, forfeiture or expiration of stock options, or upon vesting or forfeiture of other awards, we eliminate deferred tax assets for awards with multiple vesting dates for each vesting period on a first-in, first-out basis as if each vesting period were a separate award.
| | | | | | | | | | | |
| Financial Statements | Notes to Consolidated Financial Statements | 70 |
For the majority of awards granted, the number of shares of common stock issued on the date the awards vest is net of the minimum statutory withholding requirements that we pay in cash to the appropriate taxing authorities on behalf of our employees. The obligation to pay the relevant taxing authority is contingent upon continued employment. In addition, the amount of the obligation is unknown, as it is based in part on the market price of our common stock when the awards vest.
Income Taxes
We compute the provision for income taxes using the asset and liability method, under which deferred tax assets and liabilities are recognized for the expected future tax consequences of temporary differences between the financial reporting and tax bases of assets and liabilities, and for operating losses and tax credit carryforwards. We measure deferred tax assets and liabilities using the currently enacted tax rates that apply to taxable income in effect for the years in which those tax assets are expected to be realized or settled.
We assess the likelihood that we will be able to recover our deferred tax assets. If recovery is not likely, we must increase our provision for taxes by recording a valuation allowance against the deferred tax assets that we estimate will not ultimately be recoverable. Recovery of a portion of our deferred tax assets is affected by management's plans with respect to holding or disposing of certain investments; therefore, such changes could also affect our future provision for taxes.
We recognize tax benefits from uncertain tax positions only if (based on the technical merits of the position) it is more likely than not that the tax positions will be sustained on examination by the tax authority. The tax benefits recognized in the financial statements from such positions are measured based on the largest amount that is more than 50% likely to be realized upon ultimate settlement. We recognize interest and penalties related to unrecognized tax benefits within the provision for (benefit from) taxes on the Consolidated Statements of Operations.
We recognize the tax impact of including certain foreign earnings in U.S. taxable income as a period cost. We have recognized deferred income taxes for local country income and withholding taxes that could be incurred on distributions of certain non-U.S. earnings or for outside basis differences in our subsidiaries, because we do not plan to indefinitely reinvest such earnings and basis differences. Remittances of non-U.S. earnings are based on estimates and judgments of projected cash flow needs, as well as the working capital and investment requirements of our non-U.S. and U.S. operations. Material changes in our estimates of cash, working capital and investment needs in various jurisdictions could require repatriation of indefinitely reinvested non-U.S. earnings, which could be subject to applicable non-U.S. income and withholding taxes.
Leases
Leases consist of real property and machinery and equipment. Our lease terms may include options to extend or terminate when it is reasonably certain that we will exercise such options. For leases for supplier capacity, we account for the lease and non-lease components as a single lease component. For all other leases, we account for the lease and non-lease components separately and do not include the non-lease components in our leased assets and corresponding liabilities. Payments on leases may be fixed or variable, and variable lease payments are based on output of the underlying leased assets.
Loss Contingencies
We are subject to loss contingencies, including various legal and regulatory proceedings, asserted and potential claims, liabilities related to repair or replacement of parts in connection with product defects, as well as product warranties and potential asset impairments that arise in the ordinary course of business and are subject to change, including due to sudden or rapid developments in proceedings or claims. An estimated loss from such contingencies is recognized as a charge to income if it is probable that a loss has been incurred and the amount of the loss can be reasonably estimated. We evaluate developments that could affect prior disclosures or previously accrued liabilities, and make adjustments as appropriate. Significant judgment is required to determine both likelihood of there being, and the estimated amount of, a loss related to such matters. If one or more of these matters were resolved against us for amounts in excess of management's estimates of losses, our results of operations and financial condition could be materially adversely affected.
Recently Issued Accounting Pronouncements Not Yet Adopted
In November 2024, the Financial Accounting Standards Board (FASB) issued Accounting Standards Update (ASU) 2024-03, "Income Statement—Reporting Comprehensive Income—Expense Disaggregation Disclosures (Subtopic 220-40): Disaggregation of Income Statement Expenses." This ASU is intended to improve transparency by requiring entities to disclose, in the notes to the financial statements, a disaggregation of certain expense categories that are included within the line items presented on the face of the income statement. The standard is effective for our annual reporting period beginning in 2027 and for interim reporting periods beginning in 2028, with early adoption permitted. The standard may be applied either prospectively or retrospectively, with early adoption permitted. We are currently evaluating the timing and method of adoption and assessing the impact of this ASU on the preparation of our financial statement disclosures.
| | | | | | | | | | | |
| Financial Statements | Notes to Consolidated Financial Statements | 71 |
In September 2025, the FASB issued ASU 2025-07, "Derivatives and Hedging (Topic 815) and Revenue from Contracts with Customers (Topic 606): Derivatives Scope Refinements and Scope Clarification for Share-Based Non-cash Consideration from a Customer in a Revenue Contract." This update excludes from derivative accounting non exchange-traded contracts with an underlying based on operations or activities specific to one of the parties to the contract. Additionally, this update clarifies the application of Topic 606 to a contract with share-based non-cash consideration from a customer for the transfer of goods or services. The standard is effective for our annual and interim reporting periods beginning in 2027, with early adoption permitted. The standard may be applied using a prospective or modified retrospective transition approach. We are currently evaluating the timing and method of adoption and assessing the impact of this ASU on our financial statements.
In December 2025, the FASB issued ASU 2025-10, "Government Grants (Topic 832): Accounting for Government Grants Received by Business Entities." This update establishes authoritative guidance on the accounting for government grants received by business entities. The standard is effective for our annual and interim reporting periods beginning in 2029, with early adoption permitted. The standard may be applied using a modified prospective, modified retrospective or full retrospective transition approach. We are currently evaluating the timing and method of adoption and assessing the impact of this ASU on our financial statements.
| | | | | |
| Note 3 : | Operating Segments |
In the first quarter of 2025, we made an organizational change to integrate our NEX business into CCG and DCAI and modified our segment reporting to align to this and certain other business reorganizations. All prior period segment data have been retrospectively adjusted to reflect the way our CODM internally receives information and manages and monitors our operating segment performance starting in fiscal year 2025. Additionally, effective September 12, 2025, we completed the divestiture of 51% of Altera. As of that date, Altera's results of operations are no longer included in our consolidated or segment results. Altera's financial results were included within our "all other" category for all periods presented through September 11, 2025. There are no changes to our Consolidated Financial Statements for any prior periods resulting from our organizational change in the first quarter of 2025 or the Altera transaction, which is further described below.
We organize our business as follows:
▪Intel Products:
▪Client Computing Group (CCG)
▪Data Center and AI (DCAI)
▪Intel Foundry
▪All Other:
▪Mobileye
▪Other
CCG, DCAI and Intel Foundry qualify as reportable operating segments. When we enter into federal contracts, they are aligned to the sponsoring operating segment.
The accounting policies applied to our segments follow those applied to Intel as a whole. A summary of the basis for which we report our operating segment revenues and operating margin is as follows:
Intel Products: CCG and DCAI
▪Segment revenue: consists of revenues from external customers. Our Intel Products operating segments represent most of Intel consolidated revenue and are derived from our principal products that incorporate various components and technologies, including a microprocessor and chipset, a stand-alone SoC, or a multichip package, which are based on Intel architecture.
▪Segment expenses: consists of intersegment charges for product manufacturing and related services from Intel Foundry, external foundry and other manufacturing expenses, product development costs, allocated expenses as described below and direct operating expenses.
Intel Foundry
▪Segment revenue: consists substantially of intersegment product and services revenue for wafer fabrication, substrates and other related products and services sold to Intel Products and certain other Intel internal businesses. We recognize intersegment revenue based on the completion of performance obligations. Product revenue is recognized upon transfer of ownership, which is generally at the completion of wafer sorting. Backend service revenue is recognized upon the completion of assembly and test milestones, which approximates the recognition of revenue over the service period. Intersegment sales are recorded at prices that are intended to approximate market pricing. Intel Foundry also includes certain third-party foundry and assembly and test revenues from external customers that totaled $307 million in 2025, $159 million in 2024 and $547 million in 2023.
▪Segment expenses: consists of direct expenses for technology development, product manufacturing and services provided by Intel Foundry to internal and external customers, allocated expenses as described below and direct operating expenses. Direct expenses for product manufacturing include excess capacity charges, if any.
| | | | | | | | | | | |
| Financial Statements | Notes to Consolidated Financial Statements | 72 |
All Other
Our "all other" category includes the results of operations from other non-reportable segments, including our Mobileye business, our IMS business, start-up businesses that support our initiatives and historical results of operations from divested businesses, including Altera. Effective September 12, 2025, Altera, previously a wholly-owned subsidiary, was deconsolidated from our Consolidated Financial Statements following the closing of the sale of 51% of Altera's issued and outstanding common stock. Altera's financial results of operations were included in our "all other" category through September 11, 2025. As of September 12, 2025, our retained interest in Altera is accounted for as an equity method investment. See "Note 10: Acquisitions and Divestitures" within Notes to Consolidated Financial Statements for further information. The financial results of our "all other" category include intersegment product and services revenue and intersegment expenses primarily between Altera and our Intel Foundry segment during the periods in which we consolidated Altera.
We allocate operating expenses from our sales and marketing group to the Intel Products operating segments and allocate substantially all our operating expenses from our general and administration groups to our reportable operating segments.
We estimate that the substantial majority of our consolidated depreciation expense was incurred by Intel Foundry in 2025, 2024 and 2023. Intel Foundry depreciation expense is substantially included in overhead cost pools and then combined with other costs, and subsequently absorbed into inventory as each product passes through the manufacturing process and is sold to Intel Products or other customers. As a result, it is impracticable to determine the total depreciation expense included as a component of each Intel Products operating segment's operating income (loss).
We do not allocate the following corporate operating expenses to our operating segments:
▪restructuring and other charges;
▪share-based compensation; and
▪certain acquisition-related costs, including amortization and any impairment of acquisition-related intangibles and goodwill.
We do not allocate the following non-operating items to our operating segments:
▪gains and losses from equity investments;
▪interest and other, net; and
▪income taxes.
Our CEO is our CODM. The CODM uses segment revenue and segment operating income (loss) to evaluate each segment's performance and allocate resources. These financial measures are utilized during our budgeting and forecasting process to assess profitability and enable decision making regarding strategic initiatives, capital investments and personnel across all operating segments. Segment operating results regularly reviewed by our CODM also include total cost of sales and operating expenses directly attributable to each segment. Prior to the second quarter of 2025, our CODM regularly reviewed cost of sales and operating expenses, on a discrete basis, attributable to each segment. We have recast prior period segment operating results to reflect the significant segment-level expenses as currently reviewed by our CODM. We centrally manage all procurement, treasury and asset management functions across the enterprise and do not maintain separate balance sheets by segment within our systems of record, nor does our CODM receive total asset information by segment for purposes of assessing segment performance and allocating resources.
Intersegment eliminations: Intersegment sales and related gross profit on inventory recorded at the end of the period or sold through to third-party customers is eliminated for consolidation purposes. The Intel Products operating segments and Intel Foundry are meant to reflect separate fabless semiconductor and foundry companies, respectively. Thus, certain intersegment activity is captured within the intersegment eliminations upon consolidation and presented at the Intel consolidated level. This activity primarily relates to inventory reserves, which are determined and recorded based on our accounting policies for Intel as a whole but are only recorded by the Intel Products operating segments upon transfer of inventory from Intel Foundry. If a reserve is identified that relates to neither Intel Products operating segments nor Intel Foundry, the reserve is recognized as activity within the intersegment eliminations for Intel on a consolidated basis.
| | | | | | | | | | | |
| Financial Statements | Notes to Consolidated Financial Statements | 73 |
Net revenue, cost of sales and operating expenses and operating income (loss) for each annual period presented were as follows:
| | | | | | | | | | | | | | | | | | | | | | | | | | | | | | | | | | | | | | | | | | | | | | | | | | |
| Year Ended (In Millions) | | Dec 27, 2025 |
| | Intel Products | | | | | | | | | | |
| | CCG | | DCAI | | Total Intel Products | | Intel Foundry | | All Other | | Corporate Unallocated | | Intersegment Eliminations | | Total Consolidated |
| Revenue | | $ | 32,228 | | | $ | 16,919 | | | $ | 49,147 | | | $ | 17,826 | | | $ | 3,563 | | | $ | — | | | $ | (17,683) | | | $ | 52,853 | |
Cost of sales and operating expenses | | 22,911 | | | 13,497 | | | 36,408 | | | 28,144 | | | 3,299 | | | 5,518 | | | (18,302) | | | 55,067 | |
Operating income (loss) | | $ | 9,317 | | | $ | 3,422 | | | $ | 12,739 | | | $ | (10,318) | | | $ | 264 | | | $ | (5,518) | | | $ | 619 | | | $ | (2,214) | |
| | | | | | | | | | | | | | | | | | | | | | | | | | | | | | | | | | | | | | | | | | | | | | | | | | |
| Year Ended (In Millions) | | Dec 28, 2024 |
| | Intel Products | | | | | | | | | | |
| | CCG | | DCAI | | Total Intel Products | | Intel Foundry | | All Other | | Corporate Unallocated | | Intersegment Eliminations | | Total Consolidated |
| Revenue | | $ | 33,346 | | | $ | 16,125 | | | $ | 49,471 | | | $ | 17,317 | | | $ | 3,601 | | | $ | — | | | $ | (17,288) | | | $ | 53,101 | |
| Cost of sales and operating expenses | | 21,752 | | | 14,711 | | | 36,463 | | | 30,608 | | | 3,658 | | | 11,177 | | | (17,127) | | | 64,779 | |
| Operating income (loss) | | $ | 11,594 | | | $ | 1,414 | | | $ | 13,008 | | | $ | (13,291) | | | $ | (57) | | | $ | (11,177) | | | $ | (161) | | | $ | (11,678) | |
| | | | | | | | | | | | | | | | | | | | | | | | | | | | | | | | | | | | | | | | | | | | | | | | | | |
| Year Ended (In Millions) | | Dec 30, 2023 |
| | Intel Products | | | | | | | | | | |
| | CCG | | DCAI | | Total Intel Products | | Intel Foundry | | All Other | | Corporate Unallocated | | Intersegment Eliminations | | Total Consolidated |
| Revenue | | $ | 32,305 | | | $ | 15,980 | | | $ | 48,285 | | | $ | 18,504 | | | $ | 5,463 | | | $ | — | | | $ | (18,024) | | | $ | 54,228 | |
Cost of sales and operating expenses | | 22,177 | | | 15,035 | | | 37,212 | | | 25,587 | | | 3,956 | | | 5,199 | | | (17,819) | | | 54,135 | |
Operating income (loss) | | $ | 10,128 | | | $ | 945 | | | $ | 11,073 | | | $ | (7,083) | | | $ | 1,507 | | | $ | (5,199) | | | $ | (205) | | | $ | 93 | |
Corporate Unallocated Expenses
Corporate unallocated expenses include certain operating expenses not allocated to specific operating segments. The nature of these expenses may vary, but primarily consist of restructuring and other charges, share-based compensation and certain acquisition-related costs.
| | | | | | | | | | | | | | | | | | | | |
| Years Ended (In Millions) | | Dec 27, 2025 | | Dec 28, 2024 | | Dec 30, 2023 |
| Share-based compensation | | $ | 2,434 | | | $ | 3,410 | | | $ | 3,229 | |
Restructuring and other charges1 | | 2,191 | | | 6,970 | | | (62) | |
| Acquisition-related costs | | 505 | | | 1,044 | | | 1,407 | |
| | | | | | |
| | | | | | |
| Other | | 388 | | | (247) | | | 625 | |
| Total corporate unallocated expenses | | $ | 5,518 | | | $ | 11,177 | | | $ | 5,199 | |
1 See "Note 7: Restructuring and Other Charges" within Notes to Consolidated Financial Statements for further information.
Concentration of Revenue
In 2025, substantially all of the revenue from our three largest customers was generated from the sale of platforms and other components by our Intel Products operating segments. Our three largest customers accounted for the following percentages of our net revenue:
| | | | | | | | | | | | | | | | | | | | |
Years Ended | | Dec 27, 2025 | | Dec 28, 2024 | | Dec 30, 2023 |
Customer A | | 19 | % | | 19 | % | | 19 | % |
Customer B | | 12 | % | | 14 | % | | 11 | % |
Customer C | | 12 | % | | 12 | % | | 10 | % |
Total percentage of net revenue | | 43 | % | | 45 | % | | 40 | % |
| | | | | | | | | | | |
| Financial Statements | Notes to Consolidated Financial Statements | 74 |
Net revenue by region, based on the billing location of the customer, was as follows:
| | | | | | | | | | | | | | | | | | | | |
| Years Ended (In Millions) | | Dec 27, 2025 | | Dec 28, 2024 | | Dec 30, 2023 |
| United States | | $ | 15,757 | | | $ | 12,994 | | | $ | 13,958 | |
| China | | 12,694 | | | 15,532 | | | 14,854 | |
| | | | | | |
| Singapore | | 9,535 | | | 10,187 | | | 8,602 | |
| Taiwan | | 7,672 | | | 7,804 | | | 6,867 | |
| Other regions | | 7,195 | | | 6,584 | | | 9,947 | |
| Total net revenue | | $ | 52,853 | | | $ | 53,101 | | | $ | 54,228 | |
| | | | | |
| Note 4 : | Non-Controlling Interests |
| | | | | | | | | | | | | | |
| | Non-Controlling Ownership % |
| | Dec 27, 2025 | | Dec 28, 2024 |
| Ireland SCIP | | 49 | % | | 49 | % |
| Arizona SCIP | | 49 | % | | 49 | % |
| Mobileye | | 20 | % | | 12 | % |
| IMS Nanofabrication (IMS Nano) | | 32 | % | | 32 | % |
| | | | | | | | | | | | | | | | | | | | | | | | | | | | | | | | |
| (In Millions) | | Ireland SCIP | | Arizona SCIP | | Mobileye | | IMS Nano | | Total |
Non-controlling interests as of Dec 31, 2022 | | $ | — | | | $ | 874 | | | $ | 989 | | | $ | — | | | $ | 1,863 | |
| Partner contributions | | — | | | 1,511 | | | — | | | — | | | 1,511 | |
| | | | | | | | | | |
| Changes in equity of non-controlling interest holders | | — | | | — | | | 848 | | | 167 | | | 1,015 | |
| Net income (loss) attributable to non-controlling interests | | — | | | (26) | | | 1 | | | 11 | | | (14) | |
Non-controlling interests as of Dec 30, 2023 | | — | | | 2,359 | | | 1,838 | | | 178 | | | 4,375 | |
| Partner contributions | | — | | | 1,702 | | | — | | | — | | | 1,702 | |
| Partner distributions | | (43) | | | — | | | — | | | — | | | (43) | |
| Changes in equity of non-controlling interest holders | | — | | | — | | | 205 | | | — | | | 205 | |
| Net income (loss) attributable to non-controlling interests | | 104 | | | (173) | | | (371) | | | (37) | | | (477) | |
Non-controlling interests as of Dec 28, 2024 | | 61 | | | 3,888 | | | 1,672 | | | 141 | | | 5,762 | |
| Partner contributions | | — | | | 5,108 | | | — | | | — | | | 5,108 | |
| Partner distributions | | (217) | | | — | | | — | | | — | | | (217) | |
| Changes in equity of non-controlling interest holders | | — | | | — | | | 1,133 | | | — | | | 1,133 | |
| Net income (loss) attributable to non-controlling interests | | 268 | | | 110 | | | (57) | | | (28) | | | 293 | |
Non-controlling interests as of Dec 27, 2025 | | $ | 112 | | | $ | 9,106 | | | $ | 2,748 | | | $ | 113 | | | $ | 12,079 | |
Semiconductor Co-Investment Program
Ireland SCIP
In the second quarter of 2024, we closed a transaction with Apollo involving the sale of 49% of our interest in an Irish limited liability company (Ireland SCIP) for net proceeds of $11.0 billion, which increased our capital in excess of par value. We consolidate the results of Ireland SCIP, a VIE, into our Consolidated Financial Statements because we are the primary beneficiary. Generally, distributions will be received from Ireland SCIP based on each investor's respective ownership of Ireland SCIP, of which Intel's is 51%. Ireland SCIP has rights to factory output of an Intel owned wafer fabrication plant in Ireland (Fab 34) and rights to resell the factory output to us. We retain sole ownership of Fab 34 and we are engaged as the Fab 34 operator in exchange for variable payments from Ireland SCIP based on the related factory output.
| | | | | | | | | | | |
| Financial Statements | Notes to Consolidated Financial Statements | 75 |
We are required to substantially complete construction of Fab 34 in accordance with contractual parameters and timelines or we will be required to pay delay-related liquidated damages to Apollo, the other investor, beginning in 2026, not to exceed $1.1 billion in total. As of December 27, 2025 and December 28, 2024, we expected certain construction milestones for Fab 34 would be delayed as we refined our near-term production capacity requirements and related capital outlays relative to those that are required per the Ireland SCIP agreement. As a result, in 2024 we recognized a loss of $755 million within interest and other, net from the change in fair value of the liquidated damage provisions, which qualify as a non-designated derivative we recognized within other accrued liabilities for $179 million and other long-term liabilities for $576 million as of December 27, 2025 ($755 million in other long-term liabilities as of December 28, 2024). Refer to "Note 16: Derivative Financial Instruments" within Notes to Consolidated Financial Statements for additional information. Though we expect certain construction delays in the near term, we intend to complete construction of Fab 34. We will be required to purchase minimum quantities of the related factory output from Ireland SCIP, or we will be subject to certain volume-related damages payable to Ireland SCIP, beginning at the earlier of when construction is complete or the third quarter of 2027.
As of December 27, 2025 and December 28, 2024, other than cash and cash equivalents held by Ireland SCIP, substantially all of the remaining assets and liabilities of Ireland SCIP were eliminated in our Consolidated Balance Sheets.
Arizona SCIP
We consolidate the results of an Arizona limited liability company (Arizona SCIP), a VIE, into our Consolidated Financial Statements because we are the primary beneficiary. Contributions and distributions made between Arizona SCIP and investors are generally made based on our and Brookfield's proportional ownership interest in Arizona SCIP.
We are the primary beneficiary of two new chip factories still partially under construction by Arizona SCIP; we have the right to direct how and for what purpose the underlying assets will be used and to purchase 100% of the wafer output. During the year ended December 27, 2025, Arizona SCIP placed the first tranche of manufacturing assets into service, making the assets available for our use. When the production contract commences in 2026, as the sole operator we will be required to operate Arizona SCIP at minimum production levels and will be required to limit excess inventory held on site or we will be subject to certain volume-related damages payable to Arizona SCIP.
The property, plant and equipment assets owned by Arizona SCIP and included in our Consolidated Balance Sheets as of December 27, 2025, which are not available to us as they can be used only to settle obligations of the VIE, consisted of construction in progress assets of $5.6 billion ($11.5 billion as of December 28, 2024) and assets that have been placed into service of $12.2 billion (none as of December 28, 2024). The remaining assets and liabilities of Arizona SCIP were eliminated in our Consolidated Balance Sheets.
Mobileye
We consolidate our majority owned subsidiary Mobileye pursuant to the voting interest model. In 2025, we converted 113.7 million of our Mobileye Class B shares into Class A shares. We subsequently sold 57.5 million of the Class A shares in a secondary offering, representing 7% of Mobileye's outstanding capital stock, for $16.50 per share and received net proceeds of $921 million. Concurrently, Mobileye repurchased from us 6.2 million of the Class A Shares for $16.50. As of December 27, 2025, we continue to hold the remaining 50.0 million Mobileye Class A shares from the conversion, in addition to our remaining Mobileye Class B shares. As we will continue to consolidate the results of Mobileye, the impact of their share repurchase was eliminated in our Consolidated Financial Statements. In the third quarter of 2024, the non-cash impairment of goodwill related to our Mobileye reporting unit was attributed to Intel and to non-controlling interest holders based on our proportional ownership (see "Note 11: Goodwill" within Notes to Consolidated Financial Statements).
IMS Nanofabrication
In 2023, we closed agreements to sell a combined 32% minority stake in our IMS business, which is part of our "all other" category. We continue to consolidate IMS results as a majority owned subsidiary pursuant to the voting interest model into our Consolidated Financial Statements.
| | | | | | | | | | | |
| Financial Statements | Notes to Consolidated Financial Statements | 76 |
| | | | | |
| Note 5 : | Earnings (Loss) Per Share and Stockholders' Equity |
We computed basic earnings (loss) per share of common stock based on the weighted average number of shares of common stock outstanding during the period. We computed diluted earnings (loss) per share of common stock based on the weighted average number of shares of common stock outstanding plus potentially dilutive shares of common stock outstanding during the period, if applicable.
| | | | | | | | | | | | | | | | | | | | |
| Years Ended (In Millions, Except Per Share Amounts) | | Dec 27, 2025 | | Dec 28, 2024 | | Dec 30, 2023 |
| Net income (loss) | | $ | 26 | | | $ | (19,233) | | | $ | 1,675 | |
| Less: net income (loss) attributable to non-controlling interests | | 293 | | | (477) | | | (14) | |
| Net income (loss) attributable to Intel | | $ | (267) | | | $ | (18,756) | | | $ | 1,689 | |
Weighted average shares of common stock outstanding—basic1 | | 4,530 | | | 4,280 | | | 4,190 | |
Dilutive effect of employee equity incentive plans and stock issuances | | — | | | — | | | 22 | |
| Weighted average shares of common stock outstanding—diluted | | 4,530 | | | 4,280 | | | 4,212 | |
| Earnings (loss) per share attributable to Intel—basic | | $ | (0.06) | | | $ | (4.38) | | | $ | 0.40 | |
Earnings (loss) per share attributable to Intel—diluted | | $ | (0.06) | | | $ | (4.38) | | | $ | 0.40 | |
1 For the year ended December 27, 2025, we have included the weighted average impacts of Escrowed Shares that are not contingently issuable. Refer to additional discussion under the U.S. Government Agreements section below.
Potentially dilutive shares of common stock from employee equity incentive plans and stock issuances are determined by applying the treasury stock method to the assumed exercise of outstanding stock options, the assumed vesting of outstanding RSUs, and the assumed issuance of common stock under the stock purchase plan.
The dilutive impact from the assumed issuance of common stock associated with contractual transactions, including the release of Escrowed Shares under the Secure Enclave program (defined below), that settled during the year ended December 27, 2025 is determined from the date of the agreement or the beginning of the period (whichever is later) to the date the Escrowed Shares are released or to the date the transaction closes. We reflect these contractual transactions, including the Escrowed Shares, in the calculation of diluted EPS using the treasury stock method.
For the years ended December 27, 2025 and December 28, 2024, the assumed exercise of outstanding stock options, the assumed vesting of outstanding RSUs, the assumed issuance of common stock under the stock purchase plan, and the assumed issuance of common stock associated with equity issuance agreements, including Escrowed Shares released, and a contractual conversion feature, as applicable, had an anti-dilutive effect on diluted loss per share and were excluded from the computation of diluted loss per share. For the year ended December 27, 2025, 153 million anti-dilutive shares (114 million in 2024) were excluded from the computation of diluted earnings (loss) per share. In 2023, securities that would have been anti-dilutive were insignificant.
Equity Issuances
Private Placement Share Sale to SoftBank Group
On August 18, 2025, we entered into an agreement to issue and sell 87 million shares of our common stock to SoftBank Group at $23.00 per share, representing an aggregate cash purchase price of $2.0 billion. The issuance and sale of the shares was completed on September 26, 2025.
U.S. Government Agreements
On August 22, 2025, we entered into the U.S. Government Agreement with the DOC. Pursuant to the terms of the U.S. Government Agreement, the Federal Government of the United States of America (U.S. government) agreed to make disbursements to us consisting of (1) the acceleration of certain disbursements under an amendment to our November 2024 Direct Funding Agreement (DFA) under the CHIPS and Science Act of 2022 (CHIPS Act) with the DOC in the amount of $5.7 billion and (2) $3.2 billion of disbursements in respect of our existing agreement with the U.S. government under the CHIPS Act Secure Enclave program (Secure Enclave) to be made as we perform on our commitments pursuant to the terms and conditions of Secure Enclave. As compensation to the U.S. government for, and as a condition to the DOC's willingness to permit, the disbursements, the company agreed to issue to the DOC: (i) up to 433 million shares of our common stock, of which 275 million would be issued on the closing date (Common Stock Issuance) and 159 million would be issued into escrow to be released as disbursements are received by us under Secure Enclave (Escrowed Shares); and (ii) warrants exercisable to purchase up to 241 million shares of our common stock at $20.00 per share (Warrants) if we were to cease to directly or indirectly own at least 51% of our foundry business (Warrant Condition). The DOC also agreed that to the maximum extent permissible under applicable law, our obligations pursuant to the DFA would be considered discharged, other than with respect to Secure Enclave. The U.S. government agreed to make the disbursements in respect of, and on the terms and conditions of, Secure Enclave and agreed to work with us to make appropriate amendments and modifications to the DFA to release us from certain of its obligations.
On August 27, 2025, the closing of the transactions contemplated by the U.S. Government Agreement occurred. On such date:
▪we and the DOC entered into an amendment to the DFA that, among other things, removed the prior project milestone requirements and certain other conditions to disbursements under the DFA;
| | | | | | | | | | | |
| Financial Statements | Notes to Consolidated Financial Statements | 77 |
▪we received from the DOC the $5.7 billion of remaining potential disbursements under the DFA;
▪we issued to the DOC the 275 million share Common Stock Issuance;
▪we issued to the DOC the Warrants to purchase up to 241 million shares of our common stock, subject to anti-dilution adjustments for dividends, distributions, subdivisions, combinations or reclassifications; and
▪we issued into escrow the 159 million Escrowed Shares for the benefit of the DOC to be released as the company performs, invoices and receives disbursements from the U.S. government under Secure Enclave.
The Escrowed Shares will be released from escrow as and when Secure Enclave disbursements are received by us for our performance under Secure Enclave, with the number of Escrowed Shares to be issued with respect to each Secure Enclave disbursement being determined based on $20.00 per share. To the extent any Escrowed Shares have not been released from escrow at the end of the period during which we are eligible for Secure Enclave disbursements, half of any remaining Escrowed Shares will be released from escrow to the DOC at such time with no additional consideration payable to us, with the other half of the remaining Escrowed Shares automatically forfeited and cancelled.
In Q3 2025, we received $5.7 billion from the DOC and attributed the proceeds to the issuance of three freestanding instruments: the issuance of 275 million shares of common stock, the issuance of Warrants to purchase 241 million shares and the issuance of 159 million Escrowed Shares. We concluded that the common stock and Warrants should be classified within permanent equity. We classified the Escrowed Shares as a derivative liability, which was recorded at fair value at inception with subsequent changes in fair value recorded through interest and other, net within our Consolidated Statements of Operations. Accordingly, we allocated the $5.7 billion in cash proceeds received at the closing date to the derivative liability for the Escrowed Shares at fair value, with the remaining proceeds allocated to common stock and Warrants based on their relative fair values.
As disclosed within our Q3 2025 Form 10-Q, our accounting for the U.S. Government Agreement was complex and, as such, we voluntarily initiated an accounting consultation with the staff of the SEC. Due to the U.S. government shutdown, we were unable to conclude our consultation with the staff prior to our Q3 2025 Form 10-Q filing deadline. In December 2025, the staff completed its review of our accounting position and informed us that they objected to a component of our accounting treatment. Specifically, the SEC objected to our position that receipts from the U.S. government under the Secure Enclave program received subsequent to the U.S. Government Agreement should be accounted for as a government grant. Accordingly, we have revised our accounting during the fourth quarter of 2025 such that cash received under the Secure Enclave program is accounted for as proceeds from the issuance of equity in our Consolidated Financial Statements. As a result, the fair value of the derivative liability for the Escrowed Shares as of December 27, 2025 of $2.7 billion has factored in the present value of expected future disbursements under Secure Enclave, whereas it did not as of September 27, 2025. The remainder of the $5.7 billion in proceeds received in Q3 2025 has been allocated on a relative fair value basis to the common stock and Warrants. If we were to have applied our revised accounting position to the Consolidated Condensed Financial Statements as of September 27, 2025, the impact would be a decrease of $3.0 billion to total liabilities and an increase of $3.0 billion to total stockholders’ equity on the Consolidated Condensed Balance Sheet.
Based on an analysis of quantitative and qualitative factors in accordance with Accounting Standard Codification (ASC) Topic 250, "Accounting Changes and Error Corrections", including ASC Topic 250-10-S99-1 (SAB Topic 1.M), "Assessing Materiality", we concluded that these revisions would be immaterial, individually and in the aggregate, to the Consolidated Condensed Financial Statements as presented in the Quarterly Report on Form 10-Q as of and for the three and nine-months ended September 27, 2025, as filed on November 6, 2025.
During 2025, we recognized $1.8 billion related to the net change in fair value of both Escrowed Shares released and Escrowed Shares still held in escrow at December 27, 2025. The fair value of the Escrowed Shares derivative liability was $2.7 billion at December 27, 2025, which we have recognized within other accrued liabilities and other long-term liabilities. During 2025, we released 3 million Escrowed Shares, which we recognized as issuances of common stock upon our receipt of cash proceeds for our performance under Secure Enclave. The 78 million Escrowed Shares that were not contingently issuable based on the terms of the U.S. Government Agreement have been included in our computation of basic EPS for the year ended December 27, 2025. The remaining 78 million Escrowed Shares are contingently issuable based on the DOC's disbursements under Secure Enclave and therefore they are excluded from basic and diluted EPS until the contingencies are met. Potentially dilutive shares issuable under the Warrant have been excluded from all basic and diluted EPS calculations for the year ended December 27, 2025 as the Warrants are neither currently nor expected to become exercisable.
The $2.3 billion previously received under the DFA and Secure Enclave programs prior to the U.S. Government Agreement date remains subject to our government grant accounting policy. See “Note 6: Other Financial Statement Details” within Notes to Consolidated Financial Statements for additional information.
Private Placement Share Sale to NVIDIA
On September 15, 2025, we entered into an agreement to issue and sell 215 million shares of our common stock to NVIDIA at a price of $23.28 per share, representing an aggregate cash purchase price of $5.0 billion. The issuance and sale of the shares was completed on December 26, 2025.
| | | | | | | | | | | |
| Financial Statements | Notes to Consolidated Financial Statements | 78 |
| | | | | |
| Note 6 : | Other Financial Statement Details |
Restricted Cash
We have $447 million of restricted cash included in other long-term assets within the Consolidated Balance Sheets as of December 27, 2025 and included within cash, cash equivalents, and restricted cash in the Consolidated Statements of Cash Flows. The restricted cash serves as collateral for third party arrangements we entered into and is considered legally restricted due to limitations on usage and withdrawal.
Accounts Receivable
We sell certain of our accounts receivable on a non-recourse basis to third-party financial institutions. We record these transactions as sales of receivables and present cash proceeds as cash provided by operating activities in the Consolidated Statements of Cash Flows. Accounts receivable sold under non-recourse factoring arrangements were $2.6 billion during 2025, $2.3 billion during 2024 and $2.0 billion during 2023. After the sale of our accounts receivable, we expect to collect payment from the customers and remit it to the third-party financial institution.
Inventories
| | | | | | | | | | | | | | |
(In Millions) | | Dec 27, 2025 | | Dec 28, 2024 |
| Raw materials | | $ | 993 | | | $ | 1,344 | |
| Work in process | | 7,840 | | | 7,432 | |
| Finished goods | | 2,785 | | | 3,422 | |
| Total inventories | | $ | 11,618 | | | $ | 12,198 | |
Property, Plant and Equipment
| | | | | | | | | | | | | | |
(In Millions) | | Dec 27, 2025 | | Dec 28, 2024 |
| Land and buildings | | $ | 65,395 | | | $ | 56,544 | |
| Machinery and equipment | | 111,940 | | | 103,150 | |
| Construction in progress | | 34,543 | | | 50,418 | |
Total property, plant and equipment, gross | | 211,878 | | | 210,112 | |
| Less: Accumulated depreciation | | (106,464) | | | (102,193) | |
Total property, plant and equipment, net | | $ | 105,414 | | | $ | 107,919 | |
Our depreciable property, plant and equipment assets are depreciated over the following estimated useful lives: machinery and equipment, 3 to 8 years; and buildings, 10 to 25 years.
We invest in and deploy manufacturing assets in response to manufacturing capacity requirements based upon short- and long-term demand forecasts and economic returns relative to capital outlays. We regularly monitor, evaluate and adjust our manufacturing capacity footprint in response to a number of volatile factors that impact our business, including demand for our products and services and the state of the semiconductor industry as a whole. In connection with the preparation of our Consolidated Financial Statements for the second quarter of 2025 and the third quarter of 2024, we evaluated our current process technology node capacities relative to projected market demand for our products and services, and concluded that our manufacturing asset portfolio exceeded manufacturing capacity requirements. Upon performing a re-use assessment, we impaired and accelerated depreciation for certain manufacturing assets. In 2025, we recorded non-cash impairments and accelerated depreciation charges of $494 million and $456 million, respectively, all of which were recognized in cost of sales within our Intel Foundry operating segment. In 2024, we recorded non-cash impairments and accelerated depreciation charges of $2.3 billion and $992 million, respectively, substantially all of which were recognized in cost of sales within our Intel Foundry operating segment.
We also incurred certain other non-cash asset impairment charges of $474 million in 2025 and $442 million in 2024 as a direct result of the 2025 and 2024 Restructuring Plans (see "Note 7: Restructuring and Other Charges" within Notes to Consolidated Financial Statements). These charges were excluded from segment results and included as a component of "corporate unallocated expenses" within the restructuring and other category presented in "Note 3: Operating Segments" within Notes to Consolidated Financial Statements.
We negotiate extended payment terms of greater than 90 days with certain of our capital vendors, which are reported as financing activities in the Consolidated Statements of Cash Flows when paid. Unpaid amounts related to the acquisition of property, plant and equipment in 2025 and 2024 under such extended payment terms, included in accounts payable and other accrued liabilities, totaled $1.5 billion and $3.2 billion, respectively.
| | | | | | | | | | | |
| Financial Statements | Notes to Consolidated Financial Statements | 79 |
Property, plant and equipment, net, by country at the end of each period was as follows:
| | | | | | | | | | | | | | | | |
(In Millions) | | Dec 27, 2025 | | Dec 28, 2024 | | |
| United States | | $ | 71,158 | | | $ | 72,068 | | | |
| Ireland | | 17,120 | | | 18,152 | | | |
| Israel | | 10,620 | | | 10,414 | | | |
| | | | | | |
| Other countries | | 6,516 | | | 7,285 | | | |
Total property, plant and equipment, net | | $ | 105,414 | | | $ | 107,919 | | | |
Government Incentives
We enter into government incentive arrangements with local, regional and national governments, both U.S. and non-U.S. These arrangements vary in size, duration and conditions and allow us to maintain a market-comparable foothold across various geographies. These incentives are primarily structured as cash grants and refundable tax credits. Capital-related incentives have terms of up to 15 years and operating-related incentives have terms that can vary widely. We are eligible to receive these incentives because we engage in qualifying capital investments, R&D and other activities as defined by the relevant government entities. These include qualifying capital investments for semiconductor wafer and advanced packaging manufacturing facilities construction and acquisition of equipment. Each incentive requires that we comply with certain conditions for a period that may exceed the incentive terms. These conditions can include achievement of future operational targets and committing to minimum levels of capital investment. If conditions are not satisfied, the incentives may be subject to reduction, recapture or termination.
Capital-related incentives reduced gross property, plant and equipment by $16.1 billion as of December 27, 2025 ($9.5 billion as of December 28, 2024), of which $6.7 billion was recognized in 2025 ($4.1 billion in 2024). Capital-related incentives reduced depreciation expense by $1.0 billion in 2025, of which the substantial majority reduced cost of sales ($594 million in 2024 and $226 million in 2023).
Of the $6.7 billion of capital-related incentives recognized in 2025, $5.4 billion was comprised of tax credits attributable to the U.S. Advanced Manufacturing Investment Credit ($2.6 billion in 2024), which may be refunded to us in cash to the extent the credits exceed our outstanding income tax liabilities. Additionally, in 2025, we recognized $769 million of CHIPS Act capital-related incentives ($1.0 billion in 2024), $123 million of capital grants related to two new leading-edge chip factories in Ohio ($115 million in 2024 related to modernization and expansion of chip factories in Oregon), and $323 million of non-U.S. government capital grants and refundable tax credits ($384 million in 2024).
Operating-related incentives, including those recognized under the CHIPS Act, benefited operating income by $529 million in 2025, the substantial majority of which was recorded in cost of sales ($442 million in 2024 and $202 million in 2023, in each case a majority of which was recorded in cost of sales).
As of August 27, 2025, the date the DFA was materially modified, we had received and recorded $2.3 billion in U.S. government incentives under the CHIPS Act and those amounts were accounted for pursuant to our grant accounting policy. In September 2024, we were awarded up to $3.0 billion in direct funding for the Secure Enclave program to expand the trusted manufacturing of leading-edge semiconductors for the U.S. government. In the second quarter of 2025, the award was increased to $3.3 billion. As a result of the U.S. Government Agreement entered into in August 2025, as further described in "Note 5: Earnings (Loss) Per Share and Stockholders' Equity" within Notes to Consolidated Financial Statements, Secure Enclave proceeds received after the U.S. Government Agreement's effective date are being attributed as equity and will not be subject to our grant accounting policy.
Of our total capital-related government incentives recognized in 2025, $6.1 billion was recognized as a non-cash investing activity within the Consolidated Statements of Cash Flows ($3.3 billion in 2024 and $1.1 billion in 2023). A portion of our capital-related incentives will be collected in cash while a portion may be settled as credits for tax payments due.
The amounts recorded on the Consolidated Balance Sheets related to grants receivable and capital-related refundable tax credits for each period were as follows:
| | | | | | | | | | | | | | | | | | | | |
(In Millions) | | Location | | Dec 27, 2025 | | Dec 28, 2024 |
Operating-related grants receivables | | Other current assets | | $ | 45 | | | $ | 272 | |
| | Other long-term assets | | $ | 262 | | | $ | 186 | |
Capital-related grants receivables | | Other current assets | | $ | 57 | | | $ | 859 | |
| | Other long-term assets | | $ | 288 | | | $ | 374 | |
| Capital-related refundable tax credits | | Other current assets | | $ | 7,549 | | | $ | 2,099 | |
| | | | | | |
Advertising
Advertising costs, including direct marketing, are expensed as incurred and recorded within MG&A expenses. Advertising costs were $610 million in 2025 ($856 million in 2024 and $950 million in 2023).
| | | | | | | | | | | |
| Financial Statements | Notes to Consolidated Financial Statements | 80 |
Interest and Other, Net
| | | | | | | | | | | | | | | | | | | | | |
| Years Ended (In Millions) | | Dec 27, 2025 | | Dec 28, 2024 | | Dec 30, 2023 | |
| Interest income | | $ | 1,007 | | | $ | 1,245 | | | $ | 1,335 | | |
| Interest expense | | (1,091) | | | (1,034) | | | (878) | | |
| Gain (loss) on mark-to-market of Escrowed Shares | | (1,796) | | | — | | | — | | |
| Gain on divestiture of Altera | | 5,553 | | | — | | | — | | |
| Other, net | | (416) | | | 15 | | | 172 | | |
| Total interest and other, net | | $ | 3,257 | | | $ | 226 | | | $ | 629 | | |
Interest expense is net of $1.2 billion of interest capitalized in 2025 ($1.5 billion in 2024 and 2023).
Gain (loss) on mark-to-market of Escrowed Shares related to changes in fair value of the derivative liability for the Escrowed Shares (refer to "Note 5: Earnings (Loss) Per Share and Stockholders' Equity" within Notes to Consolidated Financial Statements).
Gain on divestiture of Altera is related to the sale of 51% of the Altera business for which we recorded a pretax gain of $5.6 billion (refer to "Note 10: Acquisitions and Divestitures" within Notes to Consolidated Financial Statements).
Other, net in 2025 included charges of $229 million related to the sale of our NAND memory business (refer to "Note 10: Acquisitions and Divestitures" within Notes to Consolidated Financial Statements); and in 2024 included a $755 million loss from the change in fair value of a derivative liability related to Ireland SCIP and $560 million of interest received and recognized as a benefit in relation to the EC competition matter.
| | | | | |
| Note 7 : | Restructuring and Other Charges |
| | | | | | | | | | | | | | | | | | | | |
| Years Ended (In Millions) | | Dec 27, 2025 | | Dec 28, 2024 | | Dec 30, 2023 |
| Employee severance and benefit arrangements | | $ | 1,790 | | | $ | 2,481 | | | $ | 222 | |
| Litigation charges and other | | (121) | | | 858 | | | (329) | |
| Asset impairment charges | | 522 | | | 3,631 | | | 45 | |
| Total restructuring and other charges | | $ | 2,191 | | | $ | 6,970 | | | $ | (62) | |
In the second quarter of 2025, we announced and commenced the 2025 Restructuring Plan, which was subsequently approved and committed to by our management. This initiative is intended to lower expenses, streamline our organizational structure and reduce management layers across functions while reallocating resources toward our core client and server businesses by reducing lower-priority programs and initiatives. Restructuring charges are primarily comprised of employee severance and benefit arrangements, non-cash asset impairment and accelerated depreciation charges resulting from exit activities, as well as impairment charges relating to real estate exits and consolidations. These charges were excluded from our operating segments' results and included as "corporate unallocated expenses" within the restructuring and other charges category presented in "Note 3: Operating Segments" within Notes to Consolidated Financial Statements. The cumulative cost of the 2025 Restructuring Plan as of December 27, 2025 was $2.0 billion. Any changes to our estimates or timing will be reflected in our results of operations in future periods. We expect to recognize total charges of approximately $2.2 billion under the 2025 Restructuring Plan. A substantial majority of actions pursuant to the 2025 Restructuring Plan were completed in the fourth quarter of 2025 with the remainder expected to be completed in 2026.
In the third quarter of 2024, the 2024 Restructuring Plan was announced and a series of cost and capital reduction initiatives were implemented. We have incurred total charges of approximately $3.1 billion under the 2024 Restructuring Plan, which is expected to be completed in 2026.
In the third quarter of 2022, the 2022 Restructuring Program was approved to rebalance our workforce and operations. We have incurred total charges of approximately $1.3 billion under the 2022 Restructuring Program, which was complete in the first quarter of 2024.
Employee severance and benefit arrangements includes net charges relating to the 2025 Restructuring Plan of $1.5 billion and 2024 Restructuring Plan and other actions of $281 million in 2025. Charges accrued as of December 27, 2025 and December 28, 2024, were recorded as current liabilities within accrued compensation and benefits on the Consolidated Balance Sheets.
| | | | | | | | | | | |
| Financial Statements | Notes to Consolidated Financial Statements | 81 |
Restructuring activities related to employee severance and benefit arrangements under the 2025, 2024 and 2022 Restructuring Plans were as follows:
| | | | | | | | | | | | | | | | | | | | |
| (In Millions) | | 2025 Restructuring
Program | | 2024 Restructuring
Program | | 2022 Restructuring
Program |
| Accrued balance as of December 31, 2022 | | $ | — | | | $ | — | | | $ | 873 | |
| Accruals and adjustments | | — | | | — | | | 222 | |
| Cash payments | | — | | | — | | | (1,013) | |
| Accrued balance as of December 30, 2023 | | — | | | — | | | 82 |
| Accruals and adjustments | | — | | | 2,306 | | | — | |
| Cash payments | | — | | | (2,004) | | | (82) | |
| Accrued balance as of December 28, 2024 | | — | | | 302 | | — | |
| Accruals and adjustments | | 1,450 | | | 265 | | | — | |
| Cash payments | | (1,033) | | | (541) | | | — | |
| Accrued balance as of December 27, 2025 | | $ | 417 | | | $ | 26 | | | $ | — | |
Litigation charges and other includes a $163 million benefit recorded in 2025 from the reduction of the previously accrued EC-imposed fine recorded in 2023. While the fine remains unpaid on appeal, our obligation is guaranteed by a third party. We funded the guarantee in 2025 by depositing $340 million in legally restricted accounts, for which the restricted cash is presented within other long-term assets. The 2024 charges include $780 million arising out of the R2 litigation. In 2023, a $1.2 billion benefit was recorded due to a reduction in a previously accrued charge as a result of developments in the VLSI litigation. The 2023 charges also included a $353 million termination fee in connection with our inability to timely obtain required regulatory approvals needed to acquire Tower in accordance with the contractual terms of the terminated acquisition agreement and a $401 million charge for the original EC-imposed fine. Refer to "Note 19: Commitments and Contingencies" within Notes to Consolidated Financial Statements for further information on the EC fine and VLSI litigation developments. Refer to "Note 19: Commitments and Contingencies" within the 2024 Form 10-K for more information on the R2 litigation.
Asset impairment charges in 2025 primarily included $474 million of non-cash charges associated with the 2025 and 2024 Restructuring Plans resulting from the exit of certain non-core lines of business, recorded within property, plant and equipment, net on the Consolidated Balance Sheets, and $48 million relating to certain leased assets that were recorded within other long-term assets as of December 27, 2025. The asset impairment charges in 2024 included non-cash charges associated with the 2024 Restructuring Plan, including $442 million of non-cash impairments of construction-in-progress assets associated with our decision to exit and outsource manufacturing capabilities for certain internal test hardware; and $103 million of non-cash impairments of operating leased assets and related leasehold improvements resulting from real estate consolidations and exits. Real estate consolidations and exits did not significantly change our operating lease liabilities and may result in future cash outlays for facility restoration or the relocation of operations. These impairments were recorded within property, plant and equipment, net except for the impairment of operating leased assets of $83 million that were recorded within other long-term assets on the Consolidated Balance Sheet as of December 28, 2024.
In addition, we recorded non-cash goodwill impairment charges of $3.0 billion in 2024 (see "Note 11: Goodwill" within Notes to Consolidated Financial Statements). Further, as a result of a decline in the actual and projected undiscounted cash flows for certain acquired intangible assets, we concluded the assets were not recoverable and recognized a non-cash impairment charge of $108 million in 2024.
| | | | | | | | | | | |
| Financial Statements | Notes to Consolidated Financial Statements | 82 |
Provision for (Benefit From) Taxes
| | | | | | | | | | | | | | | | | | | | |
| Years Ended ($ In Millions) | | Dec 27, 2025 | | Dec 28, 2024 | | Dec 30, 2023 |
Income (losses) before taxes: | | | | | | |
U.S. | | $ | (3,231) | | | $ | (13,450) | | $ | (4,749) |
Non-U.S. | | 4,788 | | | 2,241 | | 5,511 |
| Total income before taxes | | $ | 1,557 | | | $ | (11,210) | | $ | 762 |
| Provision for (benefit from) taxes: | | | | | | |
| Current: | | | | | | |
| Federal | | $ | 310 | | | $ | 600 | | $ | 538 |
| State | | (18) | | | (8) | | 23 |
Non-U.S. | | 910 | | | 1,364 | | 535 |
| Total current provision for (benefit from) taxes | | 1,202 | | | 1,956 | | 1,096 |
| Deferred: | | | | | | |
| Federal | | 245 | | | 6,192 | | (2,048) |
| State | | (11) | | | 67 | | (21) |
Non-U.S. | | 95 | | | (192) | | 60 |
| Total deferred provision for (benefit from) taxes | | 329 | | | 6,067 | | (2,009) |
| Total provision for (benefit from) taxes | | $ | 1,531 | | | $ | 8,023 | | $ | (913) |
| Effective tax rate | | 98.3 | % | | 71.6 | % | | (119.8) | % |
| | | | | | | | | | | |
| Financial Statements | Notes to Consolidated Financial Statements | 83 |
We adopted ASU 2023-09 "Income Taxes (Topic 740): Improvements To Income Tax Disclosures" on a prospective basis beginning with the year ended December 27, 2025. The following table presents required disclosure pursuant to ASU 2023-09 and reconciles the U.S. federal statutory tax amount and rate to our actual global effective amount and rate for the year ended December 27, 2025:
| | | | | | | | | | | | | | |
| | Dec 27, 2025 |
| Year Ended ($ In Millions) | | Amount | | Percent |
| U.S. federal statutory tax | | $ | 327 | | | 21.0 | % |
| State and local income tax, net of federal income tax effect | | (23) | | | (1.5) | % |
| Foreign tax effects: | | | | |
| China: | | | | |
| Withholding tax | | 314 | | | 20.2 | % |
| Other adjustments | | (51) | | | (3.3) | % |
| Other foreign jurisdictions | | (205) | | | (13.2) | % |
| Effects of cross-border tax laws: | | | | |
| Subpart F income inclusion | | 248 | | | 15.9 | % |
| Foreign tax credit | | (707) | | | (45.4) | % |
| Other | | 145 | | | 9.3 | % |
| Tax credits: | | | | |
| Research and development credit | | (977) | | | (62.7) | % |
| Changes in valuation allowances | | 2,629 | | | 168.9 | % |
| Nontaxable or nondeductible items: | | | | |
| Share-based compensation | | 120 | | | 7.7 | % |
| Altera divestiture and deconsolidation | | (1,357) | | | (87.2) | % |
| Mark to market on equity securities | | 377 | | | 24.2 | % |
| Other | | 97 | | | 6.2 | % |
| Changes in unrecognized tax benefits | | 334 | | | 21.5 | % |
| Other adjustments | | 260 | | | 16.7 | % |
| Global effective tax | | $ | 1,531 | | | 98.3 | % |
The following table presents the required disclosures prior to our adoption of ASU 2023-09 and reconciles the U.S. federal statutory income tax rate to the actual global effective income tax rate for the years ended December 28, 2024 and December 30, 2023:
| | | | | | | | | | | | | | | |
Years Ended | | | Dec 28, 2024 | | Dec 30, 2023 |
Expected provision (benefit) at statutory federal income tax rate | | | (21.0) | % | | 21.0 | % |
| Increase (reduction) in rate resulting from: | | | | | |
Federal valuation allowance | | | 93.2 | | | — | |
Goodwill impairment | | | 2.1 | | | — | |
Share-based compensation | | | 4.2 | | | 34.3 | |
| Unrecognized tax benefits and settlements | | | 1.3 | | | 16.3 | |
Non-U.S. income taxed at different rates | | | (5.3) | | | (60.6) | |
| Research and development tax credits | | | (5.6) | | | (99.0) | |
Foreign derived intangible income benefit | | | — | | | (25.1) | |
Restructuring of certain non-U.S. subsidiaries | | | — | | | (15.8) | |
Non-deductibility of European Commission fine | | | — | | | 11.1 | |
| | | | | |
| Other | | | 2.7 | | | (2.0) | |
| Effective tax rate | | | 71.6 | % | | (119.8) | % |
On July 4, 2025, the One Big Beautiful Bill Act (Act) was signed into law. The Act makes permanent key elements of the Tax Cuts and Jobs Act, including 100 percent bonus depreciation, domestic research cost expensing, increases the AMIC to 35 percent from 25 percent and makes modifications to the international tax framework. The Act includes multiple effective dates, with certain provisions effective in 2025 and others phased in through 2027. We continue to evaluate the impact of the Act's provisions that take effect in future years.
| | | | | | | | | | | |
| Financial Statements | Notes to Consolidated Financial Statements | 84 |
As noted in the 2025 rate reconciliation above, we derive the effective tax rate benefit, or detriment, attributed to non-U.S. income taxed at different rates primarily from our operations in China, among others. We are subject to reduced tax rates in Israel and Malaysia as long as we conduct certain eligible activities and make certain capital investments. We have conditional reduced tax rates that expire at various dates through 2056, and we expect to apply for renewals upon expiration, if available. In 2025, the tax benefit specifically attributable to tax holidays was $79 million ($67 million in 2024 and $129 million in 2023) with a $0.02 benefit to diluted EPS ($0.02 in 2024 and $0.03 in 2023).
Deferred and Current Income Taxes
Deferred income taxes reflect the net tax effects of temporary differences between the carrying amounts of assets and liabilities for financial reporting purposes and the amounts for income tax purposes. Significant components of our deferred tax assets and liabilities at the end of each period were as follows:
| | | | | | | | | | | | | | |
(In Millions) | | Dec 27, 2025 | | Dec 28, 2024 |
| Deferred tax assets: | | | | |
| R&D expenditures capitalization | | $ | 12,203 | | | $ | 10,709 | |
| State credits and net operating losses | | 3,165 | | | 2,830 | |
| Inventory | | 628 | | | 1,054 | |
| Accrued compensation and other benefits | | 921 | | | 970 | |
| Share-based compensation | | 481 | | | 444 | |
| Litigation charge | | 320 | | | 447 | |
| Other, net | | 1,547 | | | 1,510 | |
| Gross deferred tax assets | | 19,265 | | | 17,964 | |
| Valuation allowance | | (16,402) | | | (13,974) | |
| Total deferred tax assets | | 2,863 | | | 3,990 | |
| Deferred tax liabilities: | | | | |
Property, plant and equipment | | (3,294) | | | (4,063) | |
| Licenses and intangibles | | (466) | | | (159) | |
| | | | |
| Unrealized gains on investments and derivatives | | (168) | | | (224) | |
| | | | |
| Other, net | | (51) | | | (403) | |
| Total deferred tax liabilities | | (3,979) | | | (4,849) | |
| Net deferred tax assets (liabilities) | | $ | (1,116) | | | $ | (859) | |
| | | | |
| Reported as: | | | | |
| Deferred tax assets | | $ | 570 | | | $ | 603 | |
| Deferred tax liabilities | | (1,686) | | | (1,462) | |
| Net deferred tax assets (liabilities) | | $ | (1,116) | | | $ | (859) | |
Changes in the valuation allowance for deferred tax assets were as follows:
| | | | | | | | | | | | | | | | | | | | | |
| Years Ended (In Millions) | | | Dec 27, 2025 | | Dec 28, 2024 | | Dec 30, 2023 |
| | | | | | | |
| | | | | | | |
| | | | | | | |
| | | | | | | |
Balance at Beginning of Year | | | $ | 13,974 | | | $ | 3,047 | | | $ | 2,586 | |
Additions charged to expenses/other accounts | | | 2,428 | | | 10,927 | | | 461 | |
(Deductions) recoveries, net | | | — | | | — | | | — | |
Balance at End of Year | | | $ | 16,402 | | | $ | 13,974 | | | $ | 3,047 | |
Deferred tax assets are included within other long-term assets on the Consolidated Balance Sheets. Deferred tax liabilities are included within other long-term liabilities on the Consolidated Balance Sheets.
The $2.4 billion change in valuation allowance from December 28, 2024 to December 27, 2025 is substantially attributable to the uncertainty regarding the realizability of our U.S. deferred tax assets.
As of December 27, 2025, our federal and non-U.S. net operating loss carryforwards for income tax purposes were $261 million and $2.9 billion, respectively. The majority of the federal and non-U.S. net operating loss carryforwards have no expiration date. The remaining federal and non-U.S. net operating loss carryforwards expire at various dates through 2040.
| | | | | | | | | | | |
| Financial Statements | Notes to Consolidated Financial Statements | 85 |
As of December 27, 2025, we have undistributed earnings of certain foreign subsidiaries of $22.2 billion that we have indefinitely invested, and on which we have not recognized deferred taxes. Estimating the amount of potential tax is not practicable because of the complexity and variety of assumptions necessary to compute the tax.
Current income taxes receivable of $7.6 billion as of December 27, 2025 ($2.6 billion as of December 28, 2024) are included in other current assets.
Long-term income taxes payable of $1.5 billion as of December 27, 2025 ($1.6 billion as of December 28, 2024) are primarily composed of uncertain tax positions, reduced by the associated deduction for state taxes and non-U.S. tax credits.
Uncertain Tax Positions
| | | | | | | | | | | | | | | | | | | | |
| Years Ended (In Millions) | | Dec 27, 2025 | | Dec 28, 2024 | | Dec 30, 2023 |
| Beginning gross unrecognized tax benefits | | $ | 1,130 | | | $ | 1,124 | | | $ | 1,229 | |
| Settlements and effective settlements with tax authorities | | (52) | | | (59) | | | (288) | |
| | | | | | |
| Changes in balances related to tax position taken during prior periods | | 201 | | | (8) | | | — | |
| | | | | | |
| Changes in balances related to tax position taken during current period | | 105 | | | 73 | | 183 |
| Ending gross unrecognized tax benefits | | $ | 1,384 | | | $ | 1,130 | | | $ | 1,124 | |
If the remaining balance of unrecognized tax benefits were recognized in a future period, it would result in a tax benefit of $949 million as of December 27, 2025 ($946 million as of December 28, 2024) and a reduction in the effective tax rate. Interest, penalties and accrued interest related to unrecognized tax benefits were insignificant in the periods presented.
We file federal, state and non-U.S. tax returns. We are no longer subject to U.S. federal and non-U.S. tax examinations for years prior to 2018 and 2015, respectively. For U.S. state tax returns, we are no longer subject to tax examination for years prior to 2015.
Cash Taxes Paid
We adopted ASU 2023-09 on a prospective basis for the year ended December 27, 2025 and have included the following table as a result of our adoption, which presents income taxes paid (net of refunds received) for the year ended December 27, 2025:
| | | | | | | | |
| Year Ended (In Millions) | | Dec 27, 2025 |
| | |
| Federal taxes | | $ | 1,393 | |
| State taxes | | (7) | |
| Foreign taxes: | | |
| China | | 276 | |
| Israel | | 197 | |
| Other foreign jurisdictions | | 440 | |
| Total cash taxes paid | | $ | 2,299 | |
Below is a summary of income taxes paid for the years ended December 28, 2024 and December 30, 2023:
| | | | | | | | | | | | | | |
Years Ended (In Millions) | | Dec 28, 2024 | | Dec 30, 2023 |
Cash paid during the year for: | | | | |
Income taxes, net of refunds | | $ | 2,202 | | | $ | 2,621 | |
| | | | | | | | | | | |
| Financial Statements | Notes to Consolidated Financial Statements | 86 |
Short-term Investments
Short-term investments include marketable debt investments in corporate debt, government debt and financial institution instruments, and are recorded within cash and cash equivalents and short-term investments on the Consolidated Balance Sheets. Government debt includes instruments such as non-U.S. government bills and bonds and U.S. agency securities. Financial institution instruments include instruments issued or managed by financial institutions in various forms, such as commercial paper, fixed- and floating-rate bonds, money market fund deposits and time deposits. As of December 27, 2025 and December 28, 2024, the substantial majority of time deposits were issued by institutions outside the U.S.
The fair value of our economically hedged marketable debt investments was $21.8 billion as of December 27, 2025 ($13.5 billion as of December 28, 2024). For economically hedged investments still held at the reporting date, we recorded net gains of $341 million in 2025 (net losses of $464 million in 2024 and net gains of $534 million in 2023).
Our remaining unhedged marketable debt investments are reported at fair value, with unrealized gains or losses, net of tax, recorded in accumulated other comprehensive income (loss). The adjusted cost of our unhedged investments was $10.6 billion as of December 27, 2025 ($5.2 billion as of December 28, 2024), which approximated the fair values at each date.
The fair value of marketable debt investments, by contractual maturity, as of December 27, 2025, was as follows:
| | | | | | | | |
| (In Millions) | | Fair Value |
| Due in 1 year or less | | $ | 9,543 | |
| Due in 1–2 years | | 8,531 | |
| Due in 2–5 years | | 6,554 | |
| Due after 5 years | | 291 | |
Instruments not due at a single maturity date1 | | 7,474 | |
| Total | | $ | 32,393 | |
1 Instruments not due at a single maturity date is composed of money market fund deposits, which are classified as either short-term investments or cash and cash equivalents.
Equity Investments
| | | | | | | | | | | | | | |
(In Millions) | | Dec 27, 2025 | | Dec 28, 2024 |
Marketable equity investments1 | | $ | 484 | | | $ | 848 | |
Non-marketable equity investments | | 8,028 | | | 4,535 | |
| Total | | $ | 8,512 | | | $ | 5,383 | |
1 Most of our marketable equity investments are subject to trading-volume or market-based restrictions, which limit the number of shares we may sell in a specified period of time, impacting our ability to liquidate these investments. Certain of the trading-volume restrictions generally apply for as long as we own more than 1% of the outstanding shares. Market-based restrictions result from the rules of the respective exchange.
The components of gains (losses) on equity investments, net for each period were as follows:
| | | | | | | | | | | | | | | | | | | | |
| Years Ended (in Millions) | | Dec 27, 2025 | | Dec 28, 2024 | | Dec 30, 2023 |
Unrealized gains (losses) on marketable equity investments, net | | $ | (311) | | | $ | (218) | | | $ | (99) | |
Unrealized gains (losses) on non-marketable equity investments, net1 | | 490 | | | 92 | | | 17 | |
Impairment charges on non-marketable equity investments | | (300) | | | (347) | | | (214) | |
Unrealized gains (losses) on equity investments, net | | (121) | | | (473) | | | (296) | |
Realized gains (losses) on sales of equity investments, net | | $ | 635 | | | $ | 715 | | | $ | 336 | |
| Gains (losses) on equity investments, net | | $ | 514 | | | $ | 242 | | | $ | 40 | |
1 Unrealized gains (losses) on non-marketable investments includes observable price adjustments and our share of equity method investee gains (losses) and certain distributions.
During the year ended December 27, 2025, we recognized upward observable price adjustments of $396 million related to a single investee within gains (losses) on equity investments, net.
As of December 27, 2025, the cumulative amount of impairments for equity investments without readily determinable fair value was $1.6 billion ($1.4 billion as of December 28, 2024) and upward observable price adjustments were $1.9 billion ($1.4 billion as of December 28, 2024).
| | | | | | | | | | | |
| Financial Statements | Notes to Consolidated Financial Statements | 87 |
Altera
In the third quarter of 2025, we closed the sale of Altera and retained a 49% interest in the business (refer to "Note 10: Acquisitions and Divestitures" within Notes to Consolidated Financial Statements). Our retained interest in Altera is accounted for under the equity method and classified within equity investments in the Consolidated Balance Sheets. As of December 27, 2025, the carrying value of our non-marketable equity investment in Altera was $3.2 billion and our ownership interest was 48%.
We provide semiconductor wafer manufacturing services to Altera, a related party, in accordance with a wafer manufacturing and sale agreement. Additionally, and in connection with the divestiture, we will be reimbursed for costs that we incur on behalf of Altera for certain corporate services delivered under a transition services agreement, which may include information technology, finance, supply chain and other services provided on an interim basis.
| | | | | |
| Note 10 : | Acquisitions and Divestitures |
Altera Divestiture
On April 14, 2025, we signed a transaction agreement with SLP VII Gryphon Aggregator, L.P., an affiliate of SLP, to sell 51% of all issued and outstanding common stock of Altera, our wholly owned subsidiary as of that date. On September 12, 2025, we completed the divestiture of 51% of Altera for net purchase consideration of $4.3 billion, consisting of: $4.3 billion in cash proceeds received at the closing; $500 million in deferred cash proceeds also received within the third quarter of 2025; $500 million in deferred cash proceeds payable to us no later than December 31, 2027; an offset of $400 million for cash transferred to Altera with the sale; an offset of approximately $469 million in separation and employee-related costs we have agreed to fund to SLP; and an offset for other direct and incremental costs incurred in connection with the sale.
As of December 27, 2025, the outstanding receivable from SLP was $463 million recorded within other long-term assets for the present value of deferred consideration, which is not subject to any contingencies, and $327 million and $97 million within other accrued liabilities and other long-term liabilities, respectively, for amounts payable to SLP for separation and employee-related costs that have not yet been paid and that relate to the transaction. We continue to finalize certain customary closing adjustments with SLP which may result in adjustments to the final net cash proceeds received related to, and our gain on sale for, the transaction.
Upon closing the transaction, we retained a 49% minority investment in Altera, which is accounted for under the equity method of accounting. We established the fair value of our non-marketable equity investment in reference to Altera's equity value per the terms of the transaction agreement as the transaction negotiated with SLP represented an orderly transaction between market participants. The $3.2 billion value of our non-marketable equity investment in Altera is classified within equity investments in the Consolidated Balance Sheets at December 27, 2025 and recognized as a non-cash investing activity in the year ended December 27, 2025.
Based on the terms of the transaction agreement with SLP, we have concluded that Altera is a VIE for which we are not the primary beneficiary because the governance structure of the entity does not allow us to direct the activities that most significantly impact Altera's economic performance. In line with this conclusion, we deconsolidated Altera from our Consolidated Financial Statements at the September 12, 2025 transaction close date.
The carrying amounts of the major classes of Altera's net assets that we sold as of the September 12, 2025 transaction close date included the following:
| | | | | | | | |
| (In Millions) | | |
Assets | | |
Cash and cash equivalents | | $ | 400 | |
Inventories | | 673 | |
Property, plant and equipment, net | | 198 | |
Identified intangible assets, net | | 394 | |
| Goodwill | | 781 | |
Other assets | | 316 | |
Total assets | | $ | 2,762 | |
Liabilities | | |
| Accrued compensation and benefits | | $ | 182 | |
| Other liabilities | | 218 | |
Total liabilities | | $ | 400 | |
| | | | | | | | | | | |
| Financial Statements | Notes to Consolidated Financial Statements | 88 |
Our sale of a 51% controlling stake in Altera, which is partially offset by the cash sold with Altera, separation and employee-related costs we agreed to fund to SLP, as well as direct and incremental costs we incurred to sell the business, resulted in a pre-tax gain of $5.6 billion recognized within interest and other, net in 2025. Our pre-tax gain was calculated as follows:
| | | | | | | | | | |
| (In Millions) | | | | |
| Proceeds from divestiture, net of cash sold and direct selling costs | | $ | 4,266 | | | |
Deferred consideration1 | | 457 | | | |
Fair value of retained interest in Altera1 | | 3,246 | | | |
| Less: net assets of Altera, net of cash sold | | (1,962) | | | |
Less: separation and employee-related costs and other1 | | (454) | | | |
| Gain on divestiture of Altera | | $ | 5,553 | | | |
1 Certain aspects of the net purchase consideration have yet to result in cash inflows and outflows and therefore reflect non-cash investing and financing activities within our Consolidated Statements of Cash Flows for the year ended December 27, 2025.
Approximately $2.1 billion of the gain resulted from the remeasurement of our non-marketable equity investment in Altera to its fair value at the transaction close date. Cash proceeds received in 2025 of $4.2 billion, net of the cash sold and the costs incurred to sell the business, are presented in net cash provided by (used for) investing activities, in the Consolidated Statements of Cash Flows for the year ended December 27, 2025.
NAND Memory Business
We sold our NAND memory technology and manufacturing business to SK hynix, which we deconsolidated upon closing the first phase of the transaction on December 29, 2021. On March 27, 2025, we closed the second phase of the transaction.
In connection with the second closing, we collected the outstanding receivable and entered into a final release and settlement agreement with SK hynix primarily related to certain penalties and contingencies associated with the manufacturing and sale agreement between us and SK hynix. For the year ended December 27, 2025 we recognized net charges of $229 million within interest and other, net for the amounts incurred pursuant to this agreement. During the year ended December 27, 2025, we recorded net proceeds of $1.8 billion within cash and cash equivalents.
Mobileye's Pending Acquisition of Mentee Robotics
On January 5, 2026, Mobileye entered into a definitive agreement to acquire Mentee Robotics, an AI-first humanoid robotics company, for an aggregate purchase price of approximately $900 million, subject to customary adjustments and closing conditions.
| | | | | | | | | | | | | | | | | | | | | | | | | | | | | | | | |
(In Millions) | | Dec 28, 2024 | | Divestitures | | Transfers | | Impairments | | Dec 27, 2025 |
| Client Computing | | $ | 4,619 | | | $ | — | | | $ | 1,865 | | | $ | — | | | $ | 6,484 | |
| Data Center and AI | | 7,944 | | | — | | | 1,001 | | | — | | | 8,945 | |
| Network and Edge | | 2,780 | | | — | | | (2,780) | | | — | | | — | |
Mobileye1 | | 8,306 | | | — | | | — | | | — | | | 8,306 | |
| Altera | | 781 | | | (781) | | | — | | | — | | | — | |
| All Other | | 263 | | | — | | | (86) | | | — | | | 177 | |
| Total | | $ | 24,693 | | | $ | (781) | | | $ | — | | | $ | — | | | $ | 23,912 | |
| | | | | | | | | | |
| | | | | | | | | | | | | | | | | | | | | | | | | | | | | | | | |
| (In Millions) | | Dec 30, 2023 | | Acquisitions | | Transfers | | Impairments | | Dec 28, 2024 |
| Client Computing | | $ | 4,749 | | | $ | — | | | $ | (130) | | | $ | — | | | $ | 4,619 | |
| Data Center and AI | | 8,721 | | | — | | | (777) | | | — | | | 7,944 | |
| Network and Edge | | 2,809 | | | — | | | (29) | | | — | | | 2,780 | |
| Intel Foundry | | — | | | — | | | 222 | | | (222) | | | — | |
Mobileye1 | | 10,919 | | | — | | | — | | | (2,613) | | | 8,306 | |
| Altera | | — | | | — | | | 781 | | | — | | | 781 |
All Other | | 393 | | | 86 | | | (67) | | | (149) | | | 263 | |
| Total | | $ | 27,591 | | | $ | 86 | | | $ | — | | | $ | (2,984) | | | $ | 24,693 | |
1 Mobileye includes goodwill balances for both the Mobileye and Moovit reporting units.
| | | | | | | | | | | |
| Financial Statements | Notes to Consolidated Financial Statements | 89 |
During the fourth quarter of 2025, we completed our annual goodwill impairment assessment across all of our reporting units and identified that a more detailed quantitative analysis was necessary for our Mobileye reporting unit, primarily due to the decline in Mobileye's market capitalization below the carrying value of Mobileye's net assets. Our quantitative assessment was performed by measuring Mobileye's fair value using the income approach. When using the income approach, we tested the reasonableness of the inputs and outcomes of our discounted cash flow analysis against available market data. As a result of this impairment test, no impairment charge was recognized as the estimated fair value was higher than the assigned carrying value. Finally, to corroborate our estimated fair value for the Mobileye reporting unit, we performed a market capitalization reconciliation as of December 27, 2025, concluding that the implied control premium was reasonable as compared to relevant market transactions in similar industries. Notwithstanding Mobileye, our annual qualitative assessment did not indicate that a more detailed quantitative analysis was necessary for our other reporting units as the most recently calculated fair value substantially exceeded the assigned carrying value for each reporting unit as of December 27, 2025.
During the third quarter of 2025, we divested our Altera business, including all allocated goodwill. For further information see "Note 10: Acquisitions and Divestitures" within Notes to Consolidated Financial Statements.
As described in "Note 3: Operating Segments" within the Notes to Consolidated Financial Statements, in the first quarter of 2025, we made an organizational change to integrate our NEX business into CCG and DCAI and modified our segment reporting to align to this and certain other business reorganizations. As a result, of the total $2.8 billion of goodwill previously allocated to NEX, we reallocated $1.8 billion to CCG and $1.0 billion to DCAI on a relative fair value basis. We performed a quantitative impairment assessment for each of our reporting units immediately before and after our business reorganization, concluding that goodwill was not impaired.
In the third quarter of 2024, our quarterly qualitative impairment assessment indicated that a more detailed quantitative analysis was necessary for certain of our reporting units, primarily due to the decline in our market capitalization below the carrying value of our net assets, as well as the decline in our Mobileye reporting unit's market capitalization below the carrying value of Mobileye's net assets. Our quantitative assessment was performed by measuring each reporting unit's fair value using the income approach, the market approach, or a combination of both. When using the income approach, we tested the reasonableness of the inputs and outcomes of our discounted cash flow analysis against available market data. As a result of our impairment tests, we recognized a non-cash goodwill impairment charge of $2.8 billion in the third quarter of 2024 within restructuring and other, substantially all of which related to our Mobileye reporting unit, as the estimated fair value of the reporting unit was lower than the assigned carrying value. The process of valuing each reporting unit is inherently subjective as valuation models require the application of significant estimates and the use of unobservable inputs, including market segment share, projected financial information and discount rates. No impairment was required for our other reporting units, even when considering a hypothetical increase in the discount rate of 1%, which would cause a significant decrease in the estimated fair value of the respective non-impaired reporting units. Finally, to corroborate our estimated fair value, we performed a market capitalization reconciliation as of September 28, 2024, concluding that the implied control premium was reasonable as compared to relevant market transactions in similar industries. In the fourth quarter of 2024, as a part of our annual goodwill impairment assessment, we determined that the most recently calculated fair value of each reporting unit substantially exceeded the assigned carrying value, with the exception of one reporting unit with a significant amount of assigned goodwill: Mobileye. We performed a quantitative impairment assessment of Mobileye during the fourth quarter of 2024 and concluded there was no additional impairment.
In the first quarter of 2024, as a result of modifying our segment reporting, we reallocated goodwill among our affected reporting units on a relative fair value basis. We performed a quantitative goodwill impairment assessment for each of our reporting units immediately before and after our business reorganization. We concluded, based on our pre-reorganization impairment test, that goodwill was not impaired. As a result of our post-reorganization impairment test, we recognized a non-cash goodwill impairment loss of $222 million within restructuring and other in the first quarter of 2024 related to our Intel Foundry reporting unit, as the estimated fair value of the new reporting unit was lower than the assigned carrying value, which includes substantially all of our allocated property, plant and equipment. The Intel Foundry reporting unit has no remaining goodwill. At the conclusion of our impairment assessment performed during the first quarter of 2024, the fair value substantially exceeded the carrying value for all remaining reporting units.
The accumulated impairment loss as of December 27, 2025 was $3.9 billion: $2.6 billion associated with Mobileye, $415 million associated with CCG, $303 million associated with DCAI and the remainder associated with other reporting units.
| | | | | |
| Note 12 : | Identified Intangible Assets |
| | | | | | | | | | | | | | | | | | | | | | | | | | | | | | | | | | | | | | |
| | December 27, 2025 | | December 28, 2024 |
| (In Millions) | | Gross Assets | | Accumulated Amortization | | Net | | Gross Assets | | Accumulated Amortization | | Net |
| Developed technology | | $ | 3,853 | | | $ | (2,886) | | | $ | 967 | | | $ | 8,007 | | | $ | (6,445) | | | $ | 1,562 | |
| Customer relationships and brands | | 808 | | | (580) | | | 228 | | | 1,907 | | | (1,372) | | | 535 | |
| Licensed technology, patents and other | | 3,857 | | | (2,280) | | | 1,577 | | | 3,519 | | | (1,925) | | | 1,594 | |
| Total identified intangible assets | | $ | 8,518 | | | $ | (5,746) | | | $ | 2,772 | | | $ | 13,433 | | | $ | (9,742) | | | $ | 3,691 | |
| | | | | | | | | | | |
| Financial Statements | Notes to Consolidated Financial Statements | 90 |
During 2025 and 2024, we capitalized several licensed technology, patents and other arrangements totaling $431 million and $562 million respectively. These intangible assets are subject to amortization over a weighted average useful life of approximately 6 years. Additionally, during 2025, we divested Altera and retired certain intangible assets that were fully amortized resulting in a reduction of our gross assets and accumulated amortization as of December 27, 2025. For further information see "Note 10: Acquisitions and Divestitures" within Notes to Consolidated Financial Statements.
Amortization expenses recorded for and the weighted average useful life assigned to identified intangible assets in the Consolidated Statements of Operations for each period were as follows:
| | | | | | | | | | | | | | | | | | | | | | | | |
| Years Ended (In Millions) | | Dec 27, 2025 | | Dec 28, 2024 | | Dec 30, 2023 | | |
| Developed technology | | $ | 417 | | | $ | 879 | | | $ | 1,235 | | | |
| Customer relationships and brands | | 89 | | | 165 | | | 172 | | | |
| Licensed technology, patents and other | | 443 | | | 384 | | | 348 | | | |
| Total amortization expenses | | $ | 949 | | | $ | 1,428 | | | $ | 1,755 | | | |
We expect future amortization expense for the next five years and thereafter to be as follows:
| | | | | | | | | | | | | | | | | | | | | | | | | | | | | | | | | | | | | | | | | | | | |
| (In Millions) | | 2026 | | 2027 | | 2028 | | 2029 | | 2030 | | Thereafter | | Total |
| Future amortization expenses | | $ | 813 | | | $ | 594 | | | $ | 449 | | | $ | 301 | | | $ | 216 | | | $ | 399 | | | $ | 2,772 | |
Short-Term Debt
Short-term debt, which primarily includes the current portion of long-term debt, was $2.5 billion as of December 27, 2025 and $3.7 billion as of December 28, 2024. The current portion of long-term debt includes debt classified as short-term based on time remaining until maturity.
We have an ongoing authorization from our Board of Directors to borrow up to $10.0 billion under our commercial paper program. We issued and repaid commercial paper of $3.5 billion in 2025 and $7.3 billion in 2024 and repaid $3.9 billion of commercial paper in 2023. As of December 27, 2025 and December 28, 2024, we had no commercial paper outstanding.
| | | | | | | | | | | |
| Financial Statements | Notes to Consolidated Financial Statements | 91 |
Long-Term Debt
| | | | | | | | | | | | | | | | | | | | | | | | | | |
| | Dec 27, 2025 | | | | Dec 28, 2024 | | | | |
($ In Millions) | | Effective Interest Rate | | Amount | | | | Amount | | | | |
| | | | | | | | | | | | |
| | | | | | | | | | | | |
| | | | | | | | | | | | |
| Fixed-rate senior notes: | | | | | | | | | | | | |
| | | | | | | | | | | | |
| | | | | | | | | | | | |
| | | | | | | | | | | | |
| | | | | | | | | | | | |
| | | | | | | | | | | | |
| | | | | | | | | | | | |
| 3.40%, due March 2025 | | —% | | $ | — | | | | | $ | 1,500 | | | | | |
| 3.70%, due July 2025 | | —% | | — | | | | | 2,250 | | | | | |
| 4.88%, due February 2026 | | 4.93% | | 1,500 | | | | | 1,500 | | | | | |
| 2.60%, due May 2026 | | 5.03% | | 1,000 | | | | | 1,000 | | | | | |
| 3.75%, due March 2027 | | 3.78% | | 1,000 | | | | | 1,000 | | | | | |
| 3.15%, due May 2027 | | 5.60% | | 1,000 | | | | | 1,000 | | | | | |
| 3.75%, due August 2027 | | 3.81% | | 1,250 | | | | | 1,250 | | | | | |
| 4.88%, due February 2028 | | 4.92% | | 1,750 | | | | | 1,750 | | | | | |
| 1.60%, due August 2028 | | 1.67% | | 1,000 | | | | | 1,000 | | | | | |
| 4.00%, due August 2029 | | 4.05% | | 850 | | | | | 850 | | | | | |
| 2.45%, due November 2029 | | 2.38% | | 2,000 | | | | | 2,000 | | | | | |
| 5.13%, due February 2030 | | 5.14% | | 1,250 | | | | | 1,250 | | | | | |
| 3.90%, due March 2030 | | 3.91% | | 1,500 | | | | | 1,500 | | | | | |
| 5.00%, due February 2031 | | 5.07% | | 500 | | | | | 500 | | | | | |
| 2.00%, due August 2031 | | 2.02% | | 1,250 | | | | | 1,250 | | | | | |
| 4.15%, due August 2032 | | 4.17% | | 1,250 | | | | | 1,250 | | | | | |
| 4.00%, due December 2032 | | 5.65% | | 750 | | | | | 750 | | | | | |
| 5.20%, due February 2033 | | 5.23% | | 2,250 | | | | | 2,250 | | | | | |
| 5.15%, due February 2034 | | 5.18% | | 900 | | | | | 900 | | | | | |
| 4.60%, due March 2040 | | 4.59% | | 750 | | | | | 750 | | | | | |
| 2.80%, due August 2041 | | 2.81% | | 750 | | | | | 750 | | | | | |
| 4.80%, due October 2041 | | 6.39% | | 802 | | | | | 802 | | | | | |
| 4.25%, due December 2042 | | 5.89% | | 567 | | | | | 567 | | | | | |
| 5.63%, due February 2043 | | 5.61% | | 1,000 | | | | | 1,000 | | | | | |
| 4.90%, due July 2045 | | 6.52% | | 772 | | | | | 772 | | | | | |
| 4.10%, due May 2046 | | 5.80% | | 1,250 | | | | | 1,250 | | | | | |
| 4.10%, due May 2047 | | 5.76% | | 1,000 | | | | | 1,000 | | | | | |
| 4.10%, due August 2047 | | 5.33% | | 640 | | | | | 640 | | | | | |
| 3.73%, due December 2047 | | 6.17% | | 1,967 | | | | | 1,967 | | | | | |
| 3.25%, due November 2049 | | 3.19% | | 2,000 | | | | | 2,000 | | | | | |
| 4.75%, due March 2050 | | 4.73% | | 2,250 | | | | | 2,250 | | | | | |
| 3.05%, due August 2051 | | 3.05% | | 1,250 | | | | | 1,250 | | | | | |
| 4.90%, due August 2052 | | 4.89% | | 1,750 | | | | | 1,750 | | | | | |
| 5.70%, due February 2053 | | 5.68% | | 2,000 | | | | | 2,000 | | | | | |
| 5.60%, due February 2054 | | 5.59% | | 1,150 | | | | | 1,150 | | | | | |
| 3.10%, due February 2060 | | 3.10% | | 1,000 | | | | | 1,000 | | | | | |
| 4.95%, due March 2060 | | 4.98% | | 1,000 | | | | | 1,000 | | | | | |
| 3.20%, due August 2061 | | 3.20% | | 750 | | | | | 750 | | | | | |
| 5.05%, due August 2062 | | 5.03% | | 900 | | | | | 900 | | | | | |
| 5.90%, due February 2063 | | 5.88% | | 1,250 | | | | | 1,250 | | | | | |
| | | | | | | | | | | | |
| | | | | | | | | | | |
| Financial Statements | Notes to Consolidated Financial Statements | 92 |
| | | | | | | | | | | | | | | | | | | | | | |
| | Dec 27, 2025 | | | | Dec 28, 2024 |
| ($ In Millions) | | Effective Interest Rate | | Amount | | | | Amount |
Oregon and Arizona bonds1: | | | | | | | | |
| 3.80% - 4.10%, due December 2035 - 2040 | | 3.87% | | 423 | | | | | 423 | |
| 5.00%, due September 2042 | | 3.63% | | 131 | | | | | 131 | |
| | | | | | | | |
| 4.00%, due June 2049 | | 3.98% | | 438 | | | | | 438 | |
| 5.00%, due September 2052 | | 4.24% | | 445 | | | | | 445 | |
| Total senior notes and other borrowings | | | | 47,235 | | | | | 50,985 | |
| Unamortized premium/discount, issuance costs and other | | | | (384) | | | | | (392) | |
| Hedge accounting fair value adjustments | | | | (266) | | | | | (582) | |
| Long-term debt | | | | 46,585 | | | | | 50,011 | |
Current portion of long-term debt2 | | | | (2,499) | | | | | (3,729) | |
| Total long-term debt | | | | $ | 44,086 | | | | | $ | 46,282 | |
1 These bonds may be remarketed or tendered on a periodic basis and will be classified within the current portion of long-term debt in the 12 months before remarketing or tendering.
2 As of December 27, 2025, current portion of long-term debt includes $7 million of hedge accounting fair value adjustments ($36 million as of December 28, 2024).
Senior Notes
In 2025, we settled in cash $3.7 billion of our senior notes that matured in March 2025 and July 2025.
In 2024, we issued a total of $2.6 billion aggregate principal amount of senior notes, and settled in cash $1.9 billion of our senior notes that matured in May 2024 and June 2024.
Our fixed-rate senior notes pay interest semiannually. We may redeem the fixed-rate notes prior to their maturity at our option at specified redemption prices and subject to certain restrictions. The obligations under the notes rank equally in right of payment with all of our other existing and future senior unsecured indebtedness and will effectively rank junior to all liabilities of our subsidiaries.
Arizona Bonds
In 2024, we remarketed $438 million aggregate principal amount of bonds issued by the Industrial Development Authority of the City of Chandler, Arizona. In accordance with loan agreements we entered into with the Industrial Development Authority of the City of Chandler, Arizona, the bonds are unsecured general obligations. The bonds mature in 2049 and have a 4.0% coupon. The bonds are subject to optional tender starting in February 2029 and mandatory tender in June 2029, at which time we may remarket the bonds for a new term period.
Revolving Credit Facilities
In 2025, we amended our 364-day $8.0 billion credit facility agreement to $5.0 billion, and the maturity date was extended by one year to January 2026. We expect to replace or amend the 364-day $5.0 billion credit facility agreement prior to its maturity at the end of January 2026.
In 2024, we expanded our 5-year $5.0 billion revolving credit facility agreement to $7.0 billion and the maturity date was extended by one year to February 2029.
Our revolving credit facilities are unsecured general obligations and had no borrowings outstanding as of December 27, 2025 and December 28, 2024.
Debt Maturities
Our aggregate debt maturities, based on outstanding principal as of December 27, 2025, by year payable, are as follows:
| | | | | | | | | | | | | | | | | | | | | | | | | | | | | | | | | | | | | | | | | | | | |
| (In Millions) | | 2026 | | 2027 | | 2028 | | 2029 | | 2030 | | 2031 and thereafter | | Total |
Future debt maturities | | $ | 2,500 | | | $ | 3,826 | | | $ | 3,173 | | | $ | 3,288 | | | $ | 2,750 | | | $ | 31,698 | | | $ | 47,235 | |
| | | | | | | | | | | |
| Financial Statements | Notes to Consolidated Financial Statements | 93 |
Assets and Liabilities Measured and Recorded at Fair Value on a Recurring Basis
| | | | | | | | | | | | | | | | | | | | | | | | | | | | | | | | | | | | | | | | | | | | | | | | | | |
| | December 27, 2025 | | December 28, 2024 |
| | Fair Value Measured and Recorded at Reporting Date Using | | Total | | Fair Value Measured and Recorded at Reporting Date Using | | Total |
(In Millions) | | Level 1 | | Level 2 | | Level 3 | | Level 1 | | Level 2 | | Level 3 | |
| Assets | | | | | | | | | | | | | | | | |
| Cash equivalents: | | | | | | | | | | | | | | | | |
| Corporate debt | | $ | — | | | $ | 150 | | | $ | — | | | $ | 150 | | | $ | — | | $ | — | | | $ | — | | $ | — | |
Financial institution instruments1 | | 7,292 | | | 1,800 | | | — | | | 9,092 | | | 4,121 | | | 743 | | | — | | 4,864 | |
| | | | | | | | | | | | | | | | |
| Reverse repurchase agreements | | — | | | 4,262 | | | — | | | 4,262 | | | — | | 2,654 | | | — | | 2,654 | |
| Short-term investments: | | | | | | | | | | | | | | | | |
| Corporate debt | | — | | | 7,248 | | | — | | | 7,248 | | | — | | 5,365 | | | — | | 5,365 | |
Financial institution instruments1 | | 183 | | | 3,991 | | | — | | | 4,174 | | | 195 | | | 3,356 | | | — | | 3,551 | |
Government debt2 | | 5,296 | | | 6,433 | | | — | | | 11,729 | | | 33 | | | 4,864 | | | — | | 4,897 | |
| Other current assets: | | | | | | | | | | | | | | | | |
| Derivative assets | | 431 | | | 608 | | | — | | | 1,039 | | | 348 | | | 733 | | | — | | 1,081 | |
Marketable equity investments | | 484 | | | — | | | — | | | 484 | | | 848 | | | — | | | — | | 848 | |
| Other long-term assets: | | | | | | | | | | | | | | | | |
| Derivative assets | | — | | | 2 | | | — | | | 2 | | | — | | 1 | | | — | | | 1 | |
| | | | | | | | | | | | | | | | |
| Total assets measured and recorded at fair value | | $ | 13,686 | | | $ | 24,494 | | | $ | — | | | $ | 38,180 | | | $ | 5,545 | | | $ | 17,716 | | | $ | — | | | $ | 23,261 | |
| Liabilities | | | | | | | | | | | | | | | | |
| Other accrued liabilities: | | | | | | | | | | | | | | | | |
Derivative liabilities3 | | $ | 6 | | | $ | 1,524 | | | $ | 304 | | | $ | 1,834 | | | $ | — | | $ | 562 | | | $ | 134 | | $ | 696 | |
| | | | | | | | | | | | | | | | |
| Other long-term liabilities: | | | | | | | | | | | | | | | | |
Derivative liabilities3 | | — | | | 1,714 | | | 576 | | | 2,290 | | | — | | 416 | | | 755 | | 1,171 | |
| Total liabilities measured and recorded at fair value | | $ | 6 | | | $ | 3,238 | | | $ | 880 | | | $ | 4,124 | | | $ | — | | $ | 978 | | | $ | 889 | | $ | 1,867 | |
1 Level 1 investments consist of money market funds. Level 2 investments consist primarily of time deposits, notes and bonds issued by financial institutions.
2 Level 1 investments consist primarily of U.S. Treasury securities. Level 2 investments consist primarily of non-U.S. government debt.
3 Level 1 derivative liabilities consist of equity contracts for our deferred compensation program. Level 2 derivative liabilities include a forward contract related to Escrowed Shares held. Level 3 derivative liabilities include liquidated damage provisions related to our Ireland SCIP arrangement.
Assets Measured and Recorded at Fair Value on a Non-Recurring Basis
Our non-marketable equity investments and certain non-financial assets—such as intangible assets, goodwill and property, plant and equipment—are recorded at fair value only if an impairment or observable price adjustment is recognized in the current period. If an observable price adjustment or impairment is recognized on our non-marketable equity investments during the period, we classify these assets as Level 3. Similarly, impairments recognized on our goodwill, intangible assets and property, plant and equipment are categorized as Level 3 within the fair value hierarchy, as we utilize unobservable inputs such as prospective financial information, market segment growth rates and discount rates in the fair value measurement process.
Our non-recurring fair value measurements include the valuation of our non-marketable equity investment in Altera on the September 12, 2025 transaction close date, the fair value for which was measured and recorded using Level 3 inputs. See "Note 10: Acquisitions and Divestitures" within Notes to Consolidated Financial Statements for further information.
| | | | | | | | | | | |
| Financial Statements | Notes to Consolidated Financial Statements | 94 |
Financial Instruments Not Recorded at Fair Value on a Recurring Basis
Financial instruments not recorded at fair value on a recurring basis include non-marketable equity investments that have not been remeasured or impaired in the current period, grants receivable, issued debt and our outstanding receivable from SLP of $463 million which was measured and recorded using Level 2 inputs, as of December 27, 2025.
We classify the fair value of grants receivable as Level 2. The estimated fair value of these financial assets approximates their carrying value. The aggregate carrying value of grants receivable as of December 27, 2025 was $652 million (the aggregate carrying value of grants receivable as of December 28, 2024 was $1.7 billion).
We classify the fair value of issued debt (excluding commercial paper) as Level 2. The fair value of these instruments was $41.8 billion as of December 27, 2025 ($43.5 billion as of December 28, 2024).
| | | | | |
| Note 15 : | Accumulated Other Comprehensive Income (Loss) |
The changes in accumulated other comprehensive income (loss) by component and related tax effects for each period were as follows:
| | | | | | | | | | | | | | | | | | | | | | | | | | | | | | | | |
(In Millions) | | | | Unrealized Holding Gains (Losses) on Derivatives | | Actuarial Valuation and Other Pension Expenses | | Translation Adjustments and Other | | Total | | | | |
| | | | | | | | | | | | | | |
| | | | | | | | | | | | | | |
| Balance as of December 31, 2022 | | | | $ | (299) | | | $ | (259) | | | $ | (4) | | | $ | (562) | | | | | |
| Other comprehensive income (loss) before reclassifications | | | | 3 | | | 57 | | | 11 | | | 71 | | | | | |
| Amounts reclassified out of accumulated other comprehensive (income) loss | | | | 328 | | | 33 | | | — | | | 361 | | | | | |
| Tax effects | | | | (59) | | | (24) | | | (2) | | | (85) | | | | | |
| Other comprehensive income (loss) | | | | 272 | | | 66 | | | 9 | | | 347 | | | | | |
| Balance as of December 30, 2023 | | | | (27) | | | (193) | | | 5 | | | (215) | | | | | |
| | | | | | | | | | | | | | |
| | | | | | | | | | | | | | |
| Other comprehensive income (loss) before reclassifications | | | | (652) | | | 54 | | | (4) | | | (602) | | | | | |
| Amounts reclassified out of accumulated other comprehensive (income) loss | | | | 96 | | | 11 | | | 2 | | | 109 | | | | | |
| Tax effects | | | | 1 | | | (5) | | | 1 | | | (3) | | | | | |
| Other comprehensive income (loss) | | | | (555) | | | 60 | | | (1) | | | (496) | | | | | |
| Balance as of December 28, 2024 | | | | (582) | | | (133) | | | 4 | | | (711) | | | | | |
| Other comprehensive income (loss) before reclassifications | | | | 748 | | | 70 | | | 2 | | | 820 | | | | | |
| Amounts reclassified out of accumulated other comprehensive (income) loss | | | | — | | | 26 | | | 2 | | | 28 | | | | | |
| Tax effects | | | | (5) | | | (18) | | | (1) | | | (24) | | | | | |
| Other comprehensive income (loss) | | | | 743 | | | 78 | | | 3 | | | 824 | | | | | |
| Balance as of December 27, 2025 | | | | $ | 161 | | | $ | (55) | | | $ | 7 | | | $ | 113 | | | | | |
| | | | | | | | | | | | | | |
| | | | | | | | | | | | | | |
| | | | | |
| Note 16 : | Derivative Financial Instruments |
Volume of Derivative Activity
The total gross notional amounts for outstanding derivatives (recorded at fair value) at the end of each period were as follows:
| | | | | | | | | | | | | | | | |
(In Millions) | | Dec 27, 2025 | | Dec 28, 2024 | | |
| Foreign currency contracts | | $ | 22,740 | | | $ | 25,472 | | | |
| Interest rate contracts | | 21,796 | | | 17,899 | | | |
Equity contracts1 | | 2,689 | | | 2,593 | | | |
| Total | | $ | 47,225 | | | $ | 45,964 | | | |
1Relates to our deferred compensation program.
The total notional amount of outstanding pay-variable, receive-fixed interest rate swaps was $9.7 billion as of December 27, 2025 and $12.0 billion as of December 28, 2024.
| | | | | | | | | | | |
| Financial Statements | Notes to Consolidated Financial Statements | 95 |
Fair Value of Derivative Instruments in the Consolidated Balance Sheets
| | | | | | | | | | | | | | | | | | | | | | | | | | |
| | December 27, 2025 | | December 28, 2024 |
(In Millions) | | Assets1 | | Liabilities2 | | Assets1 | | Liabilities2 |
| Derivatives designated as hedging instruments: | | | | | | | | |
Foreign currency contracts3 | | $ | 173 | | | $ | 49 | | | $ | 40 | | | $ | 405 | |
| Interest rate contracts | | — | | | 266 | | | — | | | 582 | |
| | | | | | | | |
| Total derivatives designated as hedging instruments | | 173 | | | 315 | | | 40 | | | 987 | |
| Derivatives not designated as hedging instruments: | | | | | | | | |
Foreign currency contracts3 | | 351 | | | 278 | | | 510 | | | 100 | |
| Interest rate contracts | | 86 | | | 116 | | | 184 | | | 25 | |
Equity contracts4 | | 431 | | | 6 | | | 348 | | | — | |
| Escrowed Shares | | — | | | 2,654 | | | — | | | — | |
| Ireland SCIP arrangement | | — | | | 755 | | | — | | | 755 | |
| Total derivatives not designated as hedging instruments | | 868 | | | 3,809 | | | 1,042 | | | 880 | |
| Total derivatives | | 1,041 | | | 4,124 | | | 1,082 | | | 1,867 | |
| Netted cash and non-cash collateral received or pledged | | (907) | | | (571) | | | (948) | | | (1,014) | |
| Net derivatives | | $ | 134 | | | $ | 3,553 | | | $ | 134 | | | $ | 853 | |
1Derivative assets are recorded as other assets, current and long-term.
2Derivative liabilities are recorded as other liabilities, current and long-term.
3A substantial majority of these instruments mature within 12 months.
4Relates to our deferred compensation program.
Gross derivative assets and liabilities subject to master netting agreements were $937 million and $654 million, respectively, as of December 27, 2025 and $948 million and $1.1 billion, respectively, as of December 28, 2024. Gross amounts recognized for reverse repurchase agreements are fully offset by cash collateral pledged.
Derivatives in Cash Flow Hedging Relationships
The before-tax net gains or losses attributed to the effective portion of cash flow hedges recognized in other comprehensive income (loss) were $748 million net gains in 2025 ($652 million net losses in 2024 and $3 million net gains in 2023).
Amounts excluded from effectiveness testing were $103 million net losses in 2025 ($205 million net losses in 2024 and $221 million net losses in 2023).
For information on the unrealized holding gains (losses) on derivatives reclassified out of accumulated other comprehensive income (loss) into the Consolidated Statements of Operations, see "Note 15: Accumulated Other Comprehensive Income (Loss)" within Notes to Consolidated Financial Statements.
Derivatives in Fair Value Hedging Relationships
The effects of derivative instruments designated as fair value hedges, recognized in interest and other, net for each period were as follows:
| | | | | | | | | | | | | | | | | | | | |
| | Gains (Losses) on Derivatives Recognized in Consolidated Statements of Operations |
| Years Ended (In Millions) | | Dec 27, 2025 | | Dec 28, 2024 | | Dec 30, 2023 |
| Interest rate contracts | | $ | 316 | | | $ | (4) | | | $ | 198 | |
| Hedged items | | (316) | | | 4 | | | (198) | |
| Total | | $ | — | | | $ | — | | | $ | — | |
| | | | | | | | | | | |
| Financial Statements | Notes to Consolidated Financial Statements | 96 |
The amounts recorded on the Consolidated Balance Sheets related to cumulative basis adjustments for fair value hedges for each period were as follows:
| | | | | | | | | | | | | | | | | | | | | | | | | | |
| Line Items in the Consolidated Balance Sheets in Which the Hedged Item Is Included | | Carrying Amount of the Hedged Item Assets/(Liabilities) | | Cumulative Amount of Fair Value Hedging Adjustment Included in the Carrying Amount Assets/(Liabilities) |
(In Millions) | | Dec 27, 2025 | | Dec 28, 2024 | | Dec 27, 2025 | | Dec 28, 2024 |
| Short-term debt | | $ | (993) | | | $ | (2,214) | | | $ | 7 | | | $ | 36 | |
| Long-term debt | | (8,488) | | | (9,201) | | | 259 | | | 546 | |
| Total | | $ | (9,481) | | | $ | (11,415) | | | $ | 266 | | | $ | 582 | |
Derivatives Not Designated as Hedging Instruments
The effects of derivative instruments not designated as hedging instruments on the Consolidated Statements of Operations for each period were as follows:
| | | | | | | | | | | | | | | | | | | | | | | | | | |
| Years Ended (In Millions) | | Location of Gains (Losses)
Recognized in Income on Derivatives | | Dec 27, 2025 | | Dec 28, 2024 | | Dec 30, 2023 |
| Foreign currency contracts | | Interest and other, net | | $ | 261 | | | $ | 651 | | | $ | 106 | |
| Interest rate contracts | | Interest and other, net | | (66) | | | 182 | | | 50 | |
| Escrowed Shares | | Interest and other, net | | (1,796) | | | — | | | — | |
| Other | | Various | | 266 | | | (411) | | | 325 | |
| Total | | $ | (1,335) | | | $ | 422 | | | $ | 481 | |
We incurred $1.8 billion of losses in 2025 related to changes in fair value of the Escrowed Shares released during the year ended December 27, 2025 and still held as of December 27, 2025 (refer to "Note 5: Earnings (Loss) Per Share and Stockholders' Equity" within Notes to Consolidated Financial Statements).
Our Ireland SCIP agreement with Apollo contains construction-related liquidated damage provisions that meet the definition of an embedded derivative that is not clearly and closely related to the relevant host contract, thus requiring bifurcation and separate accounting as a derivative liability.In 2024, we assessed the probability of paying damages to Apollo and recognized a loss of $755 million within interest and other, net from the change in fair value of the liquidated damage provisions recognized within other accrued liabilities for $179 million and other long-term liabilities for $576 million as of December 27, 2025 ($755 million in other long-term liabilities as of December 28, 2024). We periodically reassess the probability of paying such liquidated damages and recognize changes in the fair value of the underlying liability through interest and other, net.
| | | | | |
| Note 17 : | Retirement Benefit Plans |
Defined Contribution Plans
We provide tax-qualified defined contribution plans for the benefit of eligible employees, former employees and retirees in the U.S. and certain other countries. The plans are designed to provide employees with an accumulation of funds for retirement on a tax-deferred basis. For the benefit of eligible U.S. employees, we also provide an unfunded non-tax-qualified supplemental deferred compensation plan for certain highly compensated employees, which had a balance of $3.2 billion as of December 27, 2025 ($3.3 billion as of December 28, 2024), recorded within other accrued liabilities on the Consolidated Balance Sheets.
We expensed $347 million in 2025, $541 million in 2024 and $272 million in 2023 for matching contributions based on the amount of employee contributions under the U.S. qualified defined contribution and non-qualified deferred compensation plans. The matching contribution in the U.S. qualified defined contribution plan was reduced from March 1 through December 31, 2023, increased from January 1 through December 31, 2024, and decreased beginning January 1, 2025.
U.S. Retiree Medical Plan
Upon retirement, we provide certain benefits to eligible U.S. employees who were hired prior to 2014 under the U.S. Retiree Medical Plan. The benefits can be used to pay all or a portion of the cost to purchase eligible coverage in a medical plan.
As of December 27, 2025 and December 28, 2024, the projected benefit obligations were $505 million and $493 million, which used the discount rates of 5.3% and 5.7%. The December 27, 2025 and December 28, 2024 corresponding fair values of plan assets were $549 million and $542 million. As of December 27, 2025 and December 28, 2024, the U.S. Retiree Medical Plan was in the net asset position.
The investment strategy for U.S. Retiree Medical Plan assets is to invest primarily in liquid assets, due to the level of expected future benefit payments. The assets are invested in tax-aware global equity and fixed-income long credit portfolios. Both portfolios are actively managed by external managers. The tax-aware global equity portfolio is composed of a diversified mix of equities in developed countries.
| | | | | | | | | | | |
| Financial Statements | Notes to Consolidated Financial Statements | 97 |
The tax-aware fixed-income long credit portfolio is composed of domestic securities. The allocation to each asset class will fluctuate with market conditions, such as volatility and liquidity concerns, and will typically be rebalanced when outside the target ranges, which are 50% equity and 50% fixed-income investments. As of December 27, 2025 a significant amount (majority amount as of December 28, 2024) of the U.S. Retiree Medical Plan assets were invested in exchange-traded equity securities and were measured at fair value using Level 1 inputs. The remaining U.S. Retiree Medical Plan assets were invested in fixed-income investments and were measured at fair value using Level 2 inputs.
As of December 27, 2025, the estimated benefit payments for this plan over the next 10 years are as follows:
| | | | | | | | | | | | | | | | | | | | | | | | | | | | | | | | | | | | | | |
| (In Millions) | | 2026 | | 2027 | | 2028 | | 2029 | | 2030 | | 2031-2035 |
| Postretirement medical benefits | | $ | 47 | | | $ | 46 | | | $ | 46 | | | $ | 45 | | | $ | 44 | | | $ | 208 | |
Pension Benefit Plans
We provide defined-benefit pension plans in certain countries, most significantly Ireland, the U.S., Israel and Germany. The majority of the plans' benefits have been frozen.
Benefit Obligation and Plan Assets for Pension Benefit Plans
The vested benefit obligation for a defined-benefit pension plan is the actuarial present value of the vested benefits to which the employee is currently entitled based on the employee's expected date of separation or retirement.
| | | | | | | | | | | | | | |
Years Ended (In Millions) | | Dec 27, 2025 | | Dec 28, 2024 |
Changes in projected benefit obligation for pension benefit plans: | | | | |
| Beginning projected benefit obligation | | $ | 2,646 | | | $ | 2,825 | |
| Service cost | | 35 | | | 33 | |
| Interest cost | | 124 | | | 122 | |
| Actuarial (gain) loss | | (137) | | | (40) | |
| Currency exchange rate changes | | 249 | | | (107) | |
| | | | |
| Plan curtailments | | (12) | | | (4) | |
| Plan settlements | | (182) | | | (143) | |
| Other | | (66) | | | (40) | |
Ending projected benefit obligation1 | | 2,657 | | | 2,646 | |
| | | | |
Changes in fair value of plan assets for pension benefit plans: | | | | |
| Beginning fair value of plan assets | | 2,142 | | | 2,212 | |
| Actual return on plan assets | | 34 | | | 121 | |
| Currency exchange rate changes | | 178 | | | (74) | |
| | | | |
| Plan settlements | | (182) | | | (143) | |
| Other | | 26 | | | 26 | |
Ending fair value of plan assets2 | | 2,198 | | | 2,142 | |
| | | | |
Net unfunded status of pension benefit plans | | $ | 459 | | | $ | 504 | |
| | | | |
Amounts recognized in the Consolidated Balance Sheets: | | | | |
| Other long-term assets | | $ | 217 | | | $ | 135 | |
Current liabilities | | $ | 12 | | | $ | 7 | |
| Other long-term liabilities | | $ | 664 | | | $ | 632 | |
Accumulated other comprehensive loss (income), before tax3 | | $ | 240 | | | $ | 337 | |
| | | | |
| Accumulated benefit obligation | | $ | 2,479 | | | $ | 2,509 | |
1 The projected benefit obligation was approximately 30% in the U.S. and 70% outside of the U.S. as of December 27, 2025 and December 28, 2024.
2 The fair value of plan assets was approximately 35% in the U.S. and 65% outside of the U.S. as of December 27, 2025 (approximately 40% in the U.S. and 60% outside of the U.S. as of December 28, 2024).
3 The accumulated other comprehensive loss (income), before tax, was approximately 95% in the U.S. and 5% outside of the U.S. as of December 27, 2025 (approximately 80% in the U.S. and 20% outside of the U.S. as of December 28, 2024).
Changes in actuarial gains and losses in the projected benefit obligation are generally driven by discount rate movement. We use the corridor approach to amortize actuarial gains and losses. Under this approach, net actuarial gains or losses in excess of 10% of the larger of the projected benefit obligation or the fair value of plan assets are amortized on a straight-line basis over the average remaining service period of active plan participants.
| | | | | | | | | | | |
| Financial Statements | Notes to Consolidated Financial Statements | 98 |
As of December 27, 2025, the accumulated benefit obligations were $728 million and $1.8 billion for the U.S. plan and non-U.S. plans, respectively. As of December 28, 2024, the accumulated benefit obligations were $763 million and $1.7 billion for the U.S. plan and non-U.S. plans, respectively. As of December 27, 2025 and December 28, 2024, only non-U.S. plans had projected benefit obligations and accumulated benefit obligations in excess of plan assets.
| | | | | | | | | | | | | | |
(In Millions) | | Dec 27, 2025 | | Dec 28, 2024 |
| Plans with accumulated benefit obligation in excess of plan assets: | | | | |
| Accumulated benefit obligation | | $ | 888 | | | $ | 850 | |
| Plan assets | | $ | 366 | | | $ | 348 | |
| | | | |
| Plans with projected benefit obligation in excess of plan assets: | | | | |
| Projected benefit obligation | | $ | 1,042 | | | $ | 987 | |
| Plan assets | | $ | 366 | | | $ | 348 | |
Assumptions for Pension Benefit Plans
| | | | | | | | | | | | | | |
| | Dec 27, 2025 | | Dec 28, 2024 |
| Weighted average actuarial assumptions used to determine benefit obligations | | | | |
| Discount rate | | 4.8 | % | | 4.6 | % |
| Rate of compensation increase | | 3.8 | % | | 3.4 | % |
| | | | | | | | | | | | | | | | | | | | |
Years Ended | | Dec 27, 2025 | | Dec 28, 2024 | | Dec 30, 2023 |
| Weighted average actuarial assumptions used to determine costs | | | | | | |
| Discount rate | | 4.6 | % | | 4.5 | % | | 4.9 | % |
| Expected long-term rate of return on plan assets | | 4.8 | % | | 5.1 | % | | 5.0 | % |
| Rate of compensation increase | | 3.4 | % | | 3.3 | % | | 3.7 | % |
We establish the discount rate for each pension plan by analyzing current market long-term bond rates and matching the bond maturity with the average duration of the pension liabilities.
We establish the expected long-term rate of return on plan assets by developing a forward-looking, long-term return assumption for each pension fund asset class, taking into account factors such as the expected real return for the specific asset class and inflation. A single, long-term rate of return is then calculated as the weighted average of the target asset allocation percentages and the long-term return assumption for each asset class.
Funding
Our practice is to fund the various pension plans in amounts sufficient to meet the minimum requirements of applicable local laws and regulations. On a worldwide basis, our pension and retiree medical plans were 87% funded as of December 27, 2025. Funded status is not indicative of our ability to pay ongoing pension benefits or of our obligation to fund retirement trusts.
Net Periodic Benefit Cost
The net periodic benefit cost for pension and U.S. retiree medical benefits was $82 million in 2025 ($69 million in 2024 and $107 million in 2023).
Pension Plan Assets | | | | | | | | | | | | | | | | | | | | | | | | | | | | | | | | | | | | | | | | | | | | | | | | | | |
| | December 27, 2025 | | December 28, 2024 |
| | Fair Value Measurements | | | | Fair Value Measurements | | |
(In Millions) | | Level 1 | | Level 2 | | Level 3 | | Total | | Level 1 | | Level 2 | | Level 3 | | Total |
| Equity securities | | $ | — | | | $ | 259 | | | $ | — | | | $ | 259 | | | $ | — | | | $ | 344 | | | $ | — | | | $ | 344 | |
Fixed income investments | | — | | | 184 | | | 28 | | | 212 | | | — | | | 142 | | | 24 | | | 166 | |
| Assets measured by fair value hierarchy | | $ | — | | | $ | 443 | | | $ | 28 | | | $ | 471 | | | $ | — | | | $ | 486 | | | $ | 24 | | | $ | 510 | |
| Assets measured at net asset value | | | | | | | | 1,712 | | | | | | | | | 1,618 | |
| Cash and cash equivalents | | | | | | | | 15 | | | | | | | | | 14 | |
| Total pension plan assets at fair value | | | | | | | | $ | 2,198 | | | | | | | | | $ | 2,142 | |
| | | | | | | | | | | |
| Financial Statements | Notes to Consolidated Financial Statements | 99 |
U.S. Plan Assets
The investment strategy for U.S. Pension Plan assets is to manage the funded status volatility, taking into consideration the investment horizon and expected volatility to help enable sufficient assets to be available to pay pension benefits as they come due. The allocation to each asset class will fluctuate with market conditions, such as volatility and liquidity concerns, and will typically be rebalanced when outside the target ranges, which are 90% fixed income and 10% equity investments. During 2025 and 2024, the U.S. Pension Plan assets were invested in collective investment trust funds, which are measured at net asset value.
Non-U.S. Plan Assets
The investments of the non-U.S. plans are managed by insurance companies, pension funds or third-party trustees, consistent with regulations or market practice of the country where the assets are invested. The investment manager makes investment decisions within the guidelines set by Intel or local regulations. Investments managed by qualified insurance companies or pension funds under standard contracts follow local regulations, and we are not actively involved in their investment strategies. For the assets that we have the discretion to set investment guidelines, the assets are invested in developed country equity investments and fixed-income investments, either through index funds or direct investment. In general, the investment strategy is designed to accumulate a diversified portfolio among markets, asset classes or individual securities to reduce market risk and to help enable sufficient pension assets to be available to pay benefits as they come due. The equity investments in the non-U.S. plan assets are invested in a diversified mix of equities of developed countries, including the U.S., and emerging markets throughout the world. We have control over the investment strategy related to the majority of the assets measured at net asset value, which are invested in hedge funds, bond index funds and equity index funds. The target allocation of the non-U.S. plan assets that we have control over was approximately 60% fixed income, 30% equity and 10% hedge fund investments in 2025 (approximately 50% fixed income, 35% equity, and 15% hedge fund investments in 2024).
Estimated Future Benefit Payments for Pension Benefit Plans
As of December 27, 2025, estimated benefit payments over the next 10 years are as follows:
| | | | | | | | | | | | | | | | | | | | | | | | | | | | | | | | | | | | | | |
(In Millions) | | 2026 | | 2027 | | 2028 | | 2029 | | 2030 | | 2031-2035 |
| Pension benefits | | $ | 108 | | | $ | 97 | | | $ | 99 | | | $ | 108 | | | $ | 115 | | | $ | 668 | |
| | | | | |
| Note 18 : | Employee Equity Incentive Plans |
Our equity incentive plans are broad-based, long-term programs intended to attract and retain talented employees and align stockholder and employee interests. Our plans include our 2006 Plan and our 2006 ESPP.
Under the 2006 Plan, 1.2 billion shares of common stock have been authorized for issuance as equity awards to employees and non-employee directors through June 2027. As of December 27, 2025, 253 million shares of common stock remained available for future grants.
Under the 2006 Plan, we may grant RSUs and stock options. We grant RSUs with a service condition as well as RSUs with a market condition, performance condition and a service condition, which we call PSUs. PSUs are granted to a group of senior officers and employees.
For PSUs granted in 2025, the number of shares of our common stock to be received at vesting at the end of the three-year performance period will range from 0% to 200% of the target grant amount. The PSU payout will be determined based on the relative TSR compared to the S&P 500 index over a three-year performance period. The payout will be capped at the target grant amount if our absolute TSR is negative. TSR is a measure of stock price appreciation plus any dividends paid during the performance period.
For PSUs granted in 2024 and 2023, the number of shares of our common stock to be received at vesting at the end of the three-year performance period will range from 0% to 200% of the target grant amount. The PSU payout will be determined based on our performance (i) relative to annual targets for each year in the performance period with respect to a revenue growth metric, weighted 60% and a cash flow from operations metric, weighted 40%, which results are then averaged at the end of the three-year performance period; and (ii) as may be adjusted by two equally weighted modifiers: the TSR of our common stock measured against the benchmark TSR of above median of the S&P 500 Index over a three-year period and revenue CAGR for the three-year performance period. TSR is a measure of stock price appreciation plus any dividends paid during the performance period. For 2024 PSUs, overall payout will be capped at the target grant amount if our absolute TSR is negative; additionally, the combined modifiers applied to the payout are capped at +/-25%.
As of December 27, 2025, 8 million PSUs were outstanding. PSUs vest three years and one month following the start of the performance period. Other RSU awards and option awards generally vest over four years from the grant date.
| | | | | | | | | | | |
| Financial Statements | Notes to Consolidated Financial Statements | 100 |
Share-Based Compensation
Share-based compensation recognized in 2025 was $2.4 billion ($3.4 billion in 2024 and $3.2 billion in 2023). During 2025, the actual tax benefit that we realized for the tax deduction from share-based awards totaled $479 million ($684 million in 2024 and $571 million in 2023). We recognized a related tax expense of $141 million in 2025 ($139 million in 2024 and $110 million in 2023) for share-based awards as a result of the shortfall between the tax deduction being less than the associated deferred tax asset for the awards.
Restricted Stock Units and Performance Stock Units
Weighted average assumptions used in estimating grant values were as follows:
| | | | | | | | | | | | | | | | | | | | |
| | |
| Years Ended | | Dec 27, 2025 | | Dec 28, 2024 | | Dec 30, 2023 |
| Estimated values | | $ | 23.73 | | | $ | 39.51 | | | $ | 28.92 | |
| Risk-free interest rate | | 3.9 | % | | 4.7 | % | | 4.7 | % |
| Dividend yield | | — | % | | 1.2 | % | | 1.6 | % |
| Volatility | | 47 | % | | 36 | % | | 36 | % |
Summary of activities:
| | | | | | | | | | | | | | |
| | Number of Stock Units Outstanding (In Millions) | | Weighted Average Grant-Date Fair Value |
| Balance as of December 28, 2024 | | 117.4 | | | $ | 36.52 | |
| Granted | | 104.5 | | | $ | 23.73 | |
| Vested | | (65.9) | | | $ | 35.08 | |
| Forfeited | | (38.5) | | | $ | 29.89 | |
| Balance as of December 27, 2025 | | 117.5 | | | $ | 28.12 | |
| Expected to vest | 102.3 | | | $ | 28.25 | |
The aggregate fair value of awards that vested in 2025 was $1.7 billion ($2.4 billion in 2024 and $2.2 billion in 2023), which represents the market value of our common stock on the date that the RSUs vested. The grant-date fair value of awards that vested in 2025 was $2.3 billion ($3.4 billion in 2024 and $2.7 billion in 2023). The number of RSUs vested includes shares of common stock that we withheld on behalf of employees to satisfy the minimum statutory tax withholding requirements. RSUs that are expected to vest are net of estimated future forfeitures.
As of December 27, 2025, unrecognized compensation costs related to RSUs granted under our equity incentive plans were $2.2 billion. We expect to recognize those costs over a weighted average period of 1.2 years.
Stock Purchase Plan
The 2006 ESPP allows eligible employees to purchase shares of our common stock at 85% of the value of our common stock on specific dates. Under the 2006 ESPP, 523 million shares of common stock are authorized for issuance through August 2026. As of December 27, 2025, 83 million shares of common stock remained available for issuance.
Employees purchased 34 million shares of common stock in 2025 for $757 million under the 2006 ESPP (39 million shares of common stock for $972 million in 2024 and 43 million shares of common stock for $1.0 billion in 2023). As of December 27, 2025, unrecognized share-based compensation costs related to rights to acquire shares of common stock under the 2006 ESPP totaled $31 million. We expect to recognize those costs over a period of approximately two months.
| | | | | | | | | | | |
| Financial Statements | Notes to Consolidated Financial Statements | 101 |
| | | | | |
| Note 19 : | Commitments and Contingencies |
Leases
We recognized operating leased assets in other long-term assets of $421 million ($457 million in 2024) and corresponding other accrued liabilities of $110 million ($181 million in 2024), and other long-term liabilities of $281 million ($279 million in 2024) as of December 27, 2025. Our operating leases have remaining terms of 1 to 11 years and may include options to extend the leases for up to 36 years. The weighted average remaining lease term was 6.7 years (6.5 years in 2024), and the weighted average discount rate was 4.7% (4.9% in 2024) as of December 27, 2025 for our operating leases.
Operating lease expense was $212 million in 2025 ($248 million in 2024 and $407 million in 2023), including $100 million in variable lease expense in 2025 ($98 million in 2024 and $213 million in 2023).
We recognized finance leased assets in property, plant and equipment of $453 million as of December 27, 2025 ($470 million as of December 28, 2024) of which the majority is related to a prepaid finance lease for supplier capacity. This lease will commence upon start of supplier production and has a term of 6 years.
We incurred non-cash impairment charges of $48 million in 2025 on certain leased assets as a direct result of the 2025 and 2024 Restructuring Plans ($83 million in 2024 as a result of the 2024 Restructuring Plan; see "Note 7: Restructuring and Other Charges" within Notes to Consolidated Financial Statements). These charges were included within restructuring and other.
Discounted and undiscounted lease payments under non-cancelable leases as of December 27, 2025, were as follows:
| | | | | | | | | | | | | | | | | | | | | | | | | | | | | | | | | | | | | | | | | | | | |
| (In Millions) | | 2026 | | 2027 | | 2028 | | 2029 | | 2030 | | Thereafter | | Total |
| Operating lease payments | | $ | 94 | | | $ | 74 | | | $ | 63 | | | $ | 46 | | | $ | 45 | | | $ | 100 | | | $ | 422 | |
| Finance lease payments | | $ | 96 | | | $ | 6 | | | $ | 6 | | | $ | 3 | | | $ | 3 | | | $ | 19 | | | $ | 133 | |
| Present value of lease payments | | | | | | | | | | | | | | $ | 473 | |
Commitments
Commitments for capital expenditures totaled $12.8 billion as of December 27, 2025 ($20.0 billion as of December 28, 2024), a majority of which will be due within the next 12 months. Other purchase obligations and commitments totaled approximately $6.7 billion as of December 27, 2025 (approximately $7.0 billion as of December 28, 2024).
Other purchase obligations and commitments include payments due under supply agreements and various types of licenses and agreements to purchase goods or services. Contractual obligations for purchases of goods or services relate to agreements that are enforceable and legally binding and that specify all significant terms, including fixed or minimum quantities; fixed, minimum or variable price provisions; and the approximate timing of the transaction. Other purchase obligations reflect the non-cancelable portion or the minimum cancellation fee under the agreement.
Other purchase commitments also include our unrecognized commitment to fund our respective share of the total construction costs of Arizona SCIP in connection with the definitive agreement entered into with Brookfield during 2022 (refer to Note 4: Non-Controlling Interests" within Notes to Consolidated Financial Statements). Our remaining unfunded contribution was $5.2 billion as of December 27, 2025.
Legal Proceedings
We are regularly party to various ongoing claims, litigation, and other proceedings, including those noted in this section. As of December 27, 2025, we have accrued liabilities of $1.0 billion related to litigation involving VLSI and $311 million, including revaluation effects and accrued interest, related to an EC-imposed fine, both as described below. Excluding the VLSI claims described below, management at present believes that the ultimate outcome of these proceedings, individually and in the aggregate, will not materially harm our financial position, results of operations, cash flows, or overall trends; however, legal proceedings and related government investigations are subject to inherent uncertainties, and unfavorable rulings, excessive verdicts, or other events could occur. Unfavorable resolutions could include substantial monetary damages, fines, or penalties. Certain of these outstanding matters include speculative, substantial, or indeterminate monetary awards. In addition, in matters for which injunctive relief or other conduct remedies are sought, unfavorable resolutions could include an injunction or other order prohibiting us from selling one or more products at all or in particular ways, precluding particular business practices, or requiring other remedies. An unfavorable outcome may result in a material adverse impact on our business, results of operations, financial position, and overall trends. We might also conclude that settling one or more such matters is in the best interests of our stockholders, employees, and customers, and any such settlement could include substantial payments. Except as specifically described below, we have not concluded that settlement of any of the legal proceedings noted in this section is appropriate at this time.
| | | | | | | | | | | |
| Financial Statements | Notes to Consolidated Financial Statements | 102 |
European Commission Competition Matter
In 2009, the EC found that we had used unfair business practices to persuade customers to buy microprocessors in violation of Article 82 of the EC Treaty (later renumbered Article 102) and Article 54 of the European Economic Area Agreement. In general, the EC found that we violated Article 82 by offering alleged “conditional rebates and payments” that required customers to purchase all or most of their x86 microprocessors from us and by making alleged “payments to prevent sales of specific rival products.” The EC ordered us to end the alleged infringement referred to in its decision and imposed a €1.1 billion fine, which we paid in the third quarter of 2009.
We appealed the EC decision to the European Court of Justice in 2014, after the General Court (then called the Court of First Instance) rejected our appeal of the EC decision in its entirety. In September 2017, the Court of Justice sent the case back to the General Court to examine whether the rebates at issue were capable of restricting competition. In January 2022, the General Court annulled the EC's 2009 findings against us regarding rebates, as well as the €1.1 billion fine imposed on Intel, which was returned to us in February 2022. The General Court's January 2022 decision did not annul the EC's 2009 finding that we made payments to prevent sales of specific rival products.
In April 2022, the EC appealed the General Court's findings regarding rebates to the Court of Justice. In October 2024, the Court of Justice dismissed the EC's appeal, upholding the judgment of the General Court.
In September 2023, the EC imposed a €376 million ($401 million) fine against us based on its 2009 finding that we made payments to prevent sales of specific rival products. We appealed the EC's decision, and in December 2025 the General Court reduced the fine to €237 million ($277 million). Intel may appeal the General Court’s decision to the Court of Justice. We have reduced our previously accrued charge for the fine to approximately $311 million as of December 27, 2025, which includes foreign currency revaluation effects and accrued interest, and are unable to make a reasonable estimate of the potential loss or range of losses in excess of this amount given the procedural posture and the nature of these proceedings.
Litigation Related to Security Vulnerabilities
In June 2017, a Google research team notified Intel and other companies that it had identified security vulnerabilities, the first variants of which are now commonly referred to as “Spectre” and “Meltdown,” that affect many types of microprocessors, including our products. As is standard when findings like these are presented, we worked together with other companies in the industry to verify the research and develop and validate software and firmware updates for impacted technologies. In January 2018, information on the security vulnerabilities was publicly reported, before software and firmware updates to address the vulnerabilities were made widely available.
Consumer class action lawsuits are pending against us in the U.S. and Canada. The plaintiffs, who purport to represent various classes of purchasers of our products, generally claim to have been harmed by our actions and/or omissions in connection with Spectre, Meltdown, and other variants of this class of security vulnerabilities that have been identified since 2018, and assert a variety of common law and statutory claims seeking monetary damages and equitable relief. In the U.S., class action suits filed in various jurisdictions between 2018 and 2021 were consolidated for all pretrial proceedings in the U.S. District Court for the District of Oregon, which entered final judgment in favor of Intel in July 2022 based on plaintiffs' failure to plead a viable claim. The Ninth Circuit Court of Appeals affirmed the district court's judgment in November 2023, ending the litigation. In November 2023, new plaintiffs filed a consumer class action complaint in the U.S. District Court for the Northern District of California with respect to a further vulnerability variant disclosed in August 2023 and commonly referred to as “Downfall.” In August 2024, the district court dismissed plaintiffs' entire complaint for failure to plead a viable claim, with leave to amend. In August 2025, the district court dismissed with prejudice the nationwide class claims under California law in plaintiffs' amended complaint, and denied Intel's motion to dismiss subclass claims pleaded in the alternative under the laws of certain other states. In October 2025, the plaintiffs filed a second amended complaint, which Intel moved to dismiss in December 2025. In Canada, an initial status conference has not yet been scheduled in one case relating to Spectre and Meltdown pending in the Superior Court of Justice of Ontario, and a stay of a second case pending in the Superior Court of Justice of Quebec is in effect. Additional lawsuits and claims may be asserted seeking monetary damages or other related relief. Given the procedural posture and the nature of these cases, including that the pending proceedings are in the early stages, that alleged damages have not been specified, that uncertainty exists as to the likelihood of a class or classes being certified or the ultimate size of any class or classes if certified, and that there are significant factual and legal issues to be resolved, we are unable to make a reasonable estimate of the potential loss or range of losses, if any, that might arise from these matters.
| | | | | | | | | | | |
| Financial Statements | Notes to Consolidated Financial Statements | 103 |
Litigation Related to Segment Reporting and Internal Foundry Model
A securities class action lawsuit was filed in the U.S. District Court for the Northern District of California in May 2024 against us and certain officers following the modification of our segment reporting in the first quarter of 2024 to align to our new internal foundry operating model. In August 2024, the court ordered the case consolidated with a second, similar lawsuit, and in October 2024 plaintiffs filed an amended consolidated complaint generally alleging that defendants violated the federal securities laws by making false or misleading statements about the growth and prospects of the foundry business and seeking monetary damages on behalf of all persons and entities that purchased or otherwise acquired our common stock or purchased call options or sold put options on our common stock from January 25, 2024 through August 1, 2024. In March 2025, the court dismissed plaintiffs' amended consolidated complaint, finding that plaintiffs failed to plead any false or misleading statements by defendants. The court granted plaintiffs leave to amend, but in July 2025 dismissed plaintiffs' second amended complaint and entered judgment in defendants' favor, again finding that plaintiffs failed to plead any false or misleading statements. Plaintiffs have appealed. Given the procedural posture of the case, including that the plaintiffs have appealed the district court's decision, we are unable to make a reasonable estimate of the potential loss or range of losses, if any, that might arise from the matter.
Stockholder derivative lawsuits have been filed in Delaware state and federal courts alleging that our directors and certain officers breached their fiduciary duties and violated the federal securities laws by making or allowing the statements that are challenged in the securities class action lawsuit. The plaintiffs in the derivative lawsuits seek to recover damages from the defendants on behalf of Intel. The cases are stayed pending developments in the securities class action lawsuit.
Litigation Related to Patent and IP Claims
We have had IP infringement lawsuits filed against us, including but not limited to those discussed below. Most involve claims that certain of our products, services, and technologies infringe others' IP rights. Adverse results in these lawsuits may include awards of substantial fines and penalties, costly royalty or licensing agreements, or orders preventing us from offering certain features, functionalities, products, or services. As a result, we may have to change our business practices, and develop non-infringing products or technologies, which could result in a loss of revenue for us and otherwise harm our business. In addition, certain agreements with our customers require us to indemnify them against certain IP infringement claims, which can increase our costs as a result of defending such claims, and may require that we pay significant damages, accept product returns, or supply our customers with non-infringing products if there were an adverse ruling in any such claims. In addition, our customers and partners may discontinue the use of our products, services, and technologies, as a result of injunctions or otherwise, which could result in loss of revenue and adversely affect our business.
VLSI Technology LLC v. Intel
In October 2017, VLSI Technology LLC (VLSI) filed a complaint against us in the U.S. District Court for the Northern District of California alleging that various Intel FPGA and processor products infringe eight patents VLSI acquired from NXP Semiconductors, N.V. (NXP). VLSI sought damages, attorneys' fees, costs, and interest. Intel prevailed on all eight patents and the court entered final judgment in April 2024. VLSI appealed the Court's judgment of non-infringement as to one of the eight patents. That appeal is set for oral argument before the Federal Circuit Court of Appeals in February 2026. In April 2019, VLSI filed three infringement suits against us in the U.S. District Court for the Western District of Texas accusing various of our processors of infringement of eight additional patents it had acquired from NXP:
▪The first Texas case went to trial in February 2021, and the jury awarded VLSI $1.5 billion for literal infringement of one patent and $675 million for infringement of another patent under the doctrine of equivalents. In April 2022, the court entered final judgment, awarding VLSI $2.2 billion in damages and approximately $162 million in pre-judgment and post-judgment interest. We appealed the judgment to the Federal Circuit Court of Appeals, including the court's rejection of Intel's claim to have a license from Fortress Investment Group's acquisition of Finjan. The Federal Circuit Court heard oral argument in October 2023. In December 2023, the Federal Circuit reversed the finding of infringement as to the patent for which VLSI was awarded $675 million. The Federal Circuit affirmed the finding of infringement as to the patent for which VLSI had been awarded $1.5 billion, but vacated the damages award and sent the case back to the trial court for further damages proceedings on that patent. The Federal Circuit also ruled that Intel can advance the defense that it is licensed to VLSI's patents. In December 2021 and January 2022 the Patent Trial and Appeal Board (PTAB) instituted Inter Partes Reviews (IPR) on the claims found to have been infringed in the first Texas case, and in May and June 2023 found all of those claims unpatentable; VLSI has appealed the PTAB's decisions. In April 2024, Intel moved to add the defense that it is licensed to VLSI's patents. The motion remains pending.
▪The second Texas case went to trial in April 2021, and the jury found that we do not infringe the asserted patents. VLSI had sought approximately $3.0 billion for alleged infringement, plus enhanced damages for willful infringement. In September 2024, the court denied VLSI's motion for a new trial. Other post-trial motions remain pending, and the court has not yet entered final judgment.
| | | | | | | | | | | |
| Financial Statements | Notes to Consolidated Financial Statements | 104 |
▪The third Texas case went to trial in November 2022, with VLSI asserting one remaining patent. The jury found the patent valid and infringed, and awarded VLSI approximately $949 million in damages, plus interest and a running royalty. The court has not yet entered final judgment. In February 2023, we filed motions for a new trial and for judgment as a matter of law notwithstanding the verdict on various grounds. Further appeals are possible. In April 2024, Intel moved to add the defense that it is licensed to VLSI's patents, and the court granted Intel's motion that same month. In May 2025, the court held a trial on an underlying factual question relating to Intel’s license defense. The jury returned a verdict in Intel's favor. Post-trial briefing is complete, and the court will address the ultimate legal issue of whether Intel obtained a license to the asserted VLSI patent through Intel’s license agreement with Finjan when Fortress Investments acquired Finjan.
In May 2019, VLSI filed a case in Shenzhen Intermediate People's Court against Intel, Intel (China) Co., Ltd., Intel Trading (Shanghai) Co., Ltd., and Intel Products (Chengdu) Co., Ltd. VLSI asserted one patent against certain Intel Core processors. Defendants filed an invalidation petition in October 2019 with the China National Intellectual Property Administration (CNIPA) which held a hearing in September 2021. The Shenzhen court held trial proceedings in July 2021 and September 2023. VLSI sought an injunction as well as RMB 1.3 million in costs and expenses, but no damages. In September 2023, the CNIPA invalidated every claim of the asserted patent. In November 2023, the trial court dismissed VLSI's case.
In May 2019, VLSI filed a case in Shanghai Intellectual Property Court against Intel (China) Co., Ltd., Intel Trading (Shanghai) Co., Ltd., and Intel Products (Chengdu) Co., Ltd. asserting one patent against certain Intel Core processors. The Shanghai court held trial hearings in December 2020 and in May 2022, where VLSI requested expenses (RMB 300 thousand) and an injunction. In October 2023, the Shanghai court issued a decision finding no infringement and dismissing all claims. In November 2023, VLSI appealed the finding of non-infringement to the Supreme People's Court. The Supreme People's Court held an evidentiary hearing in October 2024, and a trial in November 2024.
In parallel in December 2022, we had filed a petition to invalidate the patent at issue in the Shanghai proceeding. In February 2024, the patent was found not invalid, and Intel appealed the decision in May 2024. After the Beijing Intellectual Property Court upheld the validity of the patent in May 2025, we filed a further appeal to the Supreme People’s Court in June 2025. Both VLSI’s appeal of the noninfringement decision and our appeal of the validity decision before the Supreme People’s Court remain pending.
In July 2024, Intel filed suit against VLSI in U.S. District Court for the District of Delaware requesting the court find Intel is licensed to VLSI's patents. In September 2024, VLSI filed motions requesting that Intel's complaint be dismissed, transferred, or stayed. In December 2024, the Delaware court stayed the case and deferred the pending motions until May 31, 2025. The Delaware court has not taken further action and continues to receive status reports from the parties regarding the Texas court's consideration of Intel's license defense.
As of December 27, 2025, we have accrued a charge of approximately $1.0 billion related to the VLSI litigation. We are unable to make a reasonable estimate of losses in excess of recorded amounts.
Eire Og Innovations v IBM et. al.
Since April 2024, EireOg Innovations Ltd. has filed eleven separate complaints in the Eastern and Western Districts of Texas against Intel and AMD customers alleging that various products with Intel and AMD CPUs infringe numerous patents. EireOg seeks compensatory damages, future royalties, attorneys’ fees, costs, and interest. Intel is indemnifying Acer, Amazon Web Services (AWS), Cisco, Dell, HPE, HPI, IBM, Lenovo, and Oracle in connection with Intel CPUs accused of infringing four patents. Cisco and IBM filed their answers in June 2024. In these cases, a Markman hearing is scheduled for August 2025, and trial is scheduled for February 2026. Dell and Oracle filed their answers in June and September 2024, respectively. The Markman hearing in those matters was held in May 2025, and trial is scheduled for June 2026. Lenovo filed a motion to dismiss for lack of jurisdiction in July 2024, which was denied, and it subsequently filed an answer in October 2024. HPE filed its answer in July 2024. Trial in the Lenovo and HPE matters is scheduled for March 2026. AWS moved to dismiss the complaint in June 2025, and EireOg responded with an amended complaint. AWS filed a motion to dismiss the amended complaint in July 2025, which was denied, and it subsequently filed an answer in October 2025. The Markman hearing in the AWS matter is scheduled for December 2025, and trial is scheduled for December 2026. In September 2025, EireOg filed joint motions to dismiss the claims against Acer and HPI without prejudice. Given the procedural posture and the nature of these cases, including that the pending proceedings are in the early stages, that alleged damages have not been specified, and that there are significant factual and legal issues to be resolved, we are unable to make a reasonable estimate of the potential loss or range of losses, if any, that might arise from these matters.
Media Content Protection v Intel
In September 2020, Koninklijke Philips N.V. and Philips North America LLC (collectively, Philips) filed against Intel and customers in the U.S. District Court for the District of Delaware and the International Trade Commission (ITC). Philips alleged that certain Intel digital video-capable integrated circuits and associated firmware infringed two of its patents, including integrated circuits and associated firmware incorporated into products sold by Dell Technologies, Inc., HP Inc., Lenovo Group Ltd., and LG Electronics Inc. In March 2022, the ITC issued a final determination concluding that Philips had not proven a violation. Philips did not appeal the ITC’s decision, and a stay of the Delaware cases was lifted. Philips then sold the asserted patents to Media Content Protection (MCP) in July 2024, and MCP substituted in as the plaintiff. Trial was set for January 2026. MCP seeks $66 million to $398 million in damages for royalties between the 2020 case filing and the 2023 patent expiration date. In November 2025, the court granted Intel’s motion for summary judgment of invalidity of both patents and issued a final judgment in favor of Intel in December 2025. MCP has appealed. Given the procedural posture and the nature of this case, including that there are significant factual and legal issues to be resolved, we are unable to make a reasonable estimate of the potential loss or range of losses, if any, that might arise from this matter.
| | | | | | | | | | | |
| Financial Statements | Notes to Consolidated Financial Statements | 105 |
We use terms throughout our document that are specific to Intel or that are abbreviations that may not be commonly known or used. Below is a list of these terms used in our document.
| | | | | | | | |
| Term | | Definition |
| | |
| 2006 ESPP | | 2006 Employee Stock Purchase Plan |
| 2006 Plan | | 2006 Equity Incentive Plan |
| | |
| | |
| | |
| | |
| | |
| | |
| | |
| | |
| 2024 Restructuring Plan | | Cost and capital reduction initiatives approved by management, the board of directors or the Audit & Finance Committee of the board of directors designed to adjust spending to current business trends and achieve objectives announced in Q3 2024 with respect to reducing operating expenses, reducing capital expenditures and reducing cost of sales while enabling Intel's new operating model and continuing to fund investments in Intel's core strategy |
| 2025 Restructuring Plan | | Transformational initiative announced and subsequently approved in Q2 2025 by our management to lower expenses, streamline our organizational structure and reduce management layers across functions while reallocating resources toward our core client and server businesses by reducing investment in lower-priority programs and initiatives |
| 5G | | The fifth-generation mobile network, which brings dramatic improvements in network speeds and latency, and which we view as a transformative technology and opportunity for many industries |
| | |
| | |
| AI | | Artificial intelligence |
| AI PC | | Artificial intelligence personal computer |
| Altera | | Altera Corporation, a business offering programmable semiconductors, primarily FPGAs, and related products for a broad range of applications. |
| | |
| | |
| | |
| AMD | | Advanced Micro Devices, Inc. |
| AMIC | | Advanced Manufacturing Investment Credit |
| Apollo | | Apollo Global Management, Inc. |
| Apple | | Apple Inc. |
| ARM | | Advanced RISC machine |
| | |
| ASIC | | Application-specific integrated circuit |
| | |
| ASP | | Average selling price |
| | |
| | |
| | |
| | |
| | |
| BEPS | | Base erosion and profit shifting |
| | |
| Broadcom | | Broadcom Inc. |
| Brookfield | | Brookfield Asset Management |
| CAGR | | Compound annual growth rate |
| CCG | | Client Computing Group operating segment |
| CDP | | A nonprofit organization that runs a global disclosure system for investors, companies, cities, states, and regions to manage their environmental impacts |
| CEO | | Chief executive officer |
| CHIPS Act | | Creating Helpful Incentives to Produce Semiconductors for America Act |
| CIO | | Chief Information Officer |
| CISO | | Chief Information Security Officer |
| | |
| | |
| | |
| CODM | | Chief operating decision maker |
| | |
| | |
| | |
| | |
| COVID-19 | | The infectious disease caused by coronavirus (aka SARS-CoV-2), which was declared a global pandemic by the World Health Organization |
| CPU | | Processor or central processing unit |
| | |
| | |
| | |
| | |
| CSP | | Cloud service provider |
| CTO | | Chief Technology Officer |
| | |
| DCAI | | Data Center and Artificial Intelligence operating segment |
| | |
| | |
| DOC | | U.S. Department of Commerce |
| EC | | European Commission |
| | |
| EDA | | Electronic design automation, tools used to design and verify electronic systems, such as integrated circuits and printed circuit boards |
| | |
| | |
| | |
| EMIB | | Embedded multi-die interconnect bridge, a form of "2.5D" packaging technology developed by Intel that enables high-density interconnect of heterogeneous chips |
| | |
| | |
| | |
| EPS | | Earnings per share |
| | | | | | | | |
| Escrowed Shares | | Shares of Intel common stock held in escrow to be released to the U.S. Department of Commerce (DOC) as we perform and receive cash proceeds in connection with our CHIPS Act Secure Enclave agreement with the U.S. Government. If Escrowed Shares are not released from escrow at the end of the performance period, half of the shares will be released to the DOC with no consideration and the other half will be forfeited and cancelled. |
| ESG | | Environmental, social, and governance |
| | |
| | |
| EU | | European Union |
| EUV | | Extreme ultraviolet lithography |
| Exchange Act | | Securities Exchange Act of 1934 |
| | |
| | |
| | |
| | |
| Fab | | Semiconductor manufacturing / wafer fabrication facilities |
| 2024 Form 10-K | | Annual Report on Form 10-K for the year ended December 28, 2024 |
| FPGA | | Field-programmable gate array |
| | |
| | |
| | |
| GPU | | Graphics processing unit |
GlobalFoundries | | GlobalFoundries Inc. |
GRI | | Global Reporting Initiative |
| | |
| | |
| High-NA EUV | | High Numerical Aperture Extreme Ultraviolet |
| HPC | | High-performance computing |
| IDM | | Integrated device manufacturer, a semiconductor company that both designs and builds chips |
| | |
| Intel | | Intel Corporation |
| | |
| | |
| | |
| | |
| | |
| | |
| | |
| | |
| IMS | | IMS Nanofabrication GmbH, a business within Intel Foundry that develops and produces electron-beam systems for the semiconductor industry |
| Internet of Things | | Internet of Things market in which certain Intel and Mobileye products are sold |
| | |
| | |
| | |
| | |
| IP | | Intellectual property |
| | |
| | |
|
| | |
| | |
| IPO | | Initial public offering |
| IPU | | Infrastructure processing unit, a programmable networking device designed to enable cloud and communication service providers to reduce overhead and free up performance for CPUs |
| | |
| | |
| | |
| | |
| | |
| | |
| | |
| | |
| | |
| | |
| MaaS | | Mobility as a service |
| | |
| | |
| MD&A | | Management's Discussion and Analysis |
| | |
| Mentee Robotics | | Mentee Robotics Ltd. |
| MG&A | | Marketing, general, and administrative |
| | |
| | |
| | |
| NAND | | NAND flash memory |
| | |
| | |
| NEX | | Networking and Edge operating segment |
| | |
| nm | | Nanometer |
| | |
| | |
| NPU | | Neural processing unit |
| NVIDIA | | NVIDIA Corporation |
| ODM | | Original design manufacturer |
| OECD | | Organization for Economic Co-operation and Development |
| OEM | | Original equipment manufacturer |
| oneAPI | | Open, cross-architecture programming model that frees developers to use a single code base across multiple architectures |
| | |
| | |
| | |
| | |
| | |
| | |
| | |
| | |
| | |
| | |
| | |
| PC | | Personal computer |
| PowerVia | | Intel's backside power delivery technology that routes power connections to the back side of the chip through dedicated vias, separating power delivery from signal routing to reduce congestion, improve power efficiency, and enable better chip performance and design flexibility in advanced manufacturing nodes. |
| PSU | | Performance stock unit |
| | |
| | |
| | |
| | |
| | |
| | |
| | |
| Qualcomm | | Qualcomm, Inc. |
| R&D | | Research and development |
| RDFV | | Readily determinable fair value |
| | |
| | |
| | |
| RibbonFET | | A Gate-All-Around (GAA) transistor technology developed by Intel that uses ribbon-shaped semiconductor nanosheets completely surrounded by the gate electrode. |
| RISC-V | | Reduced Instruction Set Computer, version five |
| RSU | | Restricted stock unit |
| | |
| | |
| | |
| | |
| | |
| | |
| | |
| SASB | | Sustainability Accounting Standards Board |
| SCIP | | Semiconductor Co-Investment Program |
| SEC | | U.S. Securities and Exchange Commission |
| | |
| | |
| Secure Enclave | | Secure Enclave program under the CHIPS Act |
| Semiconductor Logic Chip | | The "brain" of electronic devices, processing information to complete tasks |
| | | | | | | | |
| SK hynix | | SK hynix Inc. |
| SLP | | Silver Lake Partners |
| SMIC | | Semiconductor Manufacturing International Corporation |
| Semiconductor Process Technology | | Processes and technologies applied in the production of semiconductor logic chips |
| | |
| SoC | | System on a chip, which integrates most of the components of a computer or other electronic system into a single silicon chip. We offer a range of SoC products across many market segments for a variety of applications. |
| | |
| | |
| SoftBank Group | | SoftBank Group Corp |
| SOFR | | Secured Overnight Financing Rate, a benchmark interest rate for US-dollar-denominated derivatives and loans, replacing LIBOR |
| | |
| Systems foundry | | A service provider that offers end-to-end semiconductor manufacturing and design solutions |
| TAM | | Total addressable market |
| Tax Reform | | U.S. Tax Cuts and Jobs Act |
| TCFD | | Task Force on Climate-Related Financial Disclosures |
| | |
| | |
| | |
| | |
| | |
| | |
| Tower | | Tower Semiconductor Ltd |
| TSR | | Total stockholder return |
| | |
| | |
| | |
| | |
| | |
| UMC | | United Microelectronics Corporation |
| U.S. | | United States |
| U.S. GAAP | | U.S. Generally Accepted Accounting Principles |
| | |
| | |
| U.S. Retiree Medical Plan | | U.S. Postretirement Medical Benefits Plan |
| | |
| VIE | | Variable interest entity |
| | |
| | |
| | |
| | |
| xPU | | Processors that are designed for one of four major computing architectures: CPU, GPU, AI accelerator, and FPGA |
Inherent Limitations on Effectiveness of Controls Our management, including our principal executive officer and principal financial officer, does not expect that our disclosure controls and procedures or our internal control over financial reporting will prevent or detect all errors and all fraud. A control system, no matter how well-designed and operated, can provide only reasonable, not absolute, assurance that the control system's objectives will be met. The design of a control system must reflect the fact that there are resource constraints, and the benefits of controls must be considered relative to their costs. Further, because of the inherent limitations in all control systems, no evaluation of controls can provide absolute assurance that misstatements due to error or fraud will not occur or that all control issues and instances of fraud, if any, have been detected.
Evaluation of Disclosure Controls and Procedures
Based on management's evaluation (with the participation of our principal executive officer and principal financial officer), as of the end of the period covered by this report, our principal executive officer and principal financial officer have concluded that our disclosure controls and procedures (as defined in Rules 13a-15(e) and 15d-15(e) under the Exchange Act) were effective to provide reasonable assurance that information required to be disclosed by us in reports that we file or submit under the Exchange Act is recorded, processed, summarized and reported within the time periods specified in SEC rules and forms, and is accumulated and communicated to management, including our principal executive officer and principal financial officer, as appropriate, to allow timely decisions regarding required disclosure.
Changes in Internal Control Over Financial Reporting
There were no changes to our internal control over financial reporting (as defined in Rules 13a-15(f) and 15d-15(f) under the Exchange Act) that occurred during the quarter ended December 27, 2025 that have materially affected, or are reasonably likely to materially affect, our internal control over financial reporting.
Management Report on Internal Control Over Financial Reporting
Our management is responsible for establishing and maintaining adequate internal control over financial reporting (as defined in Rules 13a-15(f) and 15d-15(f) under the Exchange Act) to provide reasonable assurance regarding the reliability of our financial reporting and the preparation of Consolidated Financial Statements for external purposes in accordance with U.S. GAAP.
Management assessed our internal control over financial reporting as of December 27, 2025. Management based its assessment on criteria established in Internal Control—Integrated Framework issued by the Committee of Sponsoring Organizations of the Treadway Commission (2013 framework). Management's assessment included evaluation of elements such as the design and operating effectiveness of key financial reporting controls, process documentation, accounting policies and our overall control environment.
Based on this assessment, management has concluded that our internal control over financial reporting was effective as of the end of the fiscal year to provide reasonable assurance regarding the reliability of financial reporting and the preparation of Consolidated Financial Statements for external reporting purposes in accordance with U.S. GAAP. We reviewed the results of management's assessment with the Audit Committee of our Board of Directors.
Our independent registered public accounting firm, Ernst & Young LLP, independently assessed the effectiveness of the company's internal control over financial reporting, as stated in the firm's attestation report, which is included within Financial Statements and Supplemental Details.
1.Financial Statements: See "Index to Consolidated Financial Statements" within the Consolidated Financial Statements.
2.Financial Statement Schedules: Not applicable or the required information is otherwise included in the Consolidated Financial Statements and accompanying notes.
3.Exhibits: The exhibits listed in the accompanying index to exhibits are filed, furnished or incorporated by reference as part of this Form 10-K.
Certain of the agreements filed as exhibits to this Form 10-K contain representations and warranties by the parties to the agreements that have been made solely for the benefit of the parties to the agreement. These representations and warranties:
▪may have been qualified by disclosures that were made to the other parties in connection with the negotiation of the agreements, which disclosures are not necessarily reflected in the agreements;
▪may apply standards of materiality that differ from those of a reasonable investor; and
▪were made only as of specified dates contained in the agreements and are subject to subsequent developments and changed circumstances.
Accordingly, these representations and warranties may not describe the actual state of affairs as of the date that these representations and warranties were made or at any other time. Investors should not rely on them as statements of fact.
Exhibit Index
| | | | | | | | | | | | | | | | | | | | | | | | | | | | | | | | | | | | | | |
Exhibit Number | | | | Incorporated by Reference | | Filed or
Furnished
Herewith |
Exhibit Description | | Form | | File Number | | Exhibit | | Filing Date | |
| 2.1 | | | | 10-Q | | 000-06217 | | 10.1 | | | 7/24/2025 | | |
| 2.2 | | | | 8-K | | 000-06217 | | 10.1 | | | 8/14/2025 | | |
| 3.1 | | | | 10-Q | | 000-06217 | | 3.1 | | | 10/27/2023 | | |
| 3.2 | | | | 8-K | | 000-06217 | | 3.2 | | | 12/5/2023 | | |
| 4.1 | | | | S-3ASR | | 333-132865 | | 4.4 | | | 3/30/2006 | | |
| 4.2 | | | | 10-K | | 000-06217 | | 4.2.4 | | 2/20/2008 | | |
| 4.3 | | | | 8-K | | 000-06217 | | 4.01 | | | 9/19/2011 | | |
| 4.4 | | | | 8-K | | 000-06217 | | 4.01 | | | 12/11/2012 | | |
| 4.5 | | | | 8-K | | 000-06217 | | 4.01 | | | 12/14/2012 | | |
| 4.6 | | | | 8-K | | 000-06217
| | 4.1 | | | 7/29/2015 | | |
| 4.7 | | | | 8-K | | 000-06217 | | 4.1 | | | 5/19/2016 | | |
| 4.8 | | | | 8-K | | 000-06217 | | 4.1 | | | 5/11/2017 | | |
| 4.9 | | | | 8-K | | 000-06217 | | 4.1 | | | 6/16/2017 | | |
| 4.10 | | | | 8-K | | 000-06217 | | 4.1 | | | 8/14/2017 | | |
| | | | | | | | | | | | | | | | | | | | | | | | | | | | | | | | | | | | | | |
Exhibit Number | | | | Incorporated by Reference | | Filed or
Furnished
Herewith |
Exhibit Description | | Form | | File Number | | Exhibit | | Filing Date | |
| 4.11 | | | | 10-K | | 000-06217 | | 4.2.13 | | 2/16/2018 | | |
| 4.12 | | | | 8-K | | 000-06217 | | 4.1 | | | 11/21/2019 | | |
| 4.13 | | | | 8-K | | 000-06217 | | 4.1 | | 2/13/2020 | | |
| 4.14 | | | | 8-K | | 000-06217 | | 4.2 | | | 2/13/2020 | | |
| 4.15 | | | | 8-K | | 000-06217 | | 4.1 | | | 3/25/2020 | | |
| 4.16 | | | | 8-K | | 000-06217 | | 4.1 | | | 8/12/2021 | | |
| 4.17 | | | | 8-K | | 000-06217 | | 4.1 | | | 8/5/2022 | | |
| 4.18 | | | | 8-K | | 000-06217 | | 4.1 | | | 2/10/2023 | | |
| 4.19 | | | | 8-K | | 000-06217 | | 4.1 | | | 2/21/2024 | | |
| 4.20 | | | | 10-K | | 000-06217 | | 4.18 | | | 1/27/2022 | | |
10.1† | | | | S-8 | | 000-06217 | | 99.1 | | | 11/7/2025 | | |
10.1.2†
| | | | 10-Q | | 000-06217 | | 10.1 | | | 10/25/2018 | | |
10.1.3†
| | | | 10-Q | | 000-06217 | | 10.3 | | | 4/26/2019 | | |
10.1.4†
| | | | 10-Q | | 000-06217 | | 10.4 | | | 4/26/2019 | | |
| | | | | | | | | | | | | | | | | | | | | | | | | | | | | | | | | | | | | | |
Exhibit Number | | | | Incorporated by Reference | | Filed or
Furnished
Herewith |
Exhibit Description | | Form | | File Number | | Exhibit | | Filing Date | |
10.1.5†
| | | | 10-Q | | 000-06217 | | 10.5 | | | 4/26/2019 | | |
10.1.6†
| | | | 10-Q | | 000-06217 | | 10.1 | | 4/24/2020 | | |
10.1.7† | | | | 10-Q | | 000-6217 | | 10.3 | | | 10/28/2022 | | |
10.2† | | | | 8-K | | 000-06217 | | 10.1 | | | 1/22/2020 | | |
10.3† | | | | 10-Q | | 000-06217 | | 10.3 | | 4/24/2020 | | |
10.4† | | | | 10-Q | | 000-06217 | | 10.1 | | | 7/29/2022 | | |
10.5† | | | | 10-K | | 000-06218 | | 10.5 | | | 1/27/2023 | | |
10.6† | | | | 10-K | | 000-06217 | | 10.6 | | | 1/31/2025 | | |
10.7† | | | | 10-K | | 000-06217 | | 10.41 | | | 2/26/2007 | | |
10.8† | | | | 10-K | | 000-06217 | | 10.15 | | | 2/22/2005 | | |
10.9† | | | | 10-Q | | 000-06217 | | 10.2 | | | 10/31/2016 | | |
| 10.10 | | | | 8-K | | 000-06217 | | 10.1 | | | 11/12/2009 | | |
10.11†† | | | | 8-K | | 000-06217 | | 10.1 | | | 1/10/2011 | | |
| 10.12^ | | | | 8-K | | 000-06217 | | 10.1 | | | 8/23/2022 | | |
| 10.13^ | | | | 8-K | | 000-06217 | | 10.1 | | | 11/22/2022 | | |
10.14^ | | | | 8-K | | 000-06217 | | 10.1 | | | 6/4/2024 | | |
| 10.15^ | | | | 8-K | | 000-06217 | | 10.2 | | | 6/4/2024 | | |
| | | | | | | | | | | | | | | | | | | | | | | | | | | | | | | | | | | | | | |
Exhibit Number | | | | Incorporated by Reference | | Filed or
Furnished
Herewith |
Exhibit Description | | Form | | File Number | | Exhibit | | Filing Date | |
10.16† | | | | 8-K | | 000-06217 | | 10.1 | | | 1/10/2022 | | |
10.17† | | | | | | | | | | | | X |
10.18† | | | | 8-K | | 000-06217 | | 10.1 | | 2/16/2024 | | |
10.19† | | | | 10-K | | 000-06217 | | 2.2 | | 1/31/2025 | | |
10.20† | | | | 8-K | | 000-06217 | | 10.1 | | 8/25/2025 | | |
10.21† | | | | 8-K | | 000-06217 | | 10.1 | | 8/29/2025 | | |
10.22† | | | | 10-K | | 000-06217 | | 10.20 | | 1/31/2025 | | |
10.23† | | | | 10-Q | | 000-06217 | | 10.3 | | 8/2/2024 | | |
10.24† | | | | 10-Q | | 000-06217 | | 10.1 | | 04/25/2025 | | |
10.25† | | | | 10-Q | | 000-06217 | | 10.2 | | 04/25/2025 | | |
10.26† | | | | 10-Q | | 000-06217 | | 10.3 | | 04/25/2025 | | |
10.27† | | | | 10-Q | | 000-06217 | | 10.4 | | 04/25/2025 | | |
10.28† | | | | 10-Q | | 000-06217 | | 10.5 | | 04/25/2025 | | |
10.29† | | | | 10-Q | | 000-06217 | | 10.6 | | 4/25/2025 | | |
10.30† | | | | 8-K | | 000-06217 | | 10.1 | | 2/28/2025 | | |
10.31† | | | | 8-K | | 000-06217 | | 10.1 | | 3/14/2025 | | |
10.32† | | | | 10-Q | | 000-06217 | | 10.2 | | 7/24/2025 | | |
10.33† | | | | 10-Q | | 000-06217 | | 10.4 | | 11/6/2025 | | |
| 19.1 | | | | | | | | | | | | X |
| 19.2 | | | | 10-K | | 000-06217 | | 19.2 | | 1/31/2025 | | |
| 21.1 | | | | | | | | | | | | X |
| | | | | | | | | | | | | | | | | | | | | | | | | | | | | | | | | | | | | | |
Exhibit Number | | | | Incorporated by Reference | | Filed or
Furnished
Herewith |
Exhibit Description | | Form | | File Number | | Exhibit | | Filing Date | |
| 23.1 | | | | | | | | | | | | X |
| 31.1 | | | | | | | | | | | | X |
| 31.2 | | | | | | | | | | | | X |
| 32.1 | | | | | | | | | | | | X |
97.1† | | | | 10-K | | 000-06217 | | 97.1 | | 1/26/2024 | | |
| 101 | | Inline XBRL Document Set for the Consolidated Financial Statements and accompanying notes in Financial Statements and Supplemental Details | | | | | | | | | | X |
| | | | | | | | | | | | |
| | | | | | | | | | | | |
| | | | | | | | | | | | |
| | | | | | | | | | | | |
| | | | | | | | | | | | |
| 104 | | Cover Page Interactive Data File - formatted in Inline XBRL and included as Exhibit 101
| | | | | | | | | | X |
† Management contracts or compensation plans or arrangements in which directors or executive officers are eligible to participate.
†† Portions of this exhibit have been omitted pursuant to an order granting confidential treatment.
^ Schedules and certain portions of this exhibit have been omitted pursuant to Item 601(a)(5)-(6) and Item 601(b)(10)(iv) of Regulation S-K.
| | | | | |
Form 10-K Cross-Reference Index | |
| |
| | | | | | | | |
| Item Number | Item | |
Part I | | |
| Item 1. | Business: | |
| General development of business | |
| | |
| Description of business | |
| | |
| Available information | |
| Item 1A. | Risk Factors | |
| Item 1B. | Unresolved Staff Comments | None |
Item 1C. | Cybersecurity | |
| Item 2. | Properties | |
| Item 3. | Legal Proceedings | |
| Item 4. | Mine Safety Disclosures | None |
| | |
Part II | | |
Item 5. | Market for Registrant's Common Equity, Related Stockholder Matters, and Issuer Purchases of Equity Securities | |
| Item 6. | [Reserved] | |
| Item 7. | Management's Discussion and Analysis of Financial Condition and Results of Operations: | |
| Liquidity and capital resources | |
| Results of operations | |
| | |
| | |
| | |
| Critical accounting estimates | |
| Item 7A. | Quantitative and Qualitative Disclosures About Market Risk | |
| Item 8. | Financial Statements and Supplementary Data | |
| Item 9. | Changes in and Disagreements with Accountants on Accounting and Financial Disclosure | None |
| Item 9A. | Controls and Procedures | |
| Item 9B. | Other Information | |
| Disclosure pursuant to Section 13(r) of the Securities Exchange Act of 1934 | |
| Item 9C. | Disclosure Regarding Foreign Jurisdictions that Prevent Inspections | None |
| | |
| Part III | | |
| Item 10. | Directors, Executive Officers, and Corporate Governance | |
| Item 11. | Executive Compensation | (a) |
| Item 12. | Security Ownership of Certain Beneficial Owners and Management and Related Stockholder Matters | (a) |
| Item 13. | Certain Relationships and Related Transactions, and Director Independence | (a) |
| Item 14. | Principal Accountant Fees and Services | (a) |
| | |
| Part IV | | |
| Item 15. | Exhibits and Financial Statement Schedules | |
| Item 16. | Form 10-K Summary | None |
| | |
| Signatures | | |
(a) Incorporated by reference to the applicable section of the 2026 Proxy Statement.
Pursuant to the requirements of Section 13 or 15(d) of the Securities Exchange Act of 1934, the Registrant has duly caused this report to be signed on its behalf by the undersigned, thereunto duly authorized.
| | | | | | | | | | | |
| INTEL CORPORATION
Registrant |
| | | |
| By: | | /s/ LIP-BU TAN |
| | | Lip-Bu Tan |
| | | Chief Executive Officer and Director (Principal Executive Officer) |
| | | January 22, 2026 |
Pursuant to the requirements of the Securities Exchange Act of 1934, this report has been signed below by the following persons on behalf of the Registrant and in the capacities and on the dates indicated. | | | | | | | | | | | | | | | | | |
| | | | | |
| /s/ LIP-BU TAN | | | /s/ DAVID ZINSNER | |
| Lip-Bu Tan Chief Executive Officer and Director (Principal Executive Officer) | | | David Zinsner Executive Vice President and Chief Financial Officer (Principal Financial Officer) | |
| January 22, 2026 | | | January 22, 2026 | |
| | | | | |
| | | | | |
| | | | | |
| | | | | |
| | | | | |
| | | | | |
| |
| /s/ SCOTT GAWEL |
| Scott Gawel |
| Corporate Vice President and Chief Accounting Officer (Principal Accounting Officer) |
| January 22, 2026 |
| |
| | | | | | | | | | | | | | |
| | | | |
| /s/ DR. CRAIG H. BARRATT | | | /s/ JAMES J. GOETZ |
| Dr. Craig H. Barratt | | | James J. Goetz |
| Director | | | Director |
| January 22, 2026 | | | January 22, 2026 |
| | | | |
| | | | |
| /s/ DR. ANDREA J. GOLDSMITH | | | /s/ ALYSSA HENRY |
| Dr. Andrea J. Goldsmith | | | Alyssa Henry |
| Director | | | Director |
| January 22, 2026 | | | January 22, 2026 |
| | | | |
| | | | |
| | | | |
| /s/ ERIC MEURICE | | | /s/ BARBARA G. NOVICK |
| Eric Meurice | | | Barbara G. Novick |
| Director | | | Director |
| January 22, 2026 | | | January 22, 2026 |
| | | | |
| | | | |
| /s/ STEVE SANGHI | | | /s/ GREGORY D. SMITH |
| Steve Sanghi | | | Gregory D. Smith |
| Director | | | Director |
| January 22, 2026 | | | January 22, 2026 |
| | | | |
| | | | |
| | | | |
| | | | |
| | | | |
| | | | |
| | | | |
| | | | |
| | | | |
| | | | |
| | | | |
| | | | |
| /s/ STACY J. SMITH | | | /s/ DION J. WEISLER |
| Stacy J. Smith | | | Dion J. Weisler |
| Director | | | Director |
| January 22, 2026 | | | January 22, 2026 |
| | | | |
| | | | |
| /s/ FRANK D. YEARY | | | |
| Frank D. Yeary | | | |
| Chair of the Board and Director | | | |
| January 22, 2026 | | | |
| | | | |