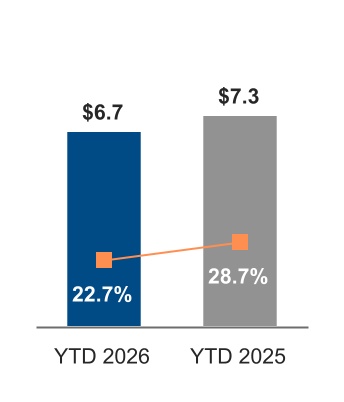
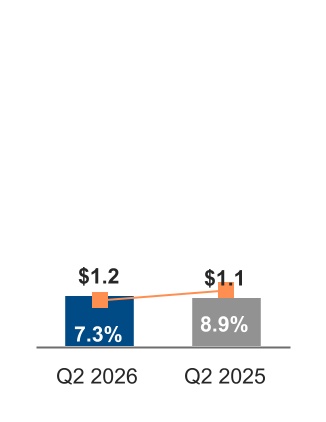
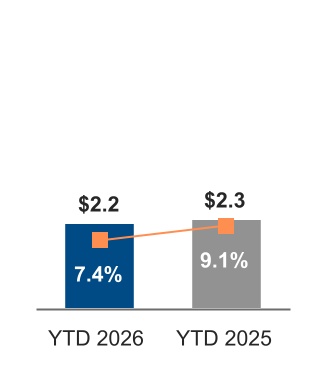
000005086312-262026Q2FALSEhttp://fasb.org/us-gaap/2026#AccountingStandardsUpdate202308Member0xbrli:sharesiso4217:USDiso4217:USDxbrli:sharesxbrli:pureintc:factoryiso4217:EURintc:patentintc:claimiso4217:CNY00000508632025-12-282026-06-2700000508632026-07-1700000508632026-03-292026-06-2700000508632025-03-302025-06-2800000508632024-12-292025-06-2800000508632026-06-2700000508632025-12-2700000508632024-12-2800000508632025-06-280000050863us-gaap:CommonStockIncludingAdditionalPaidInCapitalMember2026-03-280000050863us-gaap:AccumulatedOtherComprehensiveIncomeMember2026-03-280000050863us-gaap:RetainedEarningsMember2026-03-280000050863us-gaap:NoncontrollingInterestMember2026-03-2800000508632026-03-280000050863us-gaap:RetainedEarningsMember2026-03-292026-06-270000050863us-gaap:NoncontrollingInterestMember2026-03-292026-06-270000050863us-gaap:AccumulatedOtherComprehensiveIncomeMember2026-03-292026-06-270000050863us-gaap:CommonStockIncludingAdditionalPaidInCapitalMember2026-03-292026-06-270000050863us-gaap:CommonStockIncludingAdditionalPaidInCapitalMember2026-06-270000050863us-gaap:AccumulatedOtherComprehensiveIncomeMember2026-06-270000050863us-gaap:RetainedEarningsMember2026-06-270000050863us-gaap:NoncontrollingInterestMember2026-06-270000050863us-gaap:CommonStockIncludingAdditionalPaidInCapitalMember2025-03-290000050863us-gaap:AccumulatedOtherComprehensiveIncomeMember2025-03-290000050863us-gaap:RetainedEarningsMember2025-03-290000050863us-gaap:NoncontrollingInterestMember2025-03-2900000508632025-03-290000050863us-gaap:RetainedEarningsMember2025-03-302025-06-280000050863us-gaap:NoncontrollingInterestMember2025-03-302025-06-280000050863us-gaap:AccumulatedOtherComprehensiveIncomeMember2025-03-302025-06-280000050863us-gaap:CommonStockIncludingAdditionalPaidInCapitalMember2025-03-302025-06-280000050863us-gaap:CommonStockIncludingAdditionalPaidInCapitalMember2025-06-280000050863us-gaap:AccumulatedOtherComprehensiveIncomeMember2025-06-280000050863us-gaap:RetainedEarningsMember2025-06-280000050863us-gaap:NoncontrollingInterestMember2025-06-280000050863us-gaap:CommonStockIncludingAdditionalPaidInCapitalMember2025-12-270000050863us-gaap:AccumulatedOtherComprehensiveIncomeMember2025-12-270000050863us-gaap:RetainedEarningsMember2025-12-270000050863us-gaap:NoncontrollingInterestMember2025-12-270000050863us-gaap:RetainedEarningsMember2025-12-282026-06-270000050863us-gaap:NoncontrollingInterestMember2025-12-282026-06-270000050863us-gaap:AccumulatedOtherComprehensiveIncomeMember2025-12-282026-06-270000050863us-gaap:CommonStockIncludingAdditionalPaidInCapitalMember2025-12-282026-06-270000050863us-gaap:CommonStockIncludingAdditionalPaidInCapitalMember2024-12-280000050863us-gaap:AccumulatedOtherComprehensiveIncomeMember2024-12-280000050863us-gaap:RetainedEarningsMember2024-12-280000050863us-gaap:NoncontrollingInterestMember2024-12-280000050863srt:CumulativeEffectPeriodOfAdoptionAdjustmentMemberus-gaap:RetainedEarningsMember2024-12-280000050863srt:CumulativeEffectPeriodOfAdoptionAdjustmentMember2024-12-280000050863us-gaap:RetainedEarningsMember2024-12-292025-06-280000050863us-gaap:NoncontrollingInterestMember2024-12-292025-06-280000050863us-gaap:AccumulatedOtherComprehensiveIncomeMember2024-12-292025-06-280000050863us-gaap:CommonStockIncludingAdditionalPaidInCapitalMember2024-12-292025-06-2800000508632023-12-312024-12-280000050863intc:AssemblyAndTestMemberintc:IntelFoundryMember2026-03-292026-06-270000050863intc:AssemblyAndTestMemberintc:IntelFoundryMember2025-12-282026-06-270000050863intc:AssemblyAndTestMemberintc:IntelFoundryMember2025-03-302025-06-280000050863intc:AssemblyAndTestMemberintc:IntelFoundryMember2024-12-292025-06-280000050863us-gaap:DisposalGroupDisposedOfBySaleNotDiscontinuedOperationsMemberintc:AlteraMember2025-09-120000050863us-gaap:OperatingSegmentsMemberintc:ClientComputingAndPhysicalAIGroupMember2026-03-292026-06-270000050863us-gaap:OperatingSegmentsMemberintc:DatacenterAndAIMember2026-03-292026-06-270000050863us-gaap:OperatingSegmentsMemberintc:ClientComputingGroupDatacenterAndAIAndNetworkAndEdgeMember2026-03-292026-06-270000050863us-gaap:OperatingSegmentsMemberintc:IntelFoundryMember2026-03-292026-06-270000050863us-gaap:OperatingSegmentsMemberus-gaap:AllOtherSegmentsMember2026-03-292026-06-270000050863us-gaap:IntersegmentEliminationMember2026-03-292026-06-270000050863us-gaap:CorporateNonSegmentMember2026-03-292026-06-270000050863intc:ClientComputingAndPhysicalAIGroupMember2026-03-292026-06-270000050863intc:DatacenterAndAIMember2026-03-292026-06-270000050863us-gaap:OperatingSegmentsMemberintc:ClientComputingAndPhysicalAIGroupMember2025-03-302025-06-280000050863us-gaap:OperatingSegmentsMemberintc:DatacenterAndAIMember2025-03-302025-06-280000050863us-gaap:OperatingSegmentsMemberintc:ClientComputingGroupDatacenterAndAIAndNetworkAndEdgeMember2025-03-302025-06-280000050863us-gaap:OperatingSegmentsMemberintc:IntelFoundryMember2025-03-302025-06-280000050863us-gaap:OperatingSegmentsMemberus-gaap:AllOtherSegmentsMember2025-03-302025-06-280000050863us-gaap:IntersegmentEliminationMember2025-03-302025-06-280000050863us-gaap:CorporateNonSegmentMember2025-03-302025-06-280000050863intc:ClientComputingAndPhysicalAIGroupMember2025-03-302025-06-280000050863intc:DatacenterAndAIMember2025-03-302025-06-280000050863us-gaap:OperatingSegmentsMemberintc:ClientComputingAndPhysicalAIGroupMember2025-12-282026-06-270000050863us-gaap:OperatingSegmentsMemberintc:DatacenterAndAIMember2025-12-282026-06-270000050863us-gaap:OperatingSegmentsMemberintc:ClientComputingGroupDatacenterAndAIAndNetworkAndEdgeMember2025-12-282026-06-270000050863us-gaap:OperatingSegmentsMemberintc:IntelFoundryMember2025-12-282026-06-270000050863us-gaap:OperatingSegmentsMemberus-gaap:AllOtherSegmentsMember2025-12-282026-06-270000050863us-gaap:IntersegmentEliminationMember2025-12-282026-06-270000050863us-gaap:CorporateNonSegmentMember2025-12-282026-06-270000050863intc:ClientComputingAndPhysicalAIGroupMember2025-12-282026-06-270000050863intc:DatacenterAndAIMember2025-12-282026-06-270000050863us-gaap:OperatingSegmentsMemberintc:ClientComputingAndPhysicalAIGroupMember2024-12-292025-06-280000050863us-gaap:OperatingSegmentsMemberintc:DatacenterAndAIMember2024-12-292025-06-280000050863us-gaap:OperatingSegmentsMemberintc:ClientComputingGroupDatacenterAndAIAndNetworkAndEdgeMember2024-12-292025-06-280000050863us-gaap:OperatingSegmentsMemberintc:IntelFoundryMember2024-12-292025-06-280000050863us-gaap:OperatingSegmentsMemberus-gaap:AllOtherSegmentsMember2024-12-292025-06-280000050863us-gaap:IntersegmentEliminationMember2024-12-292025-06-280000050863us-gaap:CorporateNonSegmentMember2024-12-292025-06-280000050863intc:ClientComputingAndPhysicalAIGroupMember2024-12-292025-06-280000050863intc:DatacenterAndAIMember2024-12-292025-06-280000050863intc:IrelandSCIPMember2026-06-270000050863intc:IrelandSCIPMember2025-06-280000050863intc:ArizonaSCIPMember2026-06-270000050863intc:ArizonaSCIPMember2025-06-280000050863intc:MobileyeMember2026-06-270000050863intc:MobileyeMember2025-06-280000050863intc:IMSNanofabricationGmbHIMSMember2026-06-270000050863intc:IMSNanofabricationGmbHIMSMember2025-06-280000050863intc:SubsidiariesIrelandSCIPMember2025-12-270000050863intc:SubsidiariesArizonaSCIPMember2025-12-270000050863intc:SubsidiariesMobileyeMember2025-12-270000050863intc:SubsidiariesIMSNanofabricationGmbHIMSMember2025-12-270000050863intc:SubsidiariesIrelandSCIPMember2025-12-282026-06-270000050863intc:SubsidiariesArizonaSCIPMember2025-12-282026-06-270000050863intc:SubsidiariesMobileyeMember2025-12-282026-06-270000050863intc:SubsidiariesIMSNanofabricationGmbHIMSMember2025-12-282026-06-270000050863intc:SubsidiariesIrelandSCIPMember2026-06-270000050863intc:SubsidiariesArizonaSCIPMember2026-06-270000050863intc:SubsidiariesMobileyeMember2026-06-270000050863intc:SubsidiariesIMSNanofabricationGmbHIMSMember2026-06-270000050863intc:SubsidiariesIrelandSCIPMember2024-12-280000050863intc:SubsidiariesArizonaSCIPMember2024-12-280000050863intc:SubsidiariesMobileyeMember2024-12-280000050863intc:SubsidiariesIMSNanofabricationGmbHIMSMember2024-12-280000050863intc:SubsidiariesIrelandSCIPMember2024-12-292025-06-280000050863intc:SubsidiariesArizonaSCIPMember2024-12-292025-06-280000050863intc:SubsidiariesMobileyeMember2024-12-292025-06-280000050863intc:SubsidiariesIMSNanofabricationGmbHIMSMember2024-12-292025-06-280000050863intc:SubsidiariesIrelandSCIPMember2025-06-280000050863intc:SubsidiariesArizonaSCIPMember2025-06-280000050863intc:SubsidiariesMobileyeMember2025-06-280000050863intc:SubsidiariesIMSNanofabricationGmbHIMSMember2025-06-280000050863intc:IrelandSCIPMember2023-12-312024-12-280000050863us-gaap:NondesignatedMemberintc:IrelandSCIPArrangementMember2025-12-270000050863us-gaap:NondesignatedMemberintc:IrelandSCIPArrangementMember2025-12-282026-03-280000050863intc:IrelandSCIPMember2026-04-0700000508632026-04-082026-04-080000050863intc:IrelandSCIPMember2026-04-082026-06-270000050863intc:SubsidiariesIrelandSCIPMember2026-04-082026-04-080000050863us-gaap:NondesignatedMemberintc:IrelandSCIPArrangementMember2026-04-070000050863us-gaap:CommonStockIncludingAdditionalPaidInCapitalMember2026-04-082026-04-080000050863intc:VariableInterestEntityPrimaryBeneficiaryArizonaSCIPMember2026-06-270000050863intc:VariableInterestEntityPrimaryBeneficiaryArizonaSCIPMemberus-gaap:AssetPledgedAsCollateralMember2026-06-270000050863intc:VariableInterestEntityPrimaryBeneficiaryArizonaSCIPMemberus-gaap:AssetPledgedAsCollateralMember2025-12-270000050863intc:DepartmentOfCommerceMember2026-03-292026-06-270000050863intc:DepartmentOfCommerceMember2025-12-282026-06-270000050863us-gaap:NondesignatedMemberintc:SharesInEscrowMember2026-03-292026-06-270000050863us-gaap:NondesignatedMemberintc:SharesInEscrowMember2025-12-282026-06-270000050863us-gaap:NondesignatedMemberintc:SharesInEscrowMember2026-06-270000050863us-gaap:NondesignatedMemberintc:SharesInEscrowMember2025-12-270000050863intc:DepartmentOfCommerceMember2026-06-270000050863intc:ValueOfManufacturingAssetPortfolioMember2025-03-302025-06-280000050863intc:A2025RestructuringPlanMember2025-03-302025-06-280000050863intc:SharesInEscrowMember2026-06-270000050863intc:SharesInEscrowMember2025-12-270000050863intc:SharesInEscrowMember2026-03-292026-06-270000050863intc:SharesInEscrowMember2025-03-302025-06-280000050863intc:SharesInEscrowMember2025-12-282026-06-270000050863intc:SharesInEscrowMember2024-12-292025-06-280000050863us-gaap:NondesignatedMemberintc:IrelandSCIPArrangementMember2025-12-282026-06-270000050863intc:NANDMemoryBusinessMember2024-12-292025-06-280000050863intc:A2025RestructuringPlanMember2026-06-270000050863intc:A2024RestructuringPlanMember2026-06-270000050863intc:A2025RestructuringPlanMember2025-12-270000050863intc:A2025RestructuringPlanMember2025-12-282026-06-270000050863us-gaap:DebtSecuritiesMember2026-06-270000050863us-gaap:DebtSecuritiesMember2025-12-270000050863intc:SingleInvesteeMember2025-03-302025-06-280000050863intc:AlteraMember2025-09-270000050863intc:AlteraMember2026-06-270000050863intc:AlteraMember2025-12-270000050863us-gaap:EquityMethodInvesteeMember2026-03-292026-06-270000050863us-gaap:EquityMethodInvesteeMember2025-12-282026-06-270000050863intc:MenteeRoboticsMember2026-02-032026-02-030000050863intc:MenteeRoboticsMember2026-02-030000050863us-gaap:DisposalGroupDisposedOfBySaleNotDiscontinuedOperationsMemberintc:AlteraMember2025-06-292025-09-270000050863us-gaap:DisposalGroupDisposedOfBySaleNotDiscontinuedOperationsMembersrt:ScenarioForecastMemberintc:AlteraMember2025-09-282027-12-310000050863us-gaap:DisposalGroupDisposedOfBySaleNotDiscontinuedOperationsMemberintc:AlteraMember2025-09-122025-09-120000050863intc:SilverLakePartnersMember2026-06-270000050863intc:SilverLakePartnersMember2025-12-2700000508632025-12-282026-03-280000050863us-gaap:MeasurementInputDiscountRateMemberintc:MobileyeMember2025-12-282026-03-280000050863srt:ProFormaMemberintc:MobileyeMember2025-12-282026-03-280000050863intc:MobileyeMember2026-06-270000050863intc:MobileyeMember2025-12-270000050863us-gaap:SeniorNotesMember2025-12-282026-03-280000050863us-gaap:LineOfCreditMemberintc:CreditFacility364DayMember2024-12-292025-12-270000050863us-gaap:LineOfCreditMemberintc:CreditFacility364DayMember2025-12-270000050863us-gaap:LineOfCreditMemberintc:CreditFacilityMaturingInJanuary2029Member2025-12-282026-03-280000050863us-gaap:LineOfCreditMemberintc:CreditFacilityMaturingInJanuary2029Member2026-03-280000050863us-gaap:SeniorNotesMember2026-03-292026-06-270000050863us-gaap:SeniorNotesMember2026-06-270000050863us-gaap:SeniorNotesMemberintc:FixedRateSeniorNotes4.65Due2031Member2026-06-270000050863us-gaap:SeniorNotesMemberintc:FixedRateSeniorNotes5.00Due2033Member2026-06-270000050863us-gaap:SeniorNotesMemberintc:FixedRateSeniorNotes5.30Due2036Member2026-06-270000050863us-gaap:SeniorNotesMemberintc:FixedRateSeniorNotes6.13Due2056Member2026-06-270000050863us-gaap:SeniorNotesMemberintc:FixedRateSeniorNotes6.20Due2066Member2026-06-270000050863us-gaap:BridgeLoanMemberintc:A364DaySeniorUnsecuredTermLoanFacilityMember2026-04-010000050863us-gaap:BridgeLoanMemberintc:A364DaySeniorUnsecuredTermLoanFacilityMember2026-04-012026-04-010000050863us-gaap:FairValueMeasurementsRecurringMemberus-gaap:CorporateDebtSecuritiesMemberus-gaap:FairValueInputsLevel1Member2026-06-270000050863us-gaap:FairValueMeasurementsRecurringMemberus-gaap:CorporateDebtSecuritiesMemberus-gaap:FairValueInputsLevel2Member2026-06-270000050863us-gaap:FairValueMeasurementsRecurringMemberus-gaap:CorporateDebtSecuritiesMemberus-gaap:FairValueInputsLevel3Member2026-06-270000050863us-gaap:CorporateDebtSecuritiesMemberus-gaap:FairValueMeasurementsRecurringMember2026-06-270000050863us-gaap:FairValueMeasurementsRecurringMemberus-gaap:CorporateDebtSecuritiesMemberus-gaap:FairValueInputsLevel1Member2025-12-270000050863us-gaap:FairValueMeasurementsRecurringMemberus-gaap:CorporateDebtSecuritiesMemberus-gaap:FairValueInputsLevel2Member2025-12-270000050863us-gaap:FairValueMeasurementsRecurringMemberus-gaap:CorporateDebtSecuritiesMemberus-gaap:FairValueInputsLevel3Member2025-12-270000050863us-gaap:CorporateDebtSecuritiesMemberus-gaap:FairValueMeasurementsRecurringMember2025-12-270000050863us-gaap:FairValueMeasurementsRecurringMemberus-gaap:FixedIncomeSecuritiesMemberus-gaap:FairValueInputsLevel1Member2026-06-270000050863us-gaap:FairValueMeasurementsRecurringMemberus-gaap:FixedIncomeSecuritiesMemberus-gaap:FairValueInputsLevel2Member2026-06-270000050863us-gaap:FairValueMeasurementsRecurringMemberus-gaap:FixedIncomeSecuritiesMemberus-gaap:FairValueInputsLevel3Member2026-06-270000050863us-gaap:FixedIncomeSecuritiesMemberus-gaap:FairValueMeasurementsRecurringMember2026-06-270000050863us-gaap:FairValueMeasurementsRecurringMemberus-gaap:FixedIncomeSecuritiesMemberus-gaap:FairValueInputsLevel1Member2025-12-270000050863us-gaap:FairValueMeasurementsRecurringMemberus-gaap:FixedIncomeSecuritiesMemberus-gaap:FairValueInputsLevel2Member2025-12-270000050863us-gaap:FairValueMeasurementsRecurringMemberus-gaap:FixedIncomeSecuritiesMemberus-gaap:FairValueInputsLevel3Member2025-12-270000050863us-gaap:FixedIncomeSecuritiesMemberus-gaap:FairValueMeasurementsRecurringMember2025-12-270000050863us-gaap:FairValueMeasurementsRecurringMemberintc:ReverseRepurchaseAgreementsMemberus-gaap:FairValueInputsLevel1Member2026-06-270000050863us-gaap:FairValueMeasurementsRecurringMemberintc:ReverseRepurchaseAgreementsMemberus-gaap:FairValueInputsLevel2Member2026-06-270000050863us-gaap:FairValueMeasurementsRecurringMemberintc:ReverseRepurchaseAgreementsMemberus-gaap:FairValueInputsLevel3Member2026-06-270000050863intc:ReverseRepurchaseAgreementsMemberus-gaap:FairValueMeasurementsRecurringMember2026-06-270000050863us-gaap:FairValueMeasurementsRecurringMemberintc:ReverseRepurchaseAgreementsMemberus-gaap:FairValueInputsLevel1Member2025-12-270000050863us-gaap:FairValueMeasurementsRecurringMemberintc:ReverseRepurchaseAgreementsMemberus-gaap:FairValueInputsLevel2Member2025-12-270000050863us-gaap:FairValueMeasurementsRecurringMemberintc:ReverseRepurchaseAgreementsMemberus-gaap:FairValueInputsLevel3Member2025-12-270000050863intc:ReverseRepurchaseAgreementsMemberus-gaap:FairValueMeasurementsRecurringMember2025-12-270000050863us-gaap:CorporateDebtSecuritiesMemberus-gaap:FairValueMeasurementsRecurringMemberus-gaap:FairValueInputsLevel1Member2026-06-270000050863us-gaap:CorporateDebtSecuritiesMemberus-gaap:FairValueMeasurementsRecurringMemberus-gaap:FairValueInputsLevel2Member2026-06-270000050863us-gaap:CorporateDebtSecuritiesMemberus-gaap:FairValueMeasurementsRecurringMemberus-gaap:FairValueInputsLevel3Member2026-06-270000050863us-gaap:CorporateDebtSecuritiesMemberus-gaap:FairValueMeasurementsRecurringMember2026-06-270000050863us-gaap:CorporateDebtSecuritiesMemberus-gaap:FairValueMeasurementsRecurringMemberus-gaap:FairValueInputsLevel1Member2025-12-270000050863us-gaap:CorporateDebtSecuritiesMemberus-gaap:FairValueMeasurementsRecurringMemberus-gaap:FairValueInputsLevel2Member2025-12-270000050863us-gaap:CorporateDebtSecuritiesMemberus-gaap:FairValueMeasurementsRecurringMemberus-gaap:FairValueInputsLevel3Member2025-12-270000050863us-gaap:CorporateDebtSecuritiesMemberus-gaap:FairValueMeasurementsRecurringMember2025-12-270000050863us-gaap:FixedIncomeSecuritiesMemberus-gaap:FairValueMeasurementsRecurringMemberus-gaap:FairValueInputsLevel1Member2026-06-270000050863us-gaap:FixedIncomeSecuritiesMemberus-gaap:FairValueMeasurementsRecurringMemberus-gaap:FairValueInputsLevel2Member2026-06-270000050863us-gaap:FixedIncomeSecuritiesMemberus-gaap:FairValueMeasurementsRecurringMemberus-gaap:FairValueInputsLevel3Member2026-06-270000050863us-gaap:FixedIncomeSecuritiesMemberus-gaap:FairValueMeasurementsRecurringMember2026-06-270000050863us-gaap:FixedIncomeSecuritiesMemberus-gaap:FairValueMeasurementsRecurringMemberus-gaap:FairValueInputsLevel1Member2025-12-270000050863us-gaap:FixedIncomeSecuritiesMemberus-gaap:FairValueMeasurementsRecurringMemberus-gaap:FairValueInputsLevel2Member2025-12-270000050863us-gaap:FixedIncomeSecuritiesMemberus-gaap:FairValueMeasurementsRecurringMemberus-gaap:FairValueInputsLevel3Member2025-12-270000050863us-gaap:FixedIncomeSecuritiesMemberus-gaap:FairValueMeasurementsRecurringMember2025-12-270000050863intc:GovernmentDebtSecuritiesMemberus-gaap:FairValueMeasurementsRecurringMemberus-gaap:FairValueInputsLevel1Member2026-06-270000050863intc:GovernmentDebtSecuritiesMemberus-gaap:FairValueMeasurementsRecurringMemberus-gaap:FairValueInputsLevel2Member2026-06-270000050863intc:GovernmentDebtSecuritiesMemberus-gaap:FairValueMeasurementsRecurringMemberus-gaap:FairValueInputsLevel3Member2026-06-270000050863intc:GovernmentDebtSecuritiesMemberus-gaap:FairValueMeasurementsRecurringMember2026-06-270000050863intc:GovernmentDebtSecuritiesMemberus-gaap:FairValueMeasurementsRecurringMemberus-gaap:FairValueInputsLevel1Member2025-12-270000050863intc:GovernmentDebtSecuritiesMemberus-gaap:FairValueMeasurementsRecurringMemberus-gaap:FairValueInputsLevel2Member2025-12-270000050863intc:GovernmentDebtSecuritiesMemberus-gaap:FairValueMeasurementsRecurringMemberus-gaap:FairValueInputsLevel3Member2025-12-270000050863intc:GovernmentDebtSecuritiesMemberus-gaap:FairValueMeasurementsRecurringMember2025-12-270000050863us-gaap:FairValueInputsLevel1Memberus-gaap:FairValueMeasurementsRecurringMember2026-06-270000050863us-gaap:FairValueInputsLevel2Memberus-gaap:FairValueMeasurementsRecurringMember2026-06-270000050863us-gaap:FairValueInputsLevel3Memberus-gaap:FairValueMeasurementsRecurringMember2026-06-270000050863us-gaap:FairValueMeasurementsRecurringMember2026-06-270000050863us-gaap:FairValueInputsLevel1Memberus-gaap:FairValueMeasurementsRecurringMember2025-12-270000050863us-gaap:FairValueInputsLevel2Memberus-gaap:FairValueMeasurementsRecurringMember2025-12-270000050863us-gaap:FairValueInputsLevel3Memberus-gaap:FairValueMeasurementsRecurringMember2025-12-270000050863us-gaap:FairValueMeasurementsRecurringMember2025-12-270000050863intc:SilverLakePartnersMemberus-gaap:FairValueInputsLevel2Member2026-06-270000050863intc:SilverLakePartnersMemberus-gaap:FairValueInputsLevel2Member2025-12-270000050863us-gaap:FairValueInputsLevel2Member2026-06-270000050863us-gaap:FairValueInputsLevel2Member2025-12-270000050863us-gaap:ForeignExchangeContractMember2026-06-270000050863us-gaap:ForeignExchangeContractMember2025-12-270000050863us-gaap:InterestRateContractMember2026-06-270000050863us-gaap:InterestRateContractMember2025-12-270000050863us-gaap:EquityContractMember2026-06-270000050863us-gaap:EquityContractMember2025-12-270000050863us-gaap:DesignatedAsHedgingInstrumentMemberus-gaap:InterestRateContractMemberus-gaap:FairValueHedgingMember2026-06-270000050863us-gaap:DesignatedAsHedgingInstrumentMemberus-gaap:InterestRateContractMemberus-gaap:FairValueHedgingMember2025-12-270000050863us-gaap:DesignatedAsHedgingInstrumentMemberus-gaap:ForeignExchangeContractMember2026-06-270000050863us-gaap:DesignatedAsHedgingInstrumentMemberus-gaap:ForeignExchangeContractMember2025-12-270000050863us-gaap:DesignatedAsHedgingInstrumentMemberus-gaap:InterestRateContractMember2026-06-270000050863us-gaap:DesignatedAsHedgingInstrumentMemberus-gaap:InterestRateContractMember2025-12-270000050863us-gaap:DesignatedAsHedgingInstrumentMember2026-06-270000050863us-gaap:DesignatedAsHedgingInstrumentMember2025-12-270000050863us-gaap:NondesignatedMemberus-gaap:ForeignExchangeContractMember2026-06-270000050863us-gaap:NondesignatedMemberus-gaap:ForeignExchangeContractMember2025-12-270000050863us-gaap:NondesignatedMemberus-gaap:InterestRateContractMember2026-06-270000050863us-gaap:NondesignatedMemberus-gaap:InterestRateContractMember2025-12-270000050863us-gaap:NondesignatedMemberus-gaap:EquityContractMember2026-06-270000050863us-gaap:NondesignatedMemberus-gaap:EquityContractMember2025-12-270000050863us-gaap:NondesignatedMemberintc:IrelandSCIPArrangementMember2026-06-270000050863us-gaap:NondesignatedMember2026-06-270000050863us-gaap:NondesignatedMember2025-12-270000050863us-gaap:ForeignExchangeContractMember2026-03-292026-06-270000050863us-gaap:ForeignExchangeContractMember2025-12-282026-06-270000050863us-gaap:ForeignExchangeContractMember2025-03-302025-06-280000050863us-gaap:ForeignExchangeContractMember2024-12-292025-06-280000050863us-gaap:InterestRateSwapMemberus-gaap:ShortTermDebtMember2026-06-270000050863us-gaap:InterestRateSwapMemberus-gaap:ShortTermDebtMember2025-12-270000050863us-gaap:InterestRateSwapMemberus-gaap:LongTermDebtMember2026-06-270000050863us-gaap:InterestRateSwapMemberus-gaap:LongTermDebtMember2025-12-270000050863us-gaap:InterestRateSwapMember2026-06-270000050863us-gaap:InterestRateSwapMember2025-12-270000050863us-gaap:NondesignatedMemberus-gaap:ForeignExchangeContractMember2026-03-292026-06-270000050863us-gaap:NondesignatedMemberus-gaap:ForeignExchangeContractMember2025-03-302025-06-280000050863us-gaap:NondesignatedMemberus-gaap:ForeignExchangeContractMember2025-12-282026-06-270000050863us-gaap:NondesignatedMemberus-gaap:ForeignExchangeContractMember2024-12-292025-06-280000050863us-gaap:NondesignatedMemberus-gaap:InterestRateContractMember2026-03-292026-06-270000050863us-gaap:NondesignatedMemberus-gaap:InterestRateContractMember2025-03-302025-06-280000050863us-gaap:NondesignatedMemberus-gaap:InterestRateContractMember2025-12-282026-06-270000050863us-gaap:NondesignatedMemberus-gaap:InterestRateContractMember2024-12-292025-06-280000050863us-gaap:NondesignatedMemberintc:SharesInEscrowMember2025-03-302025-06-280000050863us-gaap:NondesignatedMemberintc:SharesInEscrowMember2024-12-292025-06-280000050863us-gaap:NondesignatedMemberus-gaap:OtherContractMember2026-03-292026-06-270000050863us-gaap:NondesignatedMemberus-gaap:OtherContractMember2025-03-302025-06-280000050863us-gaap:NondesignatedMemberus-gaap:OtherContractMember2025-12-282026-06-270000050863us-gaap:NondesignatedMemberus-gaap:OtherContractMember2024-12-292025-06-280000050863us-gaap:NondesignatedMember2026-03-292026-06-270000050863us-gaap:NondesignatedMember2025-03-302025-06-280000050863us-gaap:NondesignatedMember2025-12-282026-06-270000050863us-gaap:NondesignatedMember2024-12-292025-06-280000050863intc:VLSITechnologyLLCV.IntelMember2026-06-270000050863intc:EcFineMember2026-06-270000050863intc:EcFineMember2009-06-282009-09-260000050863intc:EcFineMember2023-09-012023-09-300000050863intc:EcFineMember2025-12-012025-12-310000050863intc:VLSITechnologyLLCV.IntelMember2017-10-012017-10-310000050863intc:VLSITechnologyLLCV.IntelMember2024-04-012024-04-300000050863intc:VLSITechnologyLLCV.IntelMember2025-12-282026-06-270000050863intc:VLSITechnologyLLCV.IntelMemberintc:LiteralPatentInfringementMember2021-02-012021-02-280000050863intc:VLSITechnologyLLCV.IntelMemberintc:DoctrineOfEquivalentsPatentInfringementMember2021-02-012021-02-280000050863intc:VLSITechnologyLLCV.IntelMember2022-04-012022-04-300000050863intc:VLSITechnologyLLCV.IntelMember2021-04-012021-04-300000050863intc:VLSITechnologyLLCV.IntelMember2022-11-012022-11-300000050863intc:ShenzenMemberintc:VLSITechnologyLLCV.IntelMember2019-05-012019-05-310000050863intc:ShanghaiMemberintc:VLSITechnologyLLCV.IntelMember2019-05-012019-05-310000050863intc:EireOgInnovationsVIBMEt.Al.Member2024-04-012026-06-270000050863intc:EireOgInnovationsVIBMEt.Al.Member2025-12-282026-06-270000050863intc:MediaContentProtectionVIntelMember2020-09-012020-09-300000050863intc:MediaContentProtectionVIntelMembersrt:MinimumMember2020-09-012023-12-300000050863intc:MediaContentProtectionVIntelMembersrt:MaximumMember2020-09-012023-12-30
UNITED STATES SECURITIES AND EXCHANGE COMMISSION
Washington, D.C. 20549
FORM 10-Q
(Mark One)
| | | | | | | | | | | |
| | ☑ | QUARTERLY REPORT PURSUANT TO SECTION 13 OR 15(d) OF THE SECURITIES EXCHANGE ACT OF 1934 |
| | For the quarterly period ended June 27, 2026 |
or
| | | | | | | | |
| | ☐ | TRANSITION REPORT PURSUANT TO SECTION 13 OR 15(d) OF THE SECURITIES EXCHANGE ACT OF 1934 |
| | For the transition period from to |
Commission File Number: 000-06217
INTEL CORPORATION
(Exact name of registrant as specified in its charter)
| | | | | | | | |
| Delaware | | 94-1672743 |
(State or other jurisdiction of incorporation or organization) | | (I.R.S. Employer Identification No.) |
| | |
2200 Mission College Boulevard, Santa Clara, California | | 95054-1549 |
| (Address of principal executive offices) | | (Zip Code) |
(408) 765-8080
(Registrant’s telephone number, including area code)
N/A
(Former name, former address and former fiscal year, if changed since last report)
Securities registered pursuant to Section 12(b) of the Act:
| | | | | | | | |
| Title of each class | Trading symbol(s) | Name of each exchange on which registered |
| Common stock, $0.001 par value | INTC | Nasdaq Global Select Market |
Indicate by check mark whether the registrant (1) has filed all reports required to be filed by Section 13 or 15(d) of the Securities Exchange Act of 1934 during the preceding 12 months (or for such shorter period that the registrant was required to file such reports), and (2) has been subject to such filing requirements for the past 90 days. Yes ☑ No ¨
Indicate by check mark whether the registrant has submitted electronically every Interactive Data File required to be submitted pursuant to Rule 405 of Regulation S-T (§232.405 of this chapter) during the preceding 12 months (or for such shorter period that the registrant was required to submit such files). Yes ☑ No ¨
Indicate by check mark whether the registrant is a large accelerated filer, an accelerated filer, a non-accelerated filer, a smaller reporting company, or an emerging growth company. See the definitions of “large accelerated filer,” “accelerated filer,” “smaller reporting company,” and "emerging growth company" in Rule 12b-2 of the Exchange Act.
| | | | | | | | | | | | | | | | | |
| Large accelerated filer | | Accelerated filer | | Non-accelerated filer | | Smaller reporting company | Emerging growth company |
☑
| | ¨ | | ¨ | | ☐ | ☐ |
| | | | | | | |
If an emerging growth company, indicate by check mark if the registrant has elected not to use the extended transition period for complying with any new or revised financial accounting standards provided pursuant to Section 13(a) of the Exchange Act. ¨
Indicate by check mark whether the registrant is a shell company (as defined in Rule 12b-2 of the Exchange Act). Yes ☐ No ☑
As of July 17, 2026, the registrant had outstanding 5,044 million shares of common stock.
Table of Contents
Organization of Our Form 10-Q
The order and presentation of content in our Form 10-Q differs from the traditional SEC Form 10-Q format. Our format is designed to improve readability and better present how we organize and manage our business. See "Form 10-Q Cross-Reference Index" within Risk Factors and Other Key Information for a cross-reference index to the traditional SEC Form 10-Q format.
We have defined certain terms and abbreviations used throughout our Form 10-Q in "Key Terms" within the Consolidated Condensed Financial Statements and Supplemental Details.
| | | | | | | |
| | | Page |
| Forward-Looking Statements | | |
| Availability of Company Information | | |
| | |
| Consolidated Condensed Financial Statements and Supplemental Details | | |
| Consolidated Condensed Statements of Operations | | |
| Consolidated Condensed Statements of Comprehensive Income (Loss) | | |
| Consolidated Condensed Balance Sheets | | |
| Consolidated Condensed Statements of Cash Flows | | |
| Consolidated Condensed Statements of Stockholders' Equity | | |
| Notes to Consolidated Condensed Financial Statements | | |
| Key Terms | | |
| | | |
| Management's Discussion and Analysis (MD&A) | | |
| | |
| | |
| Operating Segments Trends and Results | | |
| | | |
| | | |
| | | |
| | | |
| | | |
| Consolidated Condensed Results of Operations | | |
| Liquidity and Capital Resources | | |
| | |
| | |
| | |
| | |
| | | |
| Risk Factors and Other Key Information | | |
| | | |
| Risk Factors | | |
| | | |
| | | |
| Quantitative and Qualitative Disclosures About Market Risk | | |
| | | |
| Controls and Procedures | | |
| | | |
| Issuer Purchases of Equity Securities | | |
| Rule 10b5-1 Trading Arrangements | | |
| Disclosure Pursuant to Section 13(r) of the Securities Exchange Act of 1934 | | |
| | | |
| Exhibits | | |
| Form 10-Q Cross-Reference Index | | |
Forward-Looking Statements
This Form 10-Q contains forward-looking statements that involve a number of risks and uncertainties. Words such as "accelerate", "achieve", "aim", "ambitions", "anticipate", "believe", "committed", "continue", "could", "designed", "estimate", "expect", "forecast", "future", "goals", "grow", "guidance", "intend", "likely", "may", "might", "milestones", "next-generation", "objective", "on track", "opportunity", "outlook", "pending", "plan", "position", "possible", "potential", "predict", "progress", "ramp", "roadmap", "seek", "should", "strive", "targets", "to be", "upcoming", "will", "would" and variations of such words and similar expressions are intended to identify such forward-looking statements, which may include statements regarding:
▪our business plans and strategy and anticipated benefits therefrom;
▪projections of our future financial performance, including future revenue, gross profits, capital expenditures and cash flows;
▪projected costs and yield trends;
▪future cash requirements, the availability, uses, sufficiency and cost of capital resources, and sources of funding, including for future capital and R&D investments and for returns to stockholders, and credit ratings expectations;
▪future products, services and technologies, and the expected goals, timeline, ramps, progress, availability, production, regulation and benefits of such products, services and technologies, including future process nodes and packaging technologies, product roadmaps, schedules, future product architectures, expectations regarding process performance, per-watt parity and metrics, and expectations regarding product and process competitiveness;
▪internal and external manufacturing plans, including future internal manufacturing volumes, manufacturing expansion plans and the financing therefor, and external foundry usage;
▪future production capacity and product supply;
▪supply expectations, including regarding constraints, limitations, pricing, and industry shortages;
▪plans and goals related to Intel's foundry business, including with respect to anticipated customers, future manufacturing capacity and service, technology and IP offerings;
▪expected timing and impact of acquisitions, divestitures and other significant transactions;
▪expected completion and impacts of restructuring activities and cost-saving or efficiency initiatives;
▪social and environmental performance goals, measures, strategies and results;
▪our anticipated growth, future market share, customer demand and trends in our businesses and operations;
▪projected growth and trends in markets relevant to our businesses;
▪anticipated trends and impacts related to industry component, substrate and foundry capacity utilization, shortages and constraints;
▪expectations regarding government funding, incentives, policies and priorities;
▪technology trends and developments, including with respect to AI;
▪macroeconomic conditions;
▪geopolitical tensions and conflicts, including with respect to international trade policies in areas such as tariffs and export controls, and their potential impact on our business;
▪tax- and accounting-related expectations;
▪expectations regarding our relationships with certain sanctioned parties; and
▪other characterizations of future events or circumstances.
Such statements involve many risks and uncertainties that could cause our actual results to differ materially from those expressed or implied, including those associated with:
▪the high level of competition and rapid technological change in our industry;
▪the significant, long-term and inherently risky investments we are making in R&D and manufacturing facilities that may not realize a favorable return;
▪the complexities and uncertainties in developing and implementing new semiconductor products and manufacturing process technologies;
▪our pursuit of Intel 14A and other next-generation leading-edge process technologies, our investments in manufacturing expansion projects to manufacture products using such technologies and our efforts to secure product design wins with and demand commitments from potential significant external customers for the manufacture of products using such technologies;
▪alternative financing arrangements and pursuit of government grants;
▪the U.S. government's acquisition of significant equity interests in us;
▪changes in product demand and margins;
▪macroeconomic conditions and geopolitical tensions and conflicts, including geopolitical and trade tensions between the U.S. and China, tensions and conflict affecting Israel and the Middle East, rising tensions between mainland China and Taiwan and the impacts of Russia's war on Ukraine;
▪recently elevated geopolitical tensions, volatility and uncertainty with respect to international trade policies, including tariffs and export controls, impacting our business, the markets in which we compete and the world economy;
▪the evolving market for products with AI capabilities;
▪our complex global supply chain supporting our manufacturing facilities and incorporating external foundries, including from disruptions, delays, trade tensions and conflicts, or shortages, including current industry-wide substrate and memory shortages;
▪product defects, errata and other product issues, particularly as we develop next-generation products and implement next-generation manufacturing process technologies;
▪potential security vulnerabilities in our products;
▪increasing and evolving cybersecurity threats and privacy risks;
▪IP risks including related litigation and regulatory proceedings;
▪the need to attract, retain and motivate key talent;
▪strategic transactions and investments;
▪sales-related risks, including customer concentration and the use of distributors and other third parties;
▪our debt obligations and our ability to access sources of capital;
▪complex and evolving laws and regulations across many jurisdictions;
▪catastrophic events;
▪fluctuations in currency exchange rates;
▪changes in our effective tax rate and applicable tax regimes;
▪environmental, health, safety and product regulations; and
▪other risks and uncertainties described in this report, our 2025 Form 10-K and our other filings with the SEC.
Given these risks and uncertainties, readers are cautioned not to place undue reliance on such forward-looking statements. Readers are urged to carefully review and consider the various disclosures made in this Form 10-Q and in other documents we file from time to time with the SEC that disclose risks and uncertainties that may affect our business.
Unless specifically indicated otherwise, the forward-looking statements in this Form 10-Q do not reflect the potential impact of any divestitures, mergers, acquisitions or other business combinations that have not been completed as of the date of this filing. In addition, the forward-looking statements in this Form 10-Q are based on management's expectations as of the date of this filing, unless an earlier date is specified, including expectations based on third-party information and projections that management believes to be reputable. We do not undertake, and expressly disclaim any duty, to update such statements, whether as a result of new information, new developments, or otherwise, except to the extent that disclosure may be required by law.
Availability of Company Information
We use our Investor Relations website, www.intc.com, as a routine channel for distribution of important, and often material, information about us, including our quarterly and annual earnings results and presentations, press releases, announcements, information about upcoming webcasts, analyst presentations and investor days, archives of these events, financial information, corporate governance practices and corporate responsibility information. We also post our filings on this website the same day they are electronically filed with, or furnished to, the SEC, including our annual and quarterly reports on Forms 10-K and 10-Q and current reports on Form 8-K, our proxy statements and any amendments to those reports. All such information is available free of charge. Our Investor Relations website allows interested persons to sign up to automatically receive e-mail alerts when we post financial information and issue press releases and to receive information about upcoming events. We encourage interested persons to follow our Investor Relations website in addition to our filings with the SEC to timely receive information about the company.
Intel Core, Gaudi and the Intel logo are trademarks of Intel Corporation or its subsidiaries.
* Other names and brands may be claimed as the property of others.
| | | | | |
Consolidated Condensed Statements of Operations | |
| |
| | | | | | | | | | | | | | | | | | | | | | | | | | |
| | Three Months Ended | | Six Months Ended |
| (In Millions, Except Per Share Amounts; Unaudited) | | Jun 27, 2026 | | Jun 28, 2025 | | Jun 27, 2026 | | Jun 28, 2025 |
| Net revenue | | $ | 16,128 | | | $ | 12,859 | | | $ | 29,705 | | | $ | 25,526 | |
| Cost of sales | | 9,619 | | | 9,317 | | | 17,849 | | | 17,312 | |
| Gross profit | | 6,509 | | | 3,542 | | | 11,856 | | | 8,214 | |
| Research and development | | 3,368 | | | 3,684 | | | 6,743 | | | 7,324 | |
| Marketing, general, and administrative | | 1,175 | | | 1,144 | | | 2,213 | | | 2,321 | |
| Restructuring and other charges | | 170 | | | 1,890 | | | 4,240 | | | 2,046 | |
| Operating expenses | | 4,713 | | | 6,718 | | | 13,196 | | | 11,691 | |
| Operating income (loss) | | 1,796 | | | (3,176) | | | (1,340) | | | (3,477) | |
| Gains (losses) on equity investments, net | | (39) | | | 502 | | | (111) | | | 390 | |
| Interest and other, net | | (12,576) | | | (95) | | | (13,314) | | | (268) | |
| Income (loss) before taxes | | (10,819) | | | (2,769) | | | (14,765) | | | (3,355) | |
| Provision for (benefit from) taxes | | 29 | | | 255 | | | 364 | | | 556 | |
| Net income (loss) | | (10,848) | | | (3,024) | | | (15,129) | | | (3,911) | |
| Less: net income (loss) attributable to non-controlling interests | | 185 | | | (106) | | | (368) | | | (172) | |
| Net income (loss) attributable to Intel | | $ | (11,033) | | | $ | (2,918) | | | $ | (14,761) | | | $ | (3,739) | |
| Earnings (loss) per share attributable to Intel—basic | | $ | (2.16) | | | $ | (0.67) | | | $ | (2.89) | | | $ | (0.86) | |
| Earnings (loss) per share attributable to Intel—diluted | | $ | (2.16) | | | $ | (0.67) | | | $ | (2.89) | | | $ | (0.86) | |
| | | | | | | | |
| Weighted average shares of common stock outstanding: | | | | | | | | |
| Basic | | 5,104 | | | 4,369 | | | 5,108 | | | 4,356 | |
| Diluted | | 5,104 | | | 4,369 | | | 5,108 | | | 4,356 | |
See accompanying notes.
| | | | | | | | | | | |
| Financial Statements | Consolidated Condensed Statements of Operations | 3 |
| | | | | |
Consolidated Condensed Statements of Comprehensive Income (Loss) | |
| |
| | | | | | | | | | | | | | | | | | | | | | | | | | |
| | Three Months Ended | | Six Months Ended |
| (In Millions; Unaudited) | | Jun 27, 2026 | | Jun 28, 2025 | | Jun 27, 2026 | | Jun 28, 2025 |
| Net income (loss) | | $ | (10,848) | | | $ | (3,024) | | | $ | (15,129) | | | $ | (3,911) | |
| Changes in other comprehensive income (loss), net of tax: | | | | | | | | |
| | | | | | | | |
| | | | | | | | |
| Net unrealized holding gains (losses) on derivatives | | (44) | | | 550 | | | (200) | | | 775 | |
| Actuarial valuation and other pension benefits (expenses), net | | (1) | | | — | | | (1) | | | 1 | |
| Translation adjustments and other | | 9 | | | 1 | | | 8 | | | — | |
| Other comprehensive income (loss) | | (36) | | | 551 | | | (193) | | | 776 | |
| Total comprehensive income (loss) | | (10,884) | | | (2,473) | | | (15,322) | | | (3,135) | |
| Less: comprehensive income (loss) attributable to non-controlling interests | | 185 | | | (106) | | | (368) | | | (172) | |
| Total comprehensive income (loss) attributable to Intel | | $ | (11,069) | | | $ | (2,367) | | | $ | (14,954) | | | $ | (2,963) | |
| | | | | | | | |
See accompanying notes.
| | | | | | | | | | | |
| Financial Statements | Consolidated Condensed Statements of Comprehensive Income (Loss) | 4 |
| | | | | |
Consolidated Condensed Balance Sheets | |
| |
| | | | | | | | | | | | | | |
| (In Millions; Unaudited) | | Jun 27, 2026 | | Dec 27, 2025 |
| | | | |
| Assets | | | | |
| Current assets: | | | | |
| Cash and cash equivalents | | $ | 12,874 | | | $ | 14,265 | |
| Short-term investments | | 16,853 | | | 23,151 | |
| | | | |
| Accounts receivable, net | | 4,033 | | | 3,839 | |
| Inventories | | 12,492 | | | 11,618 | |
| | | | |
| Other current assets | | 10,961 | | | 10,815 | |
| Total current assets | | 57,213 | | | 63,688 | |
| | | | |
Property, plant, and equipment, net of accumulated depreciation of $109,918 ($106,464 as of December 27, 2025) | | 105,741 | | | 105,414 | |
| Equity investments | | 8,410 | | | 8,512 | |
| | | | |
| Goodwill | | 20,465 | | | 23,912 | |
| Identified intangible assets, net | | 2,545 | | | 2,772 | |
| Other long-term assets | | 8,065 | | | 7,131 | |
| Total assets | | $ | 202,439 | | | $ | 211,429 | |
| | | | |
| Liabilities and stockholders’ equity | | | | |
| Current liabilities: | | | | |
| | | | |
| Accounts payable | | $ | 8,756 | | | $ | 9,882 | |
| Accrued compensation and benefits | | 3,748 | | | 3,990 | |
| | | | |
| | | | |
| Short-term debt | | 1,988 | | | 2,499 | |
| | | | |
| Other accrued liabilities | | 21,178 | | | 15,204 | |
| Total current liabilities | | 35,670 | | | 31,575 | |
| | | | |
| Debt | | 48,549 | | | 44,086 | |
| | | | |
| | | | |
| | | | |
| Other long-term liabilities | | 15,077 | | | 9,408 | |
| Contingencies (Note 14) | | | | |
| | | | |
| Stockholders’ equity: | | | | |
| | | | |
Common stock and capital in excess of par value, 5,043 issued and outstanding (4,994 issued and outstanding as of December 27, 2025) | | 53,780 | | | 65,185 | |
| Accumulated other comprehensive income (loss) | | (80) | | | 113 | |
| Retained earnings | | 33,842 | | | 48,983 | |
| Total Intel stockholders' equity | | 87,542 | | | 114,281 | |
| Non-controlling interests | | 15,601 | | | 12,079 | |
| Total stockholders' equity | | 103,143 | | | 126,360 | |
| Total liabilities and stockholders’ equity | | $ | 202,439 | | | $ | 211,429 | |
See accompanying notes.
| | | | | | | | | | | |
| Financial Statements | Consolidated Condensed Balance Sheets | 5 |
| | | | | |
Consolidated Condensed Statements of Cash Flows | |
| |
| | | | | | | | | | | | | | | | |
| | Six Months Ended | | |
| (In Millions; Unaudited) | | Jun 27, 2026 | | Jun 28, 2025 | | |
| | | | | | |
| Cash, cash equivalents, and restricted cash, beginning of period | | $ | 14,712 | | | $ | 8,249 | | | |
| Cash flows provided by (used for) operating activities: | | | | | | |
| Net income (loss) | | (15,129) | | | (3,911) | | | |
| Adjustments to reconcile net income (loss) to net cash provided by operating activities: | | | | | | |
| Depreciation | | 5,891 | | | 5,213 | | | |
| Share-based compensation | | 1,307 | | | 1,348 | | | |
| | | | | | |
| Restructuring and other charges | | 3,967 | | | 382 | | | |
| Amortization of intangibles | | 469 | | | 474 | | | |
| (Gains) losses on equity investments, net | | 111 | | | (390) | | | |
| Mark-to-market (gains) losses on Escrowed Shares | | 13,619 | | | — | | | |
| | | | | | |
| | | | | | |
| Deferred taxes | | (27) | | | 106 | | | |
| Impairments and net (gain) loss on retirement of property, plant, and equipment | | 165 | | | 482 | | | |
| Changes in assets and liabilities: | | | | | | |
| Accounts receivable | | (221) | | | 1,004 | | | |
| Inventories | | (874) | | | 99 | | | |
| Accounts payable | | 310 | | | 114 | | | |
| Accrued compensation and benefits | | (372) | | | 1,022 | | | |
| | | | | | |
| Income taxes | | (477) | | | (1,338) | | | |
| Other assets and liabilities | | (637) | | | (1,742) | | | |
| Total adjustments | | 23,231 | | | 6,774 | | | |
| Net cash provided by (used for) operating activities | | 8,102 | | | 2,863 | | | |
| Cash flows provided by (used for) investing activities: | | | | | | |
| Additions to property, plant, and equipment | | (6,192) | | | (8,733) | | | |
| | | | | | |
| Proceeds from capital-related government incentives | | 167 | | | 964 | | | |
| Acquisitions, net of cash acquired | | (596) | | | — | | | |
| Purchases of short-term investments | | (12,737) | | | (5,730) | | | |
| Sales of short-term investments | | 11,009 | | | 1,948 | | | |
| | | | | | |
| | | | | | |
| | | | | | |
| | | | | | |
| | | | | | |
| | | | | | |
| | | | | | |
| Maturities of short-term investments | | 7,724 | | | 6,627 | | | |
| Proceeds from divestitures, net | | — | | | 1,935 | | | |
| Other investing | | (44) | | | 984 | | | |
| Net cash provided by (used for) investing activities | | (669) | | | (2,005) | | | |
| Cash flows provided by (used for) financing activities: | | | | | | |
| Issuance of commercial paper, net of issuance costs | | — | | | 3,493 | | | |
| Repayment of commercial paper | | — | | | (1,496) | | | |
| | | | | | |
| | | | | | |
| Payments on finance leases | | (832) | | | (9) | | | |
| Partner contributions | | 4,082 | | | 2,238 | | | |
| Partner distributions | | (14,339) | | | (91) | | | |
| | | | | | |
| Additions to property, plant, and equipment | | (1,423) | | | (1,962) | | | |
| Issuance of term debt, net of issuance costs | | 13,000 | | | — | | | |
| Repayment of term debt | | (9,000) | | | (1,500) | | | |
| Proceeds from sales of common stock through employee equity incentive plans | | 427 | | | 491 | | | |
| | | | | | |
| | | | | | |
| | | | | | |
| | | | | | |
| Restricted stock unit withholdings | | (617) | | | (181) | | | |
| | | | | | |
| | | | | | |
| | | | | | |
| | | | | | |
| Other financing | | 154 | | | (397) | | | |
| Net cash provided by (used for) financing activities | | (8,548) | | | 586 | | | |
| | | | | | |
| Net increase (decrease) in cash, cash equivalents, and restricted cash | | (1,115) | | | 1,444 | | | |
Cash, cash equivalents, and restricted cash, end of period1 | | $ | 13,597 | | | $ | 9,693 | | | |
| | | | | | |
| | | | | | |
| | | | | | | | | | | |
| Financial Statements | Consolidated Condensed Statements of Cash Flows | 6 |
| | | | | | | | | | | | | | | | |
| | Six Months Ended | | |
| (In Millions; Unaudited) | | Jun 27, 2026 | | Jun 28, 2025 | | |
| Non-cash supplemental disclosures: | | | | | | |
| | | | | | |
Acquisition of property, plant, and equipment2 | | $ | 3,148 | | | $ | 5,155 | | | |
| Recognition of capital-related government incentives | | $ | 632 | | | $ | 1,452 | | | |
| | | | | | |
| Cash paid during the period for: | | | | | | |
| Interest, net of capitalized interest | | $ | 531 | | | $ | 514 | | | |
| Income taxes, net of refunds | | $ | 904 | | | $ | 1,793 | | | |
| | | | | | |
| | | | | | |
| | | | | | |
1 Includes $50 million cash recorded within other current assets on the Consolidated Condensed Balance Sheets relating to Altera cash held for sale at June 28, 2025
2 Includes $626 million with extended payment terms of greater than 90 days in the six months ended June 27, 2026 ($960 million in the six months ended June 28, 2025).
See accompanying notes.
| | | | | | | | | | | |
| Financial Statements | Consolidated Condensed Statements of Cash Flows | 7 |
| | | | | |
Consolidated Condensed Statements of Stockholders' Equity | |
| |
| | | | | | | | | | | | | | | | | | | | | | | | | | | | | | | | | | | | | | |
| (In Millions, Except Per Share Amounts; Unaudited) | | Common Stock and Capital in Excess of Par Value | | Accumulated Other Comprehensive Income (Loss) | | Retained Earnings | | Non-Controlling Interests | | Total |
| Number of Shares | | Amount | | | | |
| Three Months Ended | | | | | | | | | | | | |
| | | | | | | | | | | | |
| Balance as of March 28, 2026 | | 5,023 | | | $ | 66,259 | | | $ | (44) | | | $ | 45,179 | | | $ | 13,595 | | | $ | 124,989 | |
| Net income (loss) | | — | | | — | | | — | | | (11,033) | | | 185 | | | (10,848) | |
| Other comprehensive income (loss) | | — | | | — | | | (36) | | | — | | | — | | | (36) | |
| Net proceeds attributed to Escrowed Shares issued | | 7 | | | 688 | | | — | | | — | | | — | | | 688 | |
| Partner contributions | | — | | | — | | | — | | | — | | | 2,019 | | | 2,019 | |
| Partner distributions declared and repurchase of subsidiary shares | | — | | | (13,545) | | | — | | | — | | | (285) | | | (13,830) | |
| Employee equity incentive plans | | 17 | | | — | | | — | | | — | | | — | | | — | |
| Share-based compensation | | — | | | 470 | | | — | | | — | | | 87 | | | 557 | |
| Restricted stock unit withholdings | | (4) | | | (92) | | | — | | | (304) | | | — | | | (396) | |
| Balance as of June 27, 2026 | | 5,043 | | | $ | 53,780 | | | $ | (80) | | | $ | 33,842 | | | $ | 15,601 | | | $ | 103,143 | |
| | | | | | | | | | | | |
| Balance as of March 29, 2025 | | 4,362 | | | $ | 51,920 | | | $ | (486) | | | $ | 48,322 | | | $ | 6,657 | | | $ | 106,413 | |
| | | | | | | | | | | | |
| Net income (loss) | | — | | | — | | | — | | | (2,918) | | | (106) | | | (3,024) | |
| Other comprehensive income (loss) | | — | | | — | | | 551 | | | — | | | — | | | 551 | |
| Net proceeds from partner contributions | | — | | | — | | | — | | | — | | | 1,283 | | | 1,283 | |
| Partner distributions declared | | — | | | — | | | — | | | — | | | (33) | | | (33) | |
| Employee equity incentive plans and other | | 20 | | | — | | | — | | | — | | | — | | | — | |
| Share-based compensation | | — | | | 597 | | | — | | | — | | | 67 | | | 664 | |
| Restricted stock unit withholdings | | (5) | | | (183) | | | — | | | 80 | | | — | | | (103) | |
| Balance as of June 28, 2025 | | 4,377 | | | $ | 52,334 | | | $ | 65 | | | $ | 45,484 | | | $ | 7,868 | | | $ | 105,751 | |
| | | | | | | | | | | | |
| Six Months Ended | | | | | | | | | | | | |
| | | | | | | | | | | | |
| Balance as of December 27, 2025 | | 4,994 | | | $ | 65,185 | | | $ | 113 | | | $ | 48,983 | | | $ | 12,079 | | | $ | 126,360 | |
| Net income (loss) | | — | | | — | | | — | | | (14,761) | | | (368) | | | (15,129) | |
| Other comprehensive income (loss) | | — | | | — | | | (193) | | | — | | | — | | | (193) | |
| Net proceeds attributed to Escrowed Shares issued | | 13 | | | 949 | | | — | | | — | | | — | | | 949 | |
| Partner contributions and issuance of subsidiary shares | | — | | | — | | | — | | | — | | | 4,109 | | | 4,109 | |
| Partner distributions declared and repurchase of subsidiary shares | | — | | | (13,545) | | | — | | | — | | | (390) | | | (13,935) | |
| Employee equity incentive plans | | 45 | | | 427 | | | — | | | — | | | — | | | 427 | |
| Share-based compensation | | — | | | 1,001 | | | — | | | — | | | 171 | | | 1,172 | |
| Restricted stock unit withholdings | | (9) | | | (237) | | | — | | | (380) | | | — | | | (617) | |
| Balance as of June 27, 2026 | | 5,043 | | | $ | 53,780 | | | $ | (80) | | | $ | 33,842 | | | $ | 15,601 | | | $ | 103,143 | |
| | | | | | | | | | | | |
| Balance as of December 28, 2024 | | 4,330 | | | $ | 50,949 | | | $ | (711) | | | $ | 49,032 | | | $ | 5,762 | | | $ | 105,032 | |
Opening balance adjustment1 | | — | | | — | | | — | | | 49 | | | — | | | 49 | |
| Net income (loss) | | — | | | — | | | — | | | (3,739) | | | (172) | | | (3,911) | |
| Other comprehensive income (loss) | | — | | | — | | | 776 | | | — | | | — | | | 776 | |
| Net proceeds from partner contributions | | — | | | (2) | | | — | | | — | | | 2,240 | | | 2,238 | |
| Partner distributions declared | | — | | | — | | | — | | | — | | | (91) | | | (91) | |
| Employee equity incentive plans and other | | 56 | | | 491 | | | — | | | — | | | — | | | 491 | |
| Share-based compensation | | — | | | 1,219 | | | — | | | — | | | 129 | | | 1,348 | |
| Restricted stock unit withholdings | | (9) | | | (323) | | | — | | | 142 | | | — | | | (181) | |
| Balance as of June 28, 2025 | | 4,377 | | | $ | 52,334 | | | $ | 65 | | | $ | 45,484 | | | $ | 7,868 | | | $ | 105,751 | |
1 We made a cumulative-effect adjustment to the opening balance of retained earnings upon adopting ASU 2023-08 in 2025.
| | | | | | | | | | | |
| Financial Statements | Consolidated Condensed Statements of Stockholders' Equity | 8 |
| | | | | |
Notes to Consolidated Condensed Financial Statements | |
| |
| | | | | |
| Note 1 : | Basis of Presentation |
We prepared our interim Consolidated Condensed Financial Statements that accompany these notes in conformity with U.S. GAAP, consistent in all material respects with those applied in our 2025 Form 10-K.
We have made estimates and judgments affecting the amounts reported in our Consolidated Condensed Financial Statements and the accompanying notes. The actual results that we experience may differ materially from our estimates. The interim financial information is unaudited, and reflects all normal adjustments that are, in our opinion, necessary to provide a fair statement of results for the interim periods presented. This report should be read in conjunction with our 2025 Form 10-K where we include additional information on our accounting policies and the methods and assumptions used in our estimates.
We made certain reclassifications within our Consolidated Condensed Financial Statements, and, in certain cases, adjusted prior periods to conform to the current period presentation. These reclassifications had no impact on previously reported net income (loss) or stockholders' equity.
| | | | | |
| Note 2 : | Operating Segments |
We organize and manage our business as follows:
▪Intel Products:
▪Client Computing and Physical AI Group (CCPG), formerly the Client Computing Group (CCG)
▪Data Center and AI (DCAI)
▪Intel Foundry
▪All Other
▪Mobileye
▪Other
CCPG, DCAI and Intel Foundry are our reportable operating segments. In addition to these reportable segments, we present an "All Other" category, which is not a reportable segment. When we enter into federal contracts, they are aligned to the sponsoring operating segment.
The accounting policies applied to our segments follow those used by Intel as a whole. A summary of the basis on which we report our operating segment revenues and operating income (loss) is as follows:
Intel Products: CCPG and DCAI
▪Segment revenue: consists of revenues from external customers. Our Intel Products operating segments represent most of our consolidated revenue and are derived from our principal products that incorporate various components and technologies, including a microprocessor and chipset, a stand-alone SoC, or a multichip package, which are based on Intel architecture.
▪Segment expenses: consist of intersegment charges for product manufacturing and related services from Intel Foundry, external foundry and other manufacturing expenses, product development costs, allocated expenses as described below and direct operating expenses.
Intel Foundry
▪Segment revenue: consists substantially of intersegment product and services revenue for wafer fabrication, substrates and other related products and services sold to Intel Products and certain other Intel internal businesses. We recognize intersegment revenue based on the completion of performance obligations. Product revenue is recognized upon transfer of ownership, which is generally at the completion of wafer sorting. Backend service revenue is recognized upon the completion of assembly and test milestones, which approximates the recognition of revenue over the service period. Intersegment sales are recorded at prices that are intended to approximate market pricing. Intel Foundry also includes certain third-party foundry and assembly and test revenues from external customers that totaled $293 million in the three months ended June 27, 2026 and $467 million in the first six months of 2026 ($22 million in the three months ended June 28, 2025 and $53 million in the first six months of 2025).
▪Segment expenses: consists of direct expenses for technology development, product manufacturing and services provided by Intel Foundry to internal and external customers, allocated expenses as described below and direct operating expenses. Direct expenses for product manufacturing include excess capacity charges, if any.
| | | | | | | | | | | |
| Financial Statements | Notes to Financial Statements | 9 |
All Other
Our "All Other" category includes the results of operations from non-reportable segments, including our Mobileye business, our IMS business, start-up businesses that support our initiatives and historical results of operations from divested businesses, including Altera. Altera, which was previously a wholly owned subsidiary, was deconsolidated from our Consolidated Condensed Financial Statements effective September 12, 2025, following the closing of the sale of 51% of Altera's issued and outstanding common stock. Altera's financial results of operations were included in our "All Other" category through September 11, 2025. The financial results of our "All Other" category include intersegment product and services revenue and intersegment expenses primarily between Altera and our Intel Foundry segment during the periods in which we consolidated Altera.
We allocate operating expenses from our sales and marketing group to the Intel Products operating segments and allocate substantially all our operating expenses from our general and administrative groups to our reportable operating segments.
We estimate that the substantial majority of our consolidated depreciation expense in the three and six months ended June 27, 2026 and June 28, 2025 was incurred by Intel Foundry. Intel Foundry depreciation expense is substantially included in overhead cost pools and then combined with other costs, and subsequently absorbed into inventory as each product passes through the manufacturing process and is sold to Intel Products or other customers. As a result, it is impracticable to determine the total depreciation expense included as a component of each Intel Products operating segment's operating income (loss).
We do not allocate the following corporate operating expenses to our operating segments:
▪restructuring and other charges;
▪share-based compensation; and
▪certain acquisition-related costs, including amortization and any impairment of acquisition-related intangibles and goodwill.
We do not allocate the following non-operating items to our operating segments:
▪gains and losses from equity investments;
▪interest and other, net; and
▪income taxes.
Our CEO is our CODM. The CODM uses segment revenue and segment operating income (loss) to evaluate each segment's performance and allocate resources. These financial measures are utilized during our budgeting and forecasting process to assess profitability and enable decision-making regarding strategic initiatives, capital investments and personnel across all operating segments. Segment operating results regularly reviewed by our CODM also include total cost of sales and operating expenses directly attributable to each segment. We centrally manage all procurement, treasury and asset management functions across the enterprise and do not maintain separate balance sheets by segment within our systems of record, nor does our CODM receive total asset information by segment for purposes of assessing segment performance and allocating resources.
Intersegment eliminations: Intersegment sales and related gross profit on inventory recorded at the end of the period or sold through to third-party customers is eliminated for consolidation purposes. The Intel Products operating segments and Intel Foundry are meant to reflect separate fabless semiconductor and foundry companies, respectively. Thus, certain intersegment activity is captured within the intersegment eliminations upon consolidation and presented at the Intel consolidated level. This activity primarily relates to inventory reserves, which are determined and recorded based on our accounting policies for Intel as a whole but are only recorded by the Intel Products operating segments upon transfer of inventory from Intel Foundry. If a reserve is identified that relates to neither Intel Products operating segments nor Intel Foundry, the reserve is recognized as activity within the intersegment eliminations for Intel on a consolidated basis.
| | | | | | | | | | | |
| Financial Statements | Notes to Financial Statements | 10 |
Net revenue, cost of sales and operating expenses and operating income (loss) for each period were as follows: | | | | | | | | | | | | | | | | | | | | | | | | | | | | | | | | | | | | | | | | | | | | | | | | | | |
| | Three Months Ended |
| (In Millions) | | Jun 27, 2026 |
| | Intel Products | | | | | | | | | | |
| | CCPG | | DCAI | | Total Intel Products | | Intel Foundry | | All Other | | Corporate Unallocated | | Intersegment Eliminations | | Total Consolidated |
| Revenue | | $ | 8,877 | | | $ | 6,262 | | | $ | 15,139 | | | $ | 5,765 | | | $ | 701 | | | $ | — | | | $ | (5,477) | | | $ | 16,128 | |
Cost of sales and operating expenses | | 6,534 | | | 3,788 | | | 10,322 | | | 7,854 | | | 471 | | | 1,416 | | | (5,731) | | | 14,332 | |
Operating income (loss) | | $ | 2,343 | | | $ | 2,474 | | | $ | 4,817 | | | $ | (2,089) | | | $ | 230 | | | $ | (1,416) | | | $ | 254 | | | $ | 1,796 | |
| | | | | | | | | | | | | | | | | | | | | | | | | | | | | | | | | | | | | | | | | | | | | | | | | | |
| | Three Months Ended |
| (In Millions) | | Jun 28, 2025 |
| | Intel Products | | | | | | | | | | |
| | CCPG | | DCAI | | Total Intel Products | | Intel Foundry | | All Other | | Corporate Unallocated | | Intersegment Eliminations | | Total Consolidated |
| Revenue | | $ | 7,871 | | | $ | 3,939 | | | $ | 11,810 | | | $ | 4,417 | | | $ | 1,053 | | | $ | — | | | $ | (4,421) | | | $ | 12,859 | |
Cost of sales and operating expenses | | 5,818 | | | 3,306 | | | 9,124 | | | 7,585 | | | 984 | | | 2,755 | | | (4,413) | | | 16,035 | |
| Operating income (loss) | | $ | 2,053 | | | $ | 633 | | | $ | 2,686 | | | $ | (3,168) | | | $ | 69 | | | $ | (2,755) | | | $ | (8) | | | $ | (3,176) | |
| | | | | | | | | | | | | | | | | | | | | | | | | | | | | | | | | | | | | | | | | | | | | | | | | | |
| | Six Months Ended |
| (In Millions) | | Jun 27, 2026 |
| | Intel Products | | | | | | | | | | |
| | CCPG | | DCAI | | Total Intel Products | | Intel Foundry | | All Other | | Corporate Unallocated | | Intersegment Eliminations | | Total Consolidated |
| Revenue | | $ | 16,604 | | | $ | 11,314 | | | $ | 27,918 | | | $ | 11,186 | | | $ | 1,329 | | | $ | — | | | $ | (10,728) | | | $ | 29,705 | |
Cost of sales and operating expenses | | 11,745 | | | 7,298 | | | 19,043 | | | 15,712 | | | 997 | | | 6,496 | | | (11,203) | | | 31,045 | |
Operating income (loss) | | $ | 4,859 | | | $ | 4,016 | | | $ | 8,875 | | | $ | (4,526) | | | $ | 332 | | | $ | (6,496) | | | $ | 475 | | | $ | (1,340) | |
| | | | | | | | | | | | | | | | | | | | | | | | | | | | | | | | | | | | | | | | | | | | | | | | | | |
| | Six Months Ended |
| (In Millions) | | Jun 28, 2025 |
| | Intel Products | | | | | | | | | | |
| | CCPG | | DCAI | | Total Intel Products | | Intel Foundry | | All Other | | Corporate Unallocated | | Intersegment Eliminations | | Total Consolidated |
| Revenue | | $ | 15,500 | | | $ | 8,065 | | | $ | 23,565 | | | $ | 9,084 | | | $ | 1,996 | | | $ | — | | | $ | (9,119) | | | $ | 25,526 | |
Cost of sales and operating expenses | | 11,086 | | | 6,857 | | | 17,943 | | | 14,572 | | | 1,824 | | | 4,015 | | | (9,351) | | | 29,003 | |
| Operating income (loss) | | $ | 4,414 | | | $ | 1,208 | | | $ | 5,622 | | | $ | (5,488) | | | $ | 172 | | | $ | (4,015) | | | $ | 232 | | | $ | (3,477) | |
Corporate Unallocated Expenses
Corporate unallocated expenses include certain operating expenses not allocated to specific operating segments. The nature of these expenses may vary, but primarily consist of restructuring and other charges, share-based compensation and certain acquisition-related costs. | | | | | | | | | | | | | | | | | | | | | | | | | | |
| | Three Months Ended | | Six Months Ended |
| (In Millions) | | Jun 27, 2026 | | Jun 28, 2025 | | Jun 27, 2026 | | Jun 28, 2025 |
| | | | | | | | |
Restructuring and other charges1 | | $ | 170 | | | $ | 1,890 | | | $ | 4,240 | | | $ | 2,046 | |
| Share-based compensation | | 687 | | | 664 | | | 1,307 | | | 1,348 | |
| Acquisition-related costs | | 117 | | | 119 | | | 230 | | | 270 | |
| Other | | 442 | | | 82 | | | 719 | | | 351 | |
| Total corporate unallocated expenses | | $ | 1,416 | | | $ | 2,755 | | | $ | 6,496 | | | $ | 4,015 | |
1 See "Note 6: Restructuring and Other Charges" within Notes to Consolidated Condensed Financial Statements for further information.
| | | | | | | | | | | |
| Financial Statements | Notes to Financial Statements | 11 |
| | | | | |
| Note 3 : | Non-Controlling Interests |
| | | | | | | | | | | | | | | | |
| | Non-Controlling Ownership % |
| | Jun 27, 2026 | | Jun 28, 2025 | | |
| Ireland SCIP | | — | % | | 49 | % | | |
| Arizona SCIP | | 49 | % | | 49 | % | | |
| Mobileye | | 23 | % | | 13 | % | | |
| IMS | | 32 | % | | 32 | % | | |
| | | | | | | | | | | | | | | | | | | | | | | | |
| (In Millions) | | Ireland SCIP | | Arizona SCIP | | Mobileye | | IMS | | Total |
| Non-controlling interests as of Dec 27, 2025 | | $ | 112 | | | $ | 9,106 | | | $ | 2,748 | | | $ | 113 | | | $ | 12,079 | |
| Partner contributions | | — | | | 4,082 | | | — | | | — | | | 4,082 | |
| Partner distributions declared | | (105) | | | (119) | | | — | | | — | | | (224) | |
| Changes in equity of non-controlling interest holders | | (142) | | | — | | | 174 | | | — | | | 32 | |
| Net income (loss) attributable to non-controlling interests | | 135 | | | 359 | | | (872) | | | 10 | | | (368) | |
| Non-controlling interests as of Jun 27, 2026 | | $ | — | | | $ | 13,428 | | | $ | 2,050 | | | $ | 123 | | | $ | 15,601 | |
| | | | | | | | | | |
| (In Millions) | | Ireland SCIP | | Arizona SCIP | | Mobileye | | IMS | | Total |
| Non-controlling interests as of Dec 28, 2024 | | $ | 61 | | | $ | 3,888 | | | $ | 1,672 | | | $ | 141 | | | $ | 5,762 | |
| Partner contributions | | — | | | 2,240 | | | — | | | — | | | 2,240 | |
| Partner distributions declared | | (91) | | | — | | | — | | | — | | | (91) | |
| Changes in equity of non-controlling interest holders | | — | | | — | | | 129 | | | — | | | 129 | |
| Net income (loss) attributable to non-controlling interests | | 98 | | | (232) | | | (19) | | | (19) | | | (172) | |
| Non-controlling interests as of Jun 28, 2025 | | $ | 68 | | | $ | 5,896 | | | $ | 1,782 | | | $ | 122 | | | $ | 7,868 | |
Semiconductor Co-Investment Program
Ireland SCIP
A limited liability company (Ireland SCIP) was established in 2024 in connection with our Intel-owned, Ireland-based wafer fabrication plant (Fab 34), with Apollo acquiring a 49% minority ownership interest and the parties entering into related operating and other ancillary agreements governing the construction, operation and utilization of Fab 34. As of March 28, 2026 and December 27, 2025, we consolidated the results of Ireland SCIP, a VIE, into our Consolidated Condensed Financial Statements because we were the primary beneficiary.
As of December 27, 2025, we had a non-designated derivative, based on liquidated damage provisions related to Fab 34 construction delays, recognized for $755 million within other accrued liabilities and other long-term liabilities. In the first quarter of 2026, our expectations regarding the achievement of certain construction milestones evolved favorably and, as a result, we recognized a benefit of $223 million within interest and other, net from a reduction in the fair value of the delay-related liquidated damages liability.
On April 8, 2026, we reacquired Apollo's 49% minority ownership interest in Ireland SCIP for aggregate cash consideration of $14.2 billion, inclusive of transaction costs. As of June 27, 2026, we own 100% of Ireland SCIP and the related operating and other ancillary agreements between Ireland SCIP, ourselves and Apollo have been substantially terminated. As a result of this equity transaction, we eliminated the $142 million non-controlling interest balance related to Ireland SCIP, extinguished the $532 million derivative liability associated with the delay-related liquidated damage provisions (refer to "Note 13: Derivative Financial Instruments” within Notes to Consolidated Condensed Financial Statements) and recognized the residual consideration of $13.5 billion as a reduction to our capital in excess of par value. Cash consideration paid to Apollo has been included within partner distributions in the Consolidated Condensed Statements of Cash Flows for the six months ended June 27, 2026.
| | | | | | | | | | | |
| Financial Statements | Notes to Financial Statements | 12 |
Arizona SCIP
We consolidate the results of an Arizona limited liability company (Arizona SCIP), a VIE, into our Consolidated Condensed Financial Statements because we are the primary beneficiary. Contributions and distributions made between Arizona SCIP and investors are generally made based on our and Brookfield's proportional ownership interest in Arizona SCIP.
We are the primary beneficiary of two new chip factories still partially under construction by Arizona SCIP; we have the right to direct how and for what purpose the underlying assets will be used and to purchase 100% of the wafer output. During the year ended December 27, 2025, Arizona SCIP began placing manufacturing assets into service, making the assets available for our use. The production contract commenced in the first quarter of 2026 and we are required to both operate Arizona SCIP at minimum production levels and limit excess inventory held on site or we will be subject to certain volume-related damages payable to Arizona SCIP.
The property, plant, and equipment assets owned by Arizona SCIP and included in our Consolidated Condensed Balance Sheets as of June 27, 2026, which are not available to us as they can be used only to settle obligations of the VIE, consisted of construction in progress assets of $6.0 billion ($5.6 billion as of December 27, 2025) and assets that have been placed into service of $13.8 billion ($12.2 billion as of December 27, 2025). The remaining assets and liabilities of Arizona SCIP were eliminated in our Consolidated Condensed Balance Sheets.
Mobileye
We consolidate our majority-owned subsidiary Mobileye pursuant to the voting interest model. In the first quarter of 2026, the non-cash impairment of goodwill related to our Mobileye reporting unit was attributed to Intel and to non-controlling interest holders based on our proportional ownership (see "Note 10: Goodwill" within Notes to Consolidated Condensed Financial Statements).
| | | | | |
| Note 4 : | Earnings (Loss) Per Share and Stockholders' Equity |
We computed basic earnings (loss) per share of common stock based on the weighted average number of shares of common stock that, during the period, are outstanding or are considered not contingently issuable based on the terms of the Warrant and Common Stock Agreement (U.S. Government Agreement). We computed diluted earnings (loss) per share of common stock based on the weighted average number of shares of common stock outstanding plus potentially dilutive shares of common stock outstanding during the period, if applicable.
| | | | | | | | | | | | | | | | | | | | | | | | | | |
| | | Three Months Ended | | Six Months Ended |
| (In Millions, Except Per Share Amounts) | | Jun 27, 2026 | | Jun 28, 2025 | | Jun 27, 2026 | | Jun 28, 2025 |
| Net income (loss) | | $ | (10,848) | | | $ | (3,024) | | | $ | (15,129) | | | $ | (3,911) | |
| Less: net income (loss) attributable to non-controlling interests | | 185 | | | (106) | | | (368) | | | (172) | |
| Net income (loss) attributable to Intel | | $ | (11,033) | | | $ | (2,918) | | | $ | (14,761) | | | $ | (3,739) | |
| Weighted average shares of common stock outstanding—basic | | 5,104 | | | 4,369 | | | 5,108 | | | 4,356 | |
| | | | | | | | |
| | | | | | | | |
| Weighted average shares of common stock outstanding—diluted | | 5,104 | | | 4,369 | | | 5,108 | | | 4,356 | |
| Earnings (loss) per share attributable to Intel—basic | | $ | (2.16) | | | $ | (0.67) | | | $ | (2.89) | | | $ | (0.86) | |
| Earnings (loss) per share attributable to Intel—diluted | | $ | (2.16) | | | $ | (0.67) | | | $ | (2.89) | | | $ | (0.86) | |
Potentially dilutive shares of common stock from employee equity incentive plans and stock issuances are determined by applying the treasury stock method to the assumed exercise of outstanding stock options, the assumed vesting of outstanding RSUs, and the assumed issuance of common stock under the stock purchase plan.
The dilutive impact from the assumed issuance of common stock associated with contractual transactions, including the release of Escrowed Shares under Secure Enclave, that settled during the three and six months ended June 27, 2026 is determined from the date of the beginning of the period to the date the Escrowed Shares are released. We reflect these contractual transactions in the calculation of diluted EPS, as applicable, using the treasury stock method.
Due to our net losses in the three and six months ended June 27, 2026 and June 28, 2025, the assumed exercise of outstanding stock options, the assumed vesting of outstanding RSUs, the assumed issuance of common stock under the stock purchase plan, and the assumed issuance of common stock associated with equity issuance agreements, including Escrowed Shares released, as applicable, had an anti-dilutive effect on and were excluded from the computation of diluted earnings (loss) per share attributable to Intel. In the three and six months ended June 27, 2026, 70 million and 67 million anti-dilutive shares were excluded from the computation of earnings (loss) per share, respectively. In the three months ended June 28, 2025, securities that would have been anti-dilutive were insignificant and in the six months ended June 28, 2025, 158 million anti-dilutive shares were excluded from the computation of earnings (loss) per share.
| | | | | | | | | | | |
| Financial Statements | Notes to Financial Statements | 13 |
Escrowed Shares Issued to the U.S. Government
Per the terms of our previously-disclosed U.S. Government Agreement that we entered into with the DOC on August 22, 2025, upon receipt of cash proceeds for our performance under Secure Enclave, we released 7 million and 13 million Escrowed Shares during the three and six months ended June 27, 2026, respectively.
During the three and six months ended June 27, 2026, we recognized $12.5 billion and $13.6 billion, respectively, of losses related to the net change in fair value of both Escrowed Shares released and Escrowed Shares still held in escrow at June 27, 2026. The fair value of the Escrowed Shares derivative liability was $15.6 billion at June 27, 2026 and $2.7 billion at December 27, 2025, which we have recognized within other accrued liabilities and other long-term liabilities.
Of the 143 million Escrowed Shares not yet released as of June 27, 2026, 71 million are considered not contingently issuable based on the terms of the U.S. Government Agreement and, as such, have been included in our computation of basic earnings (loss) per share for the three and six months ended June 27, 2026. The remaining 71 million Escrowed Shares not yet released are considered contingently issuable based on the DOC's disbursements under Secure Enclave and, therefore, are excluded from basic and diluted earnings (loss) per share until the contingencies are met.
We also issued warrants to the DOC to purchase up to 241 million shares of our common stock at $20.00 per share (Warrants) that become exercisable if we cease to directly or indirectly own at least 51% of our foundry business. Potentially dilutive shares issuable under the Warrants have been excluded from all basic and diluted earnings (loss) per share calculations for the three and six months ended June 27, 2026 as the Warrants are neither currently nor expected to become exercisable. If exercised, we can elect to settle the Warrants in net cash or net shares.
| | | | | |
| Note 5 : | Other Financial Statement Details |
Restricted Cash
We have $723 million of restricted cash, of which $170 million is included in other current assets and $553 million is included in other long-term assets within the Consolidated Condensed Balance Sheets as of June 27, 2026 ($447 million as of December 27, 2025 is included in other long-term assets). Such restricted cash is also included within cash, cash equivalents, and restricted cash in the Consolidated Condensed Statements of Cash Flows for the six months ended June 27, 2026. The restricted cash serves as collateral for third-party arrangements we entered into and is considered legally restricted due to limitations on usage and withdrawal.
Accounts Receivable
We may sell certain of our accounts receivable on a non-recourse basis to third-party financial institutions. We record these transactions as sales of receivables and present cash proceeds as cash provided by operating activities in the Consolidated Condensed Statements of Cash Flows. We did not sell any accounts receivable under non-recourse factoring arrangements during the first six months of 2026 ($1.6 billion were sold during the first six months of 2025).
Inventories
| | | | | | | | | | | | | | |
| (In Millions) | | Jun 27, 2026 | | Dec 27, 2025 |
| Raw materials | | $ | 1,046 | | | $ | 993 | |
| Work in process | | 8,685 | | | 7,840 | |
| Finished goods | | 2,761 | | | 2,785 | |
| Total inventories | | $ | 12,492 | | | $ | 11,618 | |
Property, Plant, and Equipment
We invest in and deploy manufacturing assets in response to manufacturing capacity requirements based upon short- and long-term demand forecasts and economic returns relative to capital outlays. We regularly monitor, evaluate, and adjust our manufacturing capacity footprint in response to a number of volatile factors that impact our business, including demand for our products and services and the state of the semiconductor industry as a whole. In connection with the preparation of our Consolidated Condensed Financial Statements for the second quarter of 2025, we evaluated our process technology node capacities relative to projected market demand for our products and services, and concluded that our manufacturing asset portfolio exceeded manufacturing capacity requirements. Upon performing a re-use assessment, we impaired and accelerated depreciation for certain manufacturing assets. In total, we recorded non-cash impairments and accelerated depreciation charges of $460 million and $337 million, respectively, in the second quarter of 2025, net of certain items. All charges were recognized in cost of sales within our Intel Foundry operating segment.
We also incurred $416 million of other non-cash asset impairment and accelerated depreciation charges in the second quarter of 2025 as a direct result of the 2025 Restructuring Plan (see "Note 6: Restructuring and Other Charges" within Notes to Consolidated Condensed Financial Statements). These charges were included as a component of "corporate unallocated expenses" within the restructuring and other charges category presented in "Note 2: Operating Segments" within Notes to Consolidated Condensed Financial Statements.
| | | | | | | | | | | |
| Financial Statements | Notes to Financial Statements | 14 |
Other Accrued Liabilities
Other accrued liabilities as of June 27, 2026 include deferred compensation of $3.0 billion ($3.2 billion as of December 27, 2025) and $8.8 billion related to the fair value of the Escrowed Shares derivative liability ($1.1 billion as of December 27, 2025). Refer to "Note 4: Earnings (Loss) Per Share and Stockholders' Equity" within Notes to Consolidated Condensed Financial Statements.
Other Long-term Liabilities
Other long-term liabilities as of June 27, 2026 include $1.2 billion related to customer deposits received to secure product supply in future periods and $6.8 billion related to the fair value of the Escrowed Shares derivative liability ($1.6 billion as of December 27, 2025). Refer to "Note 4: Earnings (Loss) Per Share and Stockholders' Equity" within Notes to Consolidated Condensed Financial Statements.
Interest and Other, Net | | | | | | | | | | | | | | | | | | | | | | | | | | |
| | | Three Months Ended | | Six Months Ended |
| (In Millions) | | Jun 27, 2026 | | Jun 28, 2025 | | Jun 27, 2026 | | Jun 28, 2025 |
| Interest income | | $ | 334 | | | $ | 210 | | | $ | 667 | | | $ | 455 | |
| Interest expense | | (321) | | | (227) | | | (585) | | | (526) | |
| Gain (loss) on mark-to-market of Escrowed Shares | | (12,529) | | | — | | | (13,619) | | | — | |
| | | | | | | | |
| Other, net | | (60) | | | (78) | | | 223 | | | (197) | |
| Total interest and other, net | | $ | (12,576) | | | $ | (95) | | | $ | (13,314) | | | $ | (268) | |
Interest expense is net of $276 million of interest capitalized in the second quarter of 2026 and $542 million in the first six months of 2026 ($368 million in the second quarter of 2025 and $680 million in the first six months of 2025).
Gain (loss) on mark-to-market of Escrowed Shares is related to changes in fair value of the derivative liability for the Escrowed Shares (refer to "Note 4: Earnings (Loss) Per Share and Stockholders' Equity" within Notes to Consolidated Condensed Financial Statements).
Other, net in the first six months of 2026 included income of $223 million resulting from the change in fair value of liquidated damage provisions related to our Ireland SCIP arrangement (refer to "Note 3: Non-Controlling Interests" within Notes to Consolidated Condensed Financial Statements). In the first six months of 2025, other, net included charges of $94 million related to the sale of our NAND memory business (refer to "Note 9: Acquisitions and Divestitures" within Notes to Consolidated Condensed Financial Statements).
Government Incentives
In the first six months of 2026, incentives attributable to AMIC were $678 million ($759 million in the first six months of 2025), which may be refunded to us in cash to the extent the credits exceed our outstanding income tax liabilities (refer to "Note 7: Income Taxes" within Notes to Consolidated Condensed Financial Statements).
| | | | | |
| Note 6 : | Restructuring and Other Charges |
| | | | | | | | | | | | | | | | | | | | | | | | | | |
| | Three Months Ended | | Six Months Ended |
| (In Millions) | | Jun 27, 2026 | | Jun 28, 2025 | | Jun 27, 2026 | | Jun 28, 2025 |
| Employee severance and benefit arrangements | | $ | 161 | | | $ | 1,466 | | | $ | 235 | | | $ | 1,607 | |
| | | | | | | | |
| Litigation charges and other | | 7 | | | 8 | | | 38 | | | 20 | |
| Asset impairment charges | | 2 | | | 416 | | | 3,967 | | | 419 | |
| Total restructuring and other charges | | $ | 170 | | | $ | 1,890 | | | $ | 4,240 | | | $ | 2,046 | |
In the second quarter of 2025, we announced and commenced the 2025 Restructuring Plan, which was subsequently approved and committed to by our management. This initiative is intended to lower expenses, streamline our organizational structure and reduce management layers across functions while reallocating resources toward our core client and server businesses by reducing lower-priority programs and initiatives. Restructuring charges are primarily comprised of employee severance and benefit arrangements, non-cash asset impairment and accelerated depreciation charges resulting from exit activities, as well as impairment charges relating to real estate exits and consolidations. These charges were excluded from our operating segments' results and included as "corporate unallocated expenses" within the restructuring and other charges category presented in "Note 2: Operating Segments" within Notes to Consolidated Condensed Financial Statements. The total expected and cumulative cost of the 2025 Restructuring Plan as of June 27, 2026 was $2.2 billion. Any changes to our estimates or timing will be reflected in our results of operations in future periods. The substantial majority of actions pursuant to the 2025 Restructuring Plan were completed in 2025 with the remainder expected to be completed in 2026.
In the third quarter of 2024, the 2024 Restructuring Plan was announced and a series of cost and capital reduction initiatives were implemented. We have incurred total charges of approximately $3.2 billion under the 2024 Restructuring Plan, which is expected to be completed in 2026.
| | | | | | | | | | | |
| Financial Statements | Notes to Financial Statements | 15 |
Employee severance and benefit arrangements included charges of $161 million and $235 million during the three and six months ended June 27, 2026, respectively, primarily resulting from charges related to the 2025 Restructuring Plan. Other charges incurred during the three and six months ended June 27, 2026 related to the 2024 Restructuring Plan. During the three months ended June 28, 2025, charges of $1.4 billion related to the 2025 Restructuring Plan, while the remaining charges incurred during the three and six months ended June 28, 2025 primarily related to the 2024 Restructuring Plan.
Restructuring activities related to employee severance and benefit arrangements under the 2025 Restructuring Plan were as follows: | | | | | | | | | | |
| (In Millions) | | 2025 Restructuring Plan | | |
| | | | |
| | | | |
| | | | |
Accrued balance as of December 27, 2025 | | $ | 417 | | | |
| Accruals and adjustments | | 173 | | | |
| Cash payments | | (288) | | | |
Accrued restructuring balance as of June 27, 2026 | | $ | 302 | | | |
The accrued restructuring balance as of June 27, 2026 and December 27, 2025 was recorded as a current liability within accrued compensation and benefits on the Consolidated Condensed Balance Sheets.
Asset impairment charges incurred in the first six months of 2026 were related to non-cash goodwill impairment charges of $3.9 billion (see "Note 10: Goodwill" within Notes to Consolidated Condensed Financial Statements). In the first six months of 2025, we incurred non-cash charges associated with the 2025 Restructuring Plan resulting from the exit of certain non-core lines of business and the consolidation and exit of certain real estate properties.
| | | | | | | | | | | | | | | | | | | | | | | | | | |
| | Three Months Ended | | Six Months Ended |
| ($ In Millions) | | Jun 27, 2026 | | Jun 28, 2025 | | Jun 27, 2026 | | Jun 28, 2025 |
| Income (loss) before taxes | | $ | (10,819) | | | $ | (2,769) | | | $ | (14,765) | | | $ | (3,355) | |
| Provision for (benefit from) taxes | | $ | 29 | | | $ | 255 | | | $ | 364 | | | $ | 556 | |
| Effective tax rate | | (0.3) | % | | (9.2) | % | | (2.5) | % | | (16.6) | % |
In the three and six months ended June 27, 2026 and June 28, 2025, our provision for income taxes was determined using our estimated annual effective tax rate applied to our year-to-date ordinary income (loss) before taxes, adjusted for discrete items. In all periods presented, we were not able to benefit from our current year domestic loss before taxes due to the domestic valuation allowance. Our provision for taxes decreased in the three and six months ended June 27, 2026 compared to the three and six months ended June 28, 2025 primarily due to increased share-based compensation deductions. Additionally, our Consolidated Condensed Balance Sheets as of June 27, 2026 and December 27, 2025 contain certain tax receivables of $7.5 billion and $7.6 billion, respectively, within other current assets, and $1.3 billion and $182 million, respectively, within other long-term assets, primarily associated with AMIC claims.
| | | | | | | | | | | |
| Financial Statements | Notes to Financial Statements | 16 |
Short-term Investments
Short-term investments include marketable debt investments in corporate debt, government debt, and financial institution instruments, and are recorded within cash and cash equivalents and short-term investments on the Consolidated Condensed Balance Sheets. Government debt includes instruments such as non-U.S. government bills and bonds and U.S. agency securities. Financial institution instruments include instruments issued or managed by financial institutions in various forms, such as fixed- and floating-rate bonds, money market fund deposits, and time deposits. As of June 27, 2026 and December 27, 2025, a substantial majority of time deposits were issued by institutions outside the U.S.
The fair value of our economically hedged marketable debt investments was $13.2 billion as of June 27, 2026 ($21.8 billion as of December 27, 2025). For economically hedged investments still held at the reporting date, we recorded net losses of $95 million in the second quarter of 2026 and net losses of $249 million in the first six months of 2026 (net gains of $329 million in the second quarter of 2025 and net gains of $491 million in the first six months of 2025).
Our remaining unhedged marketable debt investments are reported at fair value, with unrealized gains or losses, net of tax, recorded in accumulated other comprehensive income (loss). The adjusted cost of our unhedged investments was $8.9 billion as of June 27, 2026 ($10.6 billion as of December 27, 2025), which approximated the fair value at each date.
The fair value of marketable debt investments, by contractual maturity, as of June 27, 2026, was as follows:
| | | | | | | | |
| (In Millions) | | Fair Value |
| Due in 1 year or less | | $ | 6,723 | |
| Due in 1–2 years | | 2,723 | |
| Due in 2–5 years | | 7,629 | |
| Due after 5 years | | 1,848 | |
Instruments not due at a single maturity date1 | | 3,240 | |
| Total | | $ | 22,163 | |
1 Instruments not due at a single maturity date is composed of money market fund deposits, which are classified as either short-term investments or cash and cash equivalents.
Equity Investments
| | | | | | | | | | | | | | |
| (In Millions) | | Jun 27, 2026 | | Dec 27, 2025 |
Marketable equity investments1 | | $ | 250 | | | $ | 484 | |
| Non-marketable equity investments | | 8,160 | | | 8,028 | |
| Total | | $ | 8,410 | | | $ | 8,512 | |
1 A significant portion of our marketable equity investments are subject to contractual or market-based restrictions, which limit the number of shares we may sell in a specified period of time, impacting our ability to liquidate these investments.
The components of gains (losses) on equity investments, net for each period were as follows:
| | | | | | | | | | | | | | | | | | | | | | | | | | |
| | | Three Months Ended | | Six Months Ended |
| (In Millions) | | Jun 27, 2026 | | Jun 28, 2025 | | Jun 27, 2026 | | Jun 28, 2025 |
| Unrealized gains (losses) on marketable equity investments, net | | $ | (60) | | | $ | (58) | | | $ | (216) | | | $ | (350) | |
Unrealized gains (losses) on non-marketable equity investments, net1 | | 10 | | | 473 | | | 112 | | | 473 | |
| Impairment charges on non-marketable equity investments | | (92) | | | (51) | | | (154) | | | (156) | |
| Unrealized gains (losses) on equity investments, net | | (142) | | | 364 | | | (258) | | | (33) | |
| Realized gains (losses) on sales of equity investments, net | | 103 | | | 138 | | | 147 | | | 423 | |
| Gains (losses) on equity investments, net | | $ | (39) | | | $ | 502 | | | $ | (111) | | | $ | 390 | |
1 Unrealized gains (losses) on non-marketable investments includes observable price adjustments and our share of equity method investee gains (losses) and certain distributions.
In the second quarter of 2025, we recognized upward observable price adjustments of $469 million within gains (losses) on equity investments, net, of which $396 million related to a single investee.
| | | | | | | | | | | |
| Financial Statements | Notes to Financial Statements | 17 |
Altera
In the third quarter of 2025, we closed the sale of Altera and retained a 49% interest in the business (refer to "Note 9: Acquisitions and Divestitures" within Notes to Consolidated Condensed Financial Statements). The carrying value of our non-marketable equity investment in Altera is classified within equity investments in the Consolidated Condensed Balance Sheets and was $3.2 billion as of June 27, 2026 and December 27, 2025.
We provide semiconductor wafer manufacturing services to Altera, a related party, in accordance with a wafer manufacturing and sale agreement, for which we recognized revenue of $181 million in the second quarter of 2026 and $320 million in the first six months of 2026. Additionally, and in connection with the divestiture, we have been and will be reimbursed for costs that we incur on behalf of Altera for certain corporate services delivered under a transition services agreement, which may include information technology, finance, supply chain, and other services provided on an interim basis. The majority of such corporate transition services ceased as of March 28, 2026.
| | | | | |
| Note 9 : | Acquisitions and Divestitures |
Mobileye's Acquisition of Mentee Robotics
On February 3, 2026, Mobileye closed the acquisition of Mentee Robotics, an AI-first humanoid robotics company, for a purchase price of $637 million. Acquisition consideration consisted primarily of $596 million in cash, net of cash acquired, with the residual in Mobileye's Class A shares that are not contingent on continuing employment. The purchase price, net of cash acquired, was primarily allocated to intangible assets of $128 million and goodwill of $498 million. The goodwill arising from the acquisition is attributed to the synergies and other benefits that are expected to be generated from the combination of Mobileye and Mentee Robotics, and the acquisition-related intangible assets are related to developed technology. We expect the goodwill to be deductible for tax purposes. The operating results of Mentee Robotics, which were not material for the three and six months ended June 27, 2026, are included in Mobileye's financial results within our "All Other" category of non-reportable segments. Our accounting for the transaction is based on our preliminary valuations and estimates and may be subject to change if additional information becomes available during the measurement period.
Altera Divestiture
On April 14, 2025, we signed a transaction agreement with SLP VII Gryphon Aggregator, L.P., an affiliate of SLP, to sell 51% of all issued and outstanding common stock of Altera, our wholly owned subsidiary as of that date. On September 12, 2025, we completed the divestiture of 51% of Altera for net purchase consideration of $4.3 billion, consisting of: $4.8 billion in cash proceeds received within the third quarter of 2025; $500 million in deferred cash proceeds payable to us no later than December 31, 2027; an offset of $400 million for cash transferred to Altera with the sale; an offset of approximately $469 million for separation and employee-related costs we have agreed to fund to SLP; and an offset for other direct and incremental costs incurred in connection with the sale.
As of June 27, 2026, the outstanding receivable from SLP was $473 million ($463 million as of December 27, 2025) recorded within other long-term assets for the present value of deferred consideration, which is not subject to any contingencies. As of June 27, 2026, $206 million and $53 million are recorded within other accrued liabilities and other long-term liabilities ($327 million and $97 million as of December 27, 2025), respectively, for amounts payable to SLP for separation and employee-related costs that have not yet been paid and that relate to the transaction.
We deconsolidated Altera from our Consolidated Condensed Balance Sheets at the September 12, 2025 transaction close date and account for our retained minority investment in Altera under the equity method of accounting.
NAND Memory Business
We sold our NAND memory technology and manufacturing business to SK hynix, which we deconsolidated upon closing the first phase of the transaction on December 29, 2021. On March 27, 2025, we closed the second phase of the transaction, collected the outstanding receivable and entered into a final release and settlement agreement with SK hynix primarily related to certain penalties and contingencies associated with the manufacturing and sale agreement between us and SK hynix. For the six months ended June 28, 2025, we recognized net charges of $94 million within interest and other, net for the amounts incurred pursuant to this agreement and recorded net proceeds of $1.9 billion within cash and cash equivalents.
| | | | | | | | | | | |
| Financial Statements | Notes to Financial Statements | 18 |
In the first quarter of 2026, we recognized non-cash goodwill impairment charges of $3.9 billion within restructuring and other charges in our Consolidated Condensed Statements of Operations, substantially all of which related to our Mobileye reporting unit.
Our quarterly qualitative impairment assessment for the first quarter of 2026 indicated that a more detailed quantitative analysis was necessary for our Mobileye reporting unit. This conclusion was driven by the presence of impairment indicators, including the sustained decline in Mobileye’s market capitalization since our annual assessment date in the fourth quarter of 2025, as well as increased uncertainty in the broader macroeconomic and geopolitical environment in which Mobileye operates.
Our quantitative assessment for the first quarter of 2026 was performed by measuring the Mobileye reporting unit's fair value using the income approach. When using the income approach, we tested the reasonableness of the inputs and outcomes of our discounted cash flow analysis against available market data. As part of this first quarter of 2026 quantitative assessment, we determined that a significant increase in the discount rate was required relative to the discount rate used in our quantitative assessment in the fourth quarter of 2025, which resulted from higher market‑based and Mobileye-specific risk premiums arising from changes in global macroeconomic conditions, including heightened geopolitical risks associated with operations in the Middle East, including the current conflict, and increased uncertainty related to Mobileye's evolving competitive landscape. Collectively, these factors increased market‑participant uncertainty regarding Mobileye's ability to execute and optimize revenue from its business pipeline and the long-term competitive positioning of certain Mobileye technologies, particularly with regard to increasingly advanced autonomous driving solutions. As a result, for the forecasted cash flows utilized in our first quarter of 2026 quantitative assessment, greater risk was attributed to the forecasted cash flows in later projection periods, which contributed to the higher discount rate applied in the income‑based valuation.
The increase in the discount rate utilized in our first quarter of 2026 quantitative assessment had a significant adverse effect on the estimated fair value of the Mobileye reporting unit and, as a result of our impairment test, we recognized a non-cash goodwill impairment charge in the first quarter of 2026 as the estimated fair value of the Mobileye reporting unit was lower than the assigned carrying value. To corroborate our estimated fair value of the Mobileye reporting unit, we performed a reconciliation to Mobileye's market capitalization as of March 28, 2026, and concluded that the implied control premium was reasonable as compared to relevant market transactions in similar industries. Should our estimates change based on Mobileye's operating results, market conditions, long-term growth projections, or other assumptions underlying our forecast, including changes in the discount rate, the Mobileye reporting unit may become subject to further impairment in future periods. For example, a 1% higher discount rate would have resulted in an additional goodwill impairment of approximately $682 million for the Mobileye reporting unit in the first quarter of 2026. As of June 27, 2026, our Mobileye reporting unit had $4.3 billion in recorded goodwill ($8.2 billion as of December 27, 2025).
In the first quarter of 2026, we settled $1.5 billion of our senior notes due February 2026 and amended our 364-day $5.0 billion credit facility agreement to a three-year $3.0 billion credit facility maturing January 2029. Neither of our revolving credit facilities had borrowings outstanding as of June 27, 2026 or December 27, 2025.
In the second quarter of 2026, we settled $1.0 billion of our senior notes due May 2026, and we issued a total of $6.5 billion aggregate principal amount of senior notes comprised of $1.0 billion in 4.65% senior notes due 2031, $1.0 billion in 5.00% senior notes due 2033, $2.2 billion in 5.30% senior notes due 2036, $1.8 billion in 6.13% senior notes due 2056, and $500 million in 6.20% senior notes due 2066. All of our senior fixed-rate notes pay interest semiannually. We may redeem the fixed-rate notes prior to their maturity at our option at specified redemption prices and subject to certain restrictions. The obligations under our senior fixed-rate notes rank equally in the right of payment with all of our other existing and future senior unsecured indebtedness and effectively rank junior to all liabilities of our subsidiaries.
On April 1, 2026, in connection with our repurchase of the 49% minority ownership interest in Ireland SCIP (refer to “Note 3: Non-Controlling Interests” within Notes to Consolidated Condensed Financial Statements), we executed and drew on a $6.5 billion 364-day senior unsecured term loan facility with an interest rate of 4.79%. On April 30, 2026, we repaid the term loan facility in full.
| | | | | | | | | | | |
| Financial Statements | Notes to Financial Statements | 19 |
Assets and Liabilities Measured and Recorded at Fair Value on a Recurring Basis
| | | | | | | | | | | | | | | | | | | | | | | | | | | | | | | | | | | | | | | | | | | | | | | | | | | | |
| | Jun 27, 2026 | | Dec 27, 2025 | | |
| | Fair Value Measured and Recorded at Reporting Date Using | | | | Fair Value Measured and Recorded at Reporting Date Using | | | | |
| (In Millions) | | Level 1 | | Level 2 | | Level 3 | | Total | | Level 1 | | Level 2 | | Level 3 | | Total | | |
| Assets | | | | | | | | | | | | | | | | | | |
| Cash equivalents: | | | | | | | | | | | | | | | | | | |
| Corporate debt | | $ | — | | | $ | 561 | | | $ | — | | | $ | 561 | | | $ | — | | | $ | 150 | | | $ | — | | | $ | 150 | | | |
| Financial institution instruments¹ | | 3,144 | | | 1,605 | | | — | | | 4,749 | | | 7,292 | | | 1,800 | | | — | | | 9,092 | | | |
| | | | | | | | | | | | | | | | | | |
| Reverse repurchase agreements | | — | | | 6,707 | | | — | | | 6,707 | | | — | | | 4,262 | | | — | | | 4,262 | | | |
| Short-term investments: | | | | | | | | | | | | | | | | | | |
| Corporate debt | | — | | | 8,092 | | | — | | | 8,092 | | | — | | | 7,248 | | | — | | | 7,248 | | | |
| Financial institution instruments¹ | | 96 | | | 5,049 | | | — | | | 5,145 | | | 183 | | | 3,991 | | | — | | | 4,174 | | | |
| Government debt² | | 1,456 | | | 2,160 | | | — | | | 3,616 | | | 5,296 | | | 6,433 | | | — | | | 11,729 | | | |
| Other current assets: | | | | | | | | | | | | | | | | | | |
| Derivative assets | | 135 | | | 477 | | | — | | | 612 | | | 431 | | | 608 | | | — | | | 1,039 | | | |
| | | | | | | | | | | | | | | | | | |
| Marketable equity investments | | 250 | | | — | | | — | | | 250 | | | 484 | | | — | | | — | | | 484 | | | |
| Other long-term assets: | | | | | | | | | | | | | | | | | | |
| Derivative assets | | — | | | 40 | | | — | | | 40 | | | — | | | 2 | | | — | | | 2 | | | |
| | | | | | | | | | | | | | | | | | |
| Total assets measured and recorded at fair value | | $ | 5,081 | | | $ | 24,691 | | | $ | — | | | $ | 29,772 | | | $ | 13,686 | | | $ | 24,494 | | | $ | — | | | $ | 38,180 | | | |
| Liabilities | | | | | | | | | | | | | | | | | | |
| Other accrued liabilities: | | | | | | | | | | | | | | | | | | |
| Derivative liabilities³ | | $ | 5 | | | $ | 9,156 | | | $ | 127 | | | $ | 9,288 | | | $ | 6 | | | $ | 1,524 | | | $ | 304 | | | $ | 1,834 | | | |
| | | | | | | | | | | | | | | | | | |
| Other long-term liabilities: | | | | | | | | | | | | | | | | | | |
| Derivative liabilities³ | | — | | | 6,932 | | | — | | | 6,932 | | | — | | | 1,714 | | | 576 | | | 2,290 | | | |
| Total liabilities measured and recorded at fair value | | $ | 5 | | | $ | 16,088 | | | $ | 127 | | | $ | 16,220 | | | $ | 6 | | | $ | 3,238 | | | $ | 880 | | | $ | 4,124 | | | |
1Level 1 investments consist of money market funds. Level 2 investments consist primarily of time deposits, notes, and bonds issued by financial institutions.
2Level 1 investments consist primarily of U.S. Treasury securities. Level 2 investments consist primarily of non-U.S. government debt.
3Level 1 derivative liabilities consist of equity contracts for our deferred compensation program. Level 2 derivative liabilities include a forward contract related to Escrowed Shares. Level 3 derivative liabilities include liquidated damage provisions related to our Ireland SCIP arrangement, which was terminated in the second quarter of 2026. The associated derivative liability was extinguished in the same period.
Assets Measured and Recorded at Fair Value on a Non-Recurring Basis
Our non-marketable equity investments and certain non-financial assets—such as intangible assets, goodwill, and property, plant, and equipment—are recorded at fair value only if an impairment or observable price adjustment is recognized in the current period. If an observable price adjustment or impairment is recognized on our non-marketable equity investments during the period, we classify these assets as Level 3. Similarly, impairments recognized on our goodwill, intangible assets, and property, plant, and equipment are categorized as Level 3 within the fair value hierarchy as we utilize unobservable inputs such as prospective financial information, market segment growth rates, and discount rates in the fair value measurement process. The fair value used to measure the non-cash goodwill impairment charge of $3.9 billion related to our Mobileye reporting unit in the first quarter of 2026 represents a Level 3 fair value measurement within the fair value hierarchy (see "Note 10: Goodwill" within Notes to Consolidated Condensed Financial Statements).
Financial Instruments Not Recorded at Fair Value on a Recurring Basis
Financial instruments not recorded at fair value on a recurring basis include non-marketable equity investments that have not been remeasured or impaired in the current period, issued debt, and our outstanding receivable from SLP of $473 million, which was measured and recorded using Level 2 inputs, as of June 27, 2026 ($463 million as of December 27, 2025).
We classify the fair value of issued debt (excluding any commercial paper) as Level 2. The fair value of these instruments was $46.0 billion as of June 27, 2026 ($41.8 billion as of December 27, 2025).
| | | | | | | | | | | |
| Financial Statements | Notes to Financial Statements | 20 |
| | | | | |
| Note 13 : | Derivative Financial Instruments |
Volume of Derivative Activity
Total gross notional amounts for outstanding derivatives (recorded at fair value) at the end of each period were as follows:
| | | | | | | | | | | | | | | | |
| (In Millions) | | Jun 27, 2026 | | Dec 27, 2025 | | |
| Foreign currency contracts | | $ | 18,583 | | | $ | 22,740 | | | |
| Interest rate contracts | | 22,920 | | | 21,796 | | | |
Equity contracts1 | | 2,544 | | | 2,689 | | | |
| Total | | $ | 44,047 | | | $ | 47,225 | | | |
1 Relates to our deferred compensation program.
The total notional amount of outstanding pay-variable, receive-fixed interest rate contracts designated as fair value hedges was $14.7 billion as of June 27, 2026 and $9.7 billion as of December 27, 2025.
Fair Value of Derivative Instruments in the Consolidated Condensed Balance Sheets
| | | | | | | | | | | | | | | | | | | | | | | | | | |
| | | Jun 27, 2026 | | Dec 27, 2025 |
| (In Millions) | | Assets1 | | Liabilities2 | | Assets1 | | Liabilities2 |
| Derivatives designated as hedging instruments: | | | | | | | | |
| Foreign currency contracts | | $ | 117 | | | $ | 128 | | | $ | 173 | | | $ | 49 | |
| Interest rate contracts | | 39 | | | 321 | | | — | | | 266 | |
| Total derivatives designated as hedging instruments | | 156 | | | 449 | | | 173 | | | 315 | |
| Derivatives not designated as hedging instruments: | | | | | | | | |
| Foreign currency contracts | | 248 | | | 168 | | | 351 | | | 278 | |
| Interest rate contracts | | 113 | | | 28 | | | 86 | | | 116 | |
Equity contracts3 | | 135 | | | 5 | | | 431 | | | 6 | |
| Escrowed Shares | | — | | | 15,570 | | | — | | | 2,654 | |
Ireland SCIP arrangement | | — | | | — | | | — | | | 755 | |
| Total derivatives not designated as hedging instruments | | 496 | | | 15,771 | | | 868 | | | 3,809 | |
| Total derivatives | | 652 | | | 16,220 | | | 1,041 | | | 4,124 | |
| Netted cash and non-cash collateral received or pledged | | (588) | | | (628) | | | (907) | | | (571) | |
| Net derivatives | | $ | 64 | | | $ | 15,592 | | | $ | 134 | | | $ | 3,553 | |
1Derivative assets are recorded as other assets, current and long-term.
2Derivative liabilities are recorded as other liabilities, current and long-term.
3Relates to our deferred compensation program.
Gross derivative assets and liabilities subject to master netting agreements were $588 million and $628 million, respectively, as of June 27, 2026 and $937 million and $654 million, respectively, as of December 27, 2025. Gross amounts recognized for reverse repurchase agreements are fully offset by cash collateral pledged.
Derivatives in Cash Flow Hedging Relationships
The before-tax net gains or losses attributed to the effective portion of cash flow hedges recognized in other comprehensive income (loss) were $3 million net gains in the second quarter of 2026 and $67 million net losses in the first six months of 2026 ($533 million net gains in the second quarter of 2025 and $713 million net gains in the first six months of 2025).
| | | | | | | | | | | |
| Financial Statements | Notes to Financial Statements | 21 |
Derivatives in Fair Value Hedging Relationships
The effects of derivative instruments designated as fair value hedges, recognized in interest and other, net for each period were as follows:
| | | | | | | | | | | | | | | | | | | | | | | | | | |
| | Gains (Losses) on Derivatives Recognized in Consolidated Condensed Statements of Operations |
| | Three Months Ended | | Six Months Ended |
| (In Millions) | | Jun 27, 2026 | | Jun 28, 2025 | | Jun 27, 2026 | | Jun 28, 2025 |
| Interest rate contracts | | $ | 43 | | | $ | 106 | | | $ | (16) | | | $ | 247 | |
| Hedged items | | (43) | | | (106) | | | 16 | | | (247) | |
| Total | | $ | — | | | $ | — | | | $ | — | | | $ | — | |
The amounts recorded on the Consolidated Condensed Balance Sheets related to cumulative basis adjustments for fair value hedges for each period were as follows:
| | | | | | | | | | | | | | | | | | | | | | | | | | | |
| Line Item in the Consolidated Condensed Balance Sheets in Which the Hedged Item is Included | | Carrying Amount of the Hedged Item Assets/(Liabilities) | | Cumulative Amount of Fair Value Hedging Adjustment Included in the Carrying Amount Assets/(Liabilities) |
| (In Millions) | | Jun 27, 2026 | | Dec 27, 2025 | | Jun 27, 2026 | | Dec 27, 2025 | |
| Short-term debt | | $ | (982) | | | $ | (993) | | | $ | 18 | | | $ | 7 | | |
| Long-term debt | | (13,483) | | | (8,488) | | | 264 | | | 259 | | |
| Total | | $ | (14,465) | | | $ | (9,481) | | | $ | 282 | | | $ | 266 | | |
Derivatives Not Designated as Hedging Instruments
The effects of derivative instruments not designated as hedging instruments on the Consolidated Condensed Statements of Operations for each period were as follows:
| | | | | | | | | | | | | | | | | | | | | | | | | | | | | | | | |
| | | | | Three Months Ended | | Six Months Ended |
| (In Millions) | | Location of Gains (Losses)
Recognized in Income on Derivatives | | Jun 27, 2026 | | Jun 28, 2025 | | Jun 27, 2026 | | Jun 28, 2025 |
| Foreign currency contracts | | Interest and other, net | | $ | 139 | | | $ | (19) | | | $ | 314 | | | $ | (104) | |
| Interest rate contracts | | Interest and other, net | | 28 | | | (28) | | | 136 | | | (85) | |
| Escrowed Shares | | Interest and other, net | | (12,529) | | | — | | | (13,619) | | | — | |
| Other | | Various | | 261 | | | 199 | | | 296 | | | 42 | |
| Total | | | | $ | (12,101) | | | $ | 152 | | | $ | (12,873) | | | $ | (147) | |
Legal Proceedings
We are regularly party to various ongoing claims, litigation, and other proceedings, including those noted in this section. As of June 27, 2026, we have accrued liabilities of $1.0 billion related to litigation involving VLSI and $308 million, including revaluation effects and accrued interest, related to an EC-imposed fine, both as described below. Excluding the VLSI claims described below, management at present believes that the ultimate outcome of these proceedings, individually and in the aggregate, will not materially harm our financial position, results of operations, cash flows, or overall trends; however, legal proceedings and related government investigations are subject to inherent uncertainties, and unfavorable rulings, excessive verdicts, or other events could occur. Unfavorable resolutions could include substantial monetary damages, fines, or penalties. Certain of these outstanding matters include speculative, substantial, or indeterminate monetary awards. In addition, in matters for which injunctive relief or other conduct remedies are sought, unfavorable resolutions could include an injunction or other order prohibiting us from selling one or more products at all or in particular ways, precluding particular business practices, or requiring other remedies. An unfavorable outcome may result in a material adverse impact on our business, results of operations, financial position, and overall trends. We might also conclude that settling one or more such matters is in the best interests of our stockholders, employees, and customers, and any such settlement could include substantial payments. Unless specifically described below, we have not concluded that settlement of any of the legal proceedings noted in this section is appropriate at this time.
| | | | | | | | | | | |
| Financial Statements | Notes to Financial Statements | 22 |
European Commission Competition Matter
In 2009, the EC found that we had used unfair business practices to persuade customers to buy microprocessors in violation of Article 82 of the EC Treaty (later renumbered Article 102) and Article 54 of the European Economic Area Agreement. In general, the EC found that we violated Article 82 by offering alleged “conditional rebates and payments” that required customers to purchase all or most of their x86 microprocessors from us and by making alleged “payments to prevent sales of specific rival products.” The EC ordered us to end the alleged infringement referred to in its decision and imposed a €1.1 billion fine, which we paid in the third quarter of 2009.
We appealed the EC decision to the European Court of Justice in 2014, after the General Court (then called the Court of First Instance) rejected our appeal of the EC decision in its entirety. In September 2017, the Court of Justice sent the case back to the General Court to examine whether the rebates at issue were capable of restricting competition. In January 2022, the General Court annulled the EC's 2009 findings against us regarding rebates, as well as the €1.1 billion fine imposed on Intel, which was returned to us in February 2022. The General Court's January 2022 decision did not annul the EC's 2009 finding that we made payments to prevent sales of specific rival products.
In April 2022, the EC appealed the General Court's findings regarding rebates to the Court of Justice. In October 2024, the Court of Justice dismissed the EC's appeal, upholding the judgment of the General Court.
In September 2023, the EC imposed a €376 million ($401 million) fine against us based on its 2009 finding that we made payments to prevent sales of specific rival products. We appealed the EC's decision, and in December 2025 the General Court reduced the fine to €237 million ($277 million). In February 2026, we appealed the General Court’s decision to the Court of Justice. We have accrued a charge of $308 million as of June 27, 2026, which includes foreign currency revaluation effects and accrued interest, and are unable to make a reasonable estimate of the potential loss or range of losses in excess of this amount given the procedural posture and the nature of these proceedings.
Litigation Related to Security Vulnerabilities
In June 2017, a Google research team notified Intel and other companies that it had identified security vulnerabilities, the first variants of which are now commonly referred to as “Spectre” and “Meltdown,” that affect many types of microprocessors, including our products. As is standard when findings like these are presented, we worked together with other companies in the industry to verify the research and develop and validate software and firmware updates for impacted technologies. In January 2018, information on the security vulnerabilities was publicly reported, before software and firmware updates to address the vulnerabilities were made widely available.
Consumer class action lawsuits are pending against us in the U.S. and Canada. The plaintiffs, who purport to represent various classes of purchasers of our products, generally claim to have been harmed by our actions and/or omissions in connection with Spectre, Meltdown, and other variants of this class of security vulnerabilities that have been identified since 2018, and assert a variety of common law and statutory claims seeking monetary damages and equitable relief. In the U.S., class action suits filed in various jurisdictions between 2018 and 2021 were consolidated for all pretrial proceedings in the U.S. District Court for the District of Oregon, which entered final judgment in favor of Intel in July 2022 based on plaintiffs' failure to plead a viable claim. The Ninth Circuit Court of Appeals affirmed the district court's judgment in November 2023, ending the litigation. In November 2023, new plaintiffs filed a consumer class action complaint in the U.S. District Court for the Northern District of California with respect to a further vulnerability variant disclosed in August 2023 and commonly referred to as “Downfall.” In August 2024, the district court dismissed plaintiffs' entire complaint for failure to plead a viable claim, with leave to amend. In August 2025, the district court dismissed with prejudice the nationwide class claims under California law in plaintiffs' amended complaint, and denied Intel's motion to dismiss subclass claims pleaded in the alternative under the laws of certain other states. In October 2025, the plaintiffs filed a second amended complaint, which Intel moved to dismiss in December 2025. In Canada, an initial status conference has not yet been scheduled in one case relating to Spectre and Meltdown pending in the Superior Court of Justice of Ontario, and a stay of a second case pending in the Superior Court of Justice of Quebec is in effect. Additional lawsuits and claims may be asserted seeking monetary damages or other related relief. Given the procedural posture and the nature of these cases, including that the pending proceedings are in the early stages, that alleged damages have not been specified, that uncertainty exists as to the likelihood of a class or classes being certified or the ultimate size of any class or classes if certified, and that there are significant factual and legal issues to be resolved, we are unable to make a reasonable estimate of the potential loss or range of losses, if any, that might arise from these matters.
Securities Class Action and Derivative Lawsuits
Litigation Related to Segment Reporting and Internal Foundry Model
A securities class action lawsuit was filed in the U.S. District Court for the Northern District of California in May 2024 against us and certain officers following the modification of our segment reporting in the first quarter of 2024 to align to our new internal foundry operating model. In August 2024, the court ordered the case consolidated with a second, similar lawsuit, and in October 2024 plaintiffs filed an amended consolidated complaint generally alleging that defendants violated the federal securities laws by making false or misleading statements about the growth and prospects of the foundry business and seeking monetary damages on behalf of all persons and entities that purchased or otherwise acquired our common stock or purchased call options or sold put options on our common stock from January 25, 2024 through August 1, 2024. In March 2025, the court dismissed plaintiffs' amended consolidated complaint, finding that plaintiffs failed to plead any false or misleading statements by defendants. The court granted plaintiffs leave to amend, but in July 2025 dismissed plaintiffs' second amended complaint and entered judgment in defendants' favor, again finding that plaintiffs failed to plead any false or misleading statements. Plaintiffs have appealed. Given the procedural posture of the case, including that the plaintiffs have appealed the district court's decision, we are unable to make a reasonable estimate of the potential loss or range of losses, if any, that might arise from the matter.
| | | | | | | | | | | |
| Financial Statements | Notes to Financial Statements | 23 |
Stockholder derivative lawsuits have been filed in Delaware state and federal courts alleging that our directors and certain officers breached their fiduciary duties and violated the federal securities laws by making or allowing the statements that are challenged in the securities class action lawsuit. The plaintiffs in the derivative lawsuits seek to recover damages from the defendants on behalf of Intel. The cases are stayed pending developments in the securities class action lawsuit.
Litigation Related to Warrant and Common Stock Agreement between Intel and the U.S. Department of Commerce
A stockholder filed a derivative lawsuit in the Delaware Court of Chancery in March 2026 against our directors, the Department of Commerce and Secretary of the U.S. Department of Commerce, Howard W. Lutnick, claiming our directors breached their fiduciary duties and engaged in waste by approving the Warrant and Common Stock Agreement, dated as of August 22, 2025, between us and the U.S. Department of Commerce, and that the agreement was unlawful. Plaintiff seeks invalidation of the agreement, as well as damages on our behalf. In April 2026, the U.S. Department of Commerce removed the case to the U.S. District Court for the District of Delaware. In May 2026, defendants filed motions to dismiss.
Litigation Related to Patent and IP Claims
We have had IP infringement lawsuits filed against us, including but not limited to those discussed below. Most involve claims that certain of our products, services, and technologies infringe others' IP rights. Adverse results in these lawsuits may include awards of substantial fines and penalties, costly royalty or licensing agreements, or orders preventing us from offering certain features, functionalities, products, or services. As a result, we may have to change our business practices, and develop non-infringing products or technologies, which could result in a loss of revenue for us and otherwise harm our business. In addition, certain agreements with our customers require us to indemnify them against certain IP infringement claims, which can increase our costs as a result of defending such claims, and may require that we pay significant damages, accept product returns, or supply our customers with non-infringing products if there were an adverse ruling in any such claims. In addition, our customers and partners may discontinue the use of our products, services, and technologies, as a result of injunctions or otherwise, which could result in loss of revenue and adversely affect our business.
VLSI Technology LLC v. Intel
In October 2017, VLSI Technology LLC (VLSI) filed a complaint against us in the U.S. District Court for the Northern District of California alleging that various Intel FPGA and processor products infringe eight patents VLSI acquired from NXP Semiconductors, N.V. (NXP). VLSI sought damages, attorneys' fees, costs, and interest. Intel prevailed on all eight patents and the court entered final judgment in April 2024. VLSI appealed the Court's judgment of non-infringement as to one of the eight patents. In April 2026, the Federal Circuit reversed and remanded the case back to the district court. VLSI filed three infringement suits against us in the U.S. District Court for the Western District of Texas accusing various of our processors of infringement of eight additional patents it had acquired from NXP:
▪The first Texas case went to trial in February 2021, and the jury awarded VLSI $1.5 billion for literal infringement of one patent and $675 million for infringement of another patent under the doctrine of equivalents. In April 2022, the court entered final judgment, awarding VLSI $2.2 billion in damages and approximately $162 million in pre-judgment and post-judgment interest. We appealed the judgment to the Federal Circuit Court of Appeals, including the court's rejection of Intel's claim to have a license from Fortress Investment Group's acquisition of Finjan. The Federal Circuit Court heard oral argument in October 2023. In December 2023, the Federal Circuit reversed the finding of infringement as to the patent for which VLSI was awarded $675 million. The Federal Circuit affirmed the finding of infringement as to the patent for which VLSI had been awarded $1.5 billion, but vacated the damages award and sent the case back to the trial court for further damages proceedings on that patent. The Federal Circuit also ruled that Intel can advance the defense that it is licensed to VLSI's patents. In December 2021 and January 2022 the Patent Trial and Appeal Board (PTAB) instituted Inter Partes Reviews (IPR) on the claims found to have been infringed in the first Texas case, and in May and June 2023 found all of those claims unpatentable; VLSI has appealed the PTAB's decisions. In April 2024, Intel moved to add the defense that it is licensed to VLSI's patents. The motion remains pending.
▪The second Texas case went to trial in April 2021, and the jury found that we do not infringe the asserted patents. VLSI had sought approximately $3.0 billion for alleged infringement, plus enhanced damages for willful infringement. In September 2024, the court denied VLSI's motion for a new trial. Other post-trial motions remain pending, and the court has not yet entered final judgment.
▪The third Texas case went to trial in November 2022, with VLSI asserting one remaining patent. The jury found the patent valid and infringed, and awarded VLSI approximately $949 million in damages, plus interest and a running royalty. The court has not yet entered final judgment. In February 2023, we filed motions for a new trial and for judgment as a matter of law notwithstanding the verdict on various grounds. Further appeals are possible. In April 2024, Intel moved to add the defense that it is licensed to VLSI's patents, and the court granted Intel's motion that same month. In May 2025, the court held a trial on an underlying factual question relating to Intel’s license defense. The jury returned a verdict in Intel's favor. Post-trial briefing is complete, and the court will address the ultimate legal issue of whether Intel obtained a license to the asserted VLSI patent through Intel’s license agreement with Finjan when Fortress Investments acquired Finjan.
In May 2019, VLSI filed a case in Shenzhen Intermediate People's Court against Intel, Intel (China) Co., Ltd., Intel Trading (Shanghai) Co., Ltd., and Intel Products (Chengdu) Co., Ltd. VLSI asserted one patent against certain Intel Core processors. Defendants filed an invalidation petition in October 2019 with the China National Intellectual Property Administration (CNIPA) which held a hearing in September 2021. The Shenzhen court held trial proceedings in July 2021 and September 2023. VLSI sought an injunction as well as RMB 1.3 million in costs and expenses, but no damages. In September 2023, the CNIPA invalidated every claim of the asserted patent. In November 2023, the trial court dismissed VLSI's case.
| | | | | | | | | | | |
| Financial Statements | Notes to Financial Statements | 24 |
In May 2019, VLSI filed a case in Shanghai Intellectual Property Court against Intel (China) Co., Ltd., Intel Trading (Shanghai) Co., Ltd., and Intel Products (Chengdu) Co., Ltd. asserting one patent against certain Intel Core processors. The Shanghai court held trial hearings in December 2020 and in May 2022, where VLSI requested expenses (RMB 300 thousand) and an injunction. In October 2023, the Shanghai court issued a decision finding no infringement and dismissing all claims. In November 2023, VLSI appealed the finding of non-infringement to the Supreme People's Court. The Supreme People's Court held an evidentiary hearing in October 2024, and a trial in November 2024.
In parallel in December 2022, we had filed a petition to invalidate the patent at issue in the Shanghai proceeding. In February 2024, the patent was found not invalid, and Intel appealed the decision in May 2024. After the Beijing Intellectual Property Court upheld the validity of the patent in May 2025, we filed a further appeal to the Supreme People’s Court in June 2025. Both VLSI’s appeal of the noninfringement decision and our appeal of the validity decision before the Supreme People’s Court remain pending.
In July 2024, Intel filed suit against VLSI in U.S. District Court for the District of Delaware requesting the court find Intel is licensed to VLSI's patents. In September 2024, VLSI filed motions requesting that Intel's complaint be dismissed, transferred, or stayed. In December 2024, the Delaware court stayed the case and deferred the pending motions until May 31, 2025. The Delaware court has not taken further action and continues to receive status reports from the parties regarding the Texas court's consideration of Intel's license defense.
As of June 27, 2026, we have accrued a charge of approximately $1.0 billion related to the VLSI litigation. We are unable to make a reasonable estimate of losses in excess of recorded amounts.
EireOg Innovations v IBM et al
Since April 2024, EireOg Innovations Ltd. has filed eleven separate complaints in the Eastern and Western Districts of Texas against Intel customers alleging that various products with Intel CPUs infringe numerous patents. EireOg seeks compensatory damages, future royalties, attorneys’ fees, costs, and interest. Intel is indemnifying Amazon Web Services (AWS), Cisco, Dell, HPE, IBM, Lenovo, and Oracle in connection with Intel CPUs accused of infringing three patents. Across the cases, EireOg alleges past and future damages in excess of $2.0 billion. The EireOg case against Cisco went to trial in April 2026. The jury returned a verdict finding no infringement by Cisco and finding the factual predicate for concluding that Intel is licensed to the asserted patent. The courts then stayed the remaining cases pending resolution of post-trial proceedings and any appeal in the Cisco case. Given the procedural posture and the nature of these cases, including that some pending proceedings are in the early stages, that alleged damages have not been specified in all cases, and that there are significant factual and legal issues to be resolved, we are unable to make a reasonable estimate of the potential loss or range of losses, if any, that might arise from these matters.
Media Content Protection v Intel
In September 2020, Koninklijke Philips N.V. and Philips North America LLC (collectively, Philips) filed against Intel and customers in the U.S. District Court for the District of Delaware and the International Trade Commission (ITC). Philips alleged that certain Intel digital video-capable integrated circuits and associated firmware infringed two of its patents, including integrated circuits and associated firmware incorporated into products sold by Dell Technologies, Inc., HP Inc., Lenovo Group Ltd., and LG Electronics Inc. In March 2022, the ITC issued a final determination concluding that Philips had not proven a violation. Philips did not appeal the ITC’s decision, and a stay of the Delaware cases was lifted. Philips then sold the asserted patents to Media Content Protection (MCP) in July 2024, and MCP substituted in as the plaintiff. Trial was set for January 2026. MCP sought $66 million to $398 million in damages for royalties between the 2020 case filing and the 2023 patent expiration date. In November 2025, the court granted Intel’s motion for summary judgment of invalidity of both patents and issued a final judgment in favor of Intel in December 2025. MCP has appealed. Given the procedural posture and the nature of this case, including that there are significant factual and legal issues to be resolved, we are unable to make a reasonable estimate of the potential loss or range of losses, if any, that might arise from this matter.
| | | | | | | | | | | |
| Financial Statements | Notes to Financial Statements | 25 |
We use terms throughout our document that are specific to Intel or that are abbreviations that may not be commonly known or used. Below is a list of these terms used in our document. | | | | | | | | |
| Term | | Definition |
| | |
| | |
| | |
| | |
| | |
| | |
| | |
| | |
| | |
| | |
| 2024 Restructuring Plan | | Cost and capital reduction initiatives approved by management, the board of directors or the Audit & Finance Committee of the board of directors designed to adjust spending to current business trends and achieve objectives announced in Q3 2024 with respect to reducing operating expenses, reducing capital expenditures and reducing cost of sales while enabling Intel's new operating model and continuing to fund investments in Intel's core strategy |
| | |
| | |
| | |
| | |
| 2025 Form 10-K | | Annual Report on Form 10-K for the year ended December 27, 2025 |
| 2025 Restructuring Plan | | Transformational initiative announced and subsequently approved in Q2 2025 by our management to lower expenses, streamline our organizational structure and reduce management layers across functions while reallocating resources toward our core client and server businesses by reducing investment in lower-priority programs and initiatives |
| AI | | Artificial intelligence |
| | |
| | |
| | |
| Altera | | Altera Corporation, a business offering programmable semiconductors, primarily FPGAs, and related products for a broad range of applications |
| | |
| AMIC | | Advanced Manufacturing Investment Credit |
| Apollo | | Apollo Global Management, Inc. |
| ASIC | | Application-specific integrated circuit |
| ASP | | Average selling price |
| | |
| | |
| | |
| | |
| | |
| | |
| Brookfield | | Brookfield Asset Management |
| CCPG | | Client Computing and Physical AI Group operating segment, formerly the Client Computing Group (CCG) |
| | |
| CEO | | Chief executive officer |
| | |
| CHIPS Act | | Creating Helpful Incentives to Produce Semiconductors for America Act |
| CODM | | Chief operating decision maker |
| | |
| | |
| CPU | | Processor or central processing unit |
| | |
| | |
| | |
| | |
| DCAI | | Data Center and Artificial Intelligence operating segment |
| DOC | | U.S. Department of Commerce |
| EC | | European Commission |
| | |
| | |
| | |
| | |
| EPS | | Earnings per share |
| | |
| | |
| Escrowed Shares | | Shares of Intel common stock held in escrow to be released to the U.S. Department of Commerce (DOC) as we perform and receive cash proceeds in connection with our CHIPS Act Secure Enclave agreement with the U.S. Government. If Escrowed Shares are not released from escrow at the end of the performance period, half of the shares will be released to the DOC with no consideration and the other half will be forfeited and cancelled |
| Exchange Act | | Securities Exchange Act of 1934 |
| Fab | | Semiconductor manufacturing / wafer-fabrication facility |
| | |
| | |
| FPGA | | Field-programmable gate array |
| | |
| | |
FSB | | Federal Security Service of the Russian Federation |
| HPC | | High-performance computing |
| | |
| | |
| | |
| | |
| | |
| | |
| | |
| | |
| | |
| | |
| | |
| | |
| IMS | | IMS Nanofabrication GmbH, a business within Intel Foundry that develops and produces electron-beam systems for the semiconductor industry |
| Intel | | Intel Corporation |
| IP | | Intellectual property |
| | |
| | |
| | |
| | |
| | |
| | |
| | |
| | |
| | |
| | |
| | |
| | |
| | |
| | |
| IPU | | Infrastructure processing unit, a programmable networking device designed to enable cloud and communication service providers to reduce overhead and free up performance for CPUs |
| IT | | Information Technology |
| MD&A | | Management's Discussion and Analysis |
| | |
| Mentee Robotics | | Mentee Robotics Ltd. |
| MG&A | | Marketing, general, and administrative |
| | |
| | |
| | |
| Mobileye | | Mobileye Global Inc. |
| NAND | | NAND flash memory |
| | |
| | |
| | | | | | | | | | | |
| Financial Statements | Notes to Financial Statements | 26 |
| | | | | | | | |
| NIC | | Network interface controller |
| | |
| | |
| | |
| | |
| | |
| | |
| | |
| | |
| | |
| | |
| | |
| | |
| | |
| | |
| | |
| | |
| | |
| | |
| | |
| | |
| | |
| | |
| | |
| | |
| | |
| | |
| | |
| | |
OFAC | | Office of Foreign Assets Control |
| PC | | Personal computer |
| | |
| | |
| | |
| Q1 2026 Form 10-Q | | Quarterly Report on Form 10-Q for the quarter ended March 28, 2026 |
| R&D | | Research and development |
| | |
| | |
| | |
| RSU | | Restricted stock unit |
| | |
| | |
| | |
| | |
| SCIP | | Semiconductor Co-Investment Program |
| | |
| SEC | | U.S. Securities and Exchange Commission |
| | |
| Secure Enclave | | Secure Enclave program under the CHIPS Act |
| Semiconductor Process Technology | | Processes and technologies applied in the production of semiconductor logic chips |
| SK hynix | | SK hynix Inc. |
SLP | | Silver Lake Partners |
| SoC | | System on a chip, which integrates most of the components of a computer or other electronic system into a single silicon chip. We offer a range of SoC products across many market segments for a variety of applications |
| | |
| | |
| | |
| | |
| | |
| | |
| | |
| | |
| | |
| | |
| | |
| | |
| | |
| | |
| | |
| U.S. | | United States |
| U.S. GAAP | | U.S. Generally Accepted Accounting Principles |
| VIE | | Variable interest entity |
| | |
| | |
| | |
| | |
| | |
| | |
| | |
| | | | | | | | | | | |
| Financial Statements | Notes to Financial Statements | 27 |
| | | | | |
| Management's Discussion and Analysis | |
| |
OverviewThis report should be read in conjunction with our 2025 Form 10-K where we include additional information on our business, operating segments, risk factors, critical accounting estimates, policies, methods and assumptions used in our estimates, among other important information.
Significant Events and Trends Impacting Results
The following discussion highlights significant events, key developments and trends that we believe meaningfully impacted our consolidated financial results and financial position during Q2 2026 or that we believe may continue to influence our future operating results and financial position, as well as specific matters that occurred in 2025 that impact the comparability of our results.
Escrowed Shares Issued to the U.S. Government
In Q2 2026, in connection with our agreements with the U.S. government and shares of our common stock held in escrow for the benefit of the U.S. government under such agreements, we recognized a $12.5 billion loss related to the net change in the fair value of shares of our common stock released from escrow during the quarter and remaining in escrow at the end of Q2 2026, driven by an increase in our stock price. The fair value of the related derivative liability was $15.6 billion at the end of Q2 2026, which we recognized within other accrued liabilities and other long-term liabilities (refer to "Note 4: Earnings (Loss) Per Share and Stockholders' Equity" within Notes to Consolidated Condensed Financial Statements for further information).
Repurchase of Non-Controlling Interests in Ireland SCIP
In Q2 2026, we acquired from Apollo its 49% minority ownership interest in our majority-owned and consolidated Ireland SCIP VIE for aggregate cash consideration of $14.2 billion, inclusive of transaction costs. We funded the repurchase of Apollo's non-controlling equity interest through a combination of existing cash and cash equivalents, short-term investments and a $6.5 billion term loan facility that we entered into in Q2 2026 and subsequently repaid in Q2 2026 using proceeds from the issuance of $6.5 billion aggregate principal amount of senior fixed-rate notes (refer to "Note 3: Non-Controlling Interests" and “Note 11: Borrowings” within Notes to Consolidated Condensed Financial Statements).
Ireland SCIP was established in 2024 in connection with the construction and operation of Fab 34, with Apollo acquiring a 49% minority ownership interest and the parties entering into related operating and ancillary agreements governing the construction, operation and utilization of the fab. Our Consolidated Condensed Financial Statements for Q2 2026 reflect our 100% ownership of Ireland SCIP, the substantial termination of the related operating and ancillary agreements between the parties, the elimination of $142 million of non‑controlling interest in Ireland SCIP and the extinguishment of the $532 million derivative liability associated with delay‑related liquidated damages provisions. The residual consideration of $13.5 billion was recognized as a reduction to our capital in excess of par value (refer to “Note 3: Non-Controlling Interests” within Notes to Consolidated Condensed Financial Statements).
Future Node Development and Manufacturing Expansion Projects
At the start of 2026, we released our first products manufactured on Intel 18A, our most advanced leading-edge semiconductor manufacturing technology, or node, in high volume production. We continue to develop its derivative node, Intel 18A-P, designed for future Intel products and external Intel Foundry customers, and entered into risk production of products on such node in June 2026. We are focused and have made substantial progress in recent periods on the continued development of Intel 14A, the next generation node beyond Intel 18A and Intel 18A-P. During Q2 2026, we committed to completing development of Intel 14A, with a number of future Intel products designed to utilize the node and manufacturing expansion projects underway for production of products on the node. We also made continued progress towards meeting performance and design milestones for potential significant customers to evaluate Intel 14A for their future products. We intend to accelerate various of our manufacturing expansion projects, though the scale and pace of our manufacturing expansion projects will ultimately be dictated by the amount of committed demand for Intel 14A that we are able to obtain from our Intel products roadmap and design wins with potential significant external customers.
The design, development and manufacturing of leading-edge nodes is risky and capital-intensive, and it takes years for capital investments to yield a return. We remain committed to maintaining a disciplined approach of investing capital in future node development and new or upgraded manufacturing facilities only where we have a clear line of sight to an acceptable return on that capital.
Risks from the Conflict with Iran
On February 28, 2026, the U.S. and Israel initiated coordinated military strikes against Iran, which were followed by retaliatory actions by Iran and Iran‑aligned groups, including missile and drone attacks directed at Israel and other countries in the region. Since that time, the conflict has remained volatile, with periods of military escalation, retaliatory actions and diplomatic efforts to reduce hostilities. Military actions by the U.S., Israel, Iran and Iran-aligned groups have impacted military, civilian and industrial targets throughout the region, including in Israel, Iran, Lebanon, Kuwait, Saudi Arabia, Yemen, Bahrain, Qatar, the United Arab Emirates, Oman, Iraq, Jordan, Syria, Cyprus and Azerbaijan. Among other things, the conflict has disrupted various global supply chains and shipping routes and resulted in increased global energy prices and energy shortages that may adversely impact the world economy. In addition, Iranian strikes on two energy fields in Qatar that supply a meaningful percentage of the global supply of helium have resulted in a global shortage of this gas that is essential to the semiconductor manufacturing process.
In late March 2026, Iran published a list of U.S. companies with operations in the Middle East whose facilities they indicated they would target in retaliation for continued strikes on Iran, with Intel being near the top of that list. A significant portion of our current and anticipated future revenues are generated from products on Intel 7 manufactured at our fabrication facility in Israel. As we are not insured for business interruptions resulting from war or political violence, a disruption of that facility could have a significant adverse impact on our business. We could also be adversely impacted by disruptions to our product development centers in Israel. As our property, plant and equipment assets in Israel are self‑insured for losses resulting from war or political violence, any significant impact from the conflict, especially to our fabrication facility, could have a material adverse effect on our consolidated financial results and position.
We continue to monitor the potential impact this conflict could have on our operations in Israel, on our global operations and business and on the semiconductor industry and global economy more broadly.
Altera Divestiture
The comparability of our Consolidated Condensed Financial Statements for Q2 2026 and YTD 2026 relative to Q2 2025 and YTD 2025, as discussed within this MD&A, was impacted by the deconsolidation of Altera. Altera, a business offering programmable semiconductors, primarily FPGAs, and related products for a broad range of applications that was previously a wholly owned subsidiary, was deconsolidated from our Consolidated Condensed Financial Statements effective September 12, 2025, following the closing of the sale of 51% of Altera's issued and outstanding common stock. Altera's financial results of operations were included in our Consolidated Condensed Financial Statements through September 11, 2025. Revenue from Altera as a customer was $181 million in Q2 2026 and $320 million in YTD 2026, compared to $428 million and $779 million of revenue, respectively, contributed by Altera in our consolidated financial results in Q2 2025 and YTD 2025. Refer to "Note 8: Investments" and "Note 9: Acquisitions and Divestitures" within Notes to Consolidated Condensed Financial Statements for additional information.
| | | | | |
| Operating Segments Trends and Results | |
| |
Intel ProductsIntel Products consists substantially of the design, development, marketing, sale, support and servicing of CPUs and related semiconductor products for third-party customers. Intel Products is comprised of two operating segments: our Client Computing and Physical AI Group, or CCPG, and our Data Center and Artificial Intelligence, or DCAI. CCPG (formerly our Client Computing Group, or CCG) delivers platforms and processors that power PCs and edge devices, enabling enhanced performance, connectivity and user experiences for consumer and commercial markets, with capabilities that also support retail, industrial robotics and AI ecosystems at the edge. DCAI delivers workload-optimized solutions based upon our x86 architecture for data centers, including CPUs, AI accelerators, NICs, IPUs and purpose-built silicon, or ASICs, enabling performance and scalability for cloud, enterprise, telecommunication and HPC environments. The manufacturing of our Intel Products offerings is performed by Intel Foundry and, to a lesser extent, by certain third-party manufacturers.
Intel Products Financial Performance1
| | | | | | | | | | | | | | | | | | | | | | | | | | | | | | | | | | | | | | |
| | Three Months Ended | | Six Months Ended |
| | Jun 27, 2026 | | Jun 27, 2026 |
| ($ In Millions) | | CCPG | | DCAI | | Total | | CCPG | | DCAI | | Total |
| Revenue | | $ | 8,877 | | | $ | 6,262 | | | $ | 15,139 | | | $ | 16,604 | | | $ | 11,314 | | | $ | 27,918 | |
| Cost of sales and operating expenses | | 6,534 | | | 3,788 | | | 10,322 | | | 11,745 | | | 7,298 | | | 19,043 | |
| Operating income | | $ | 2,343 | | | $ | 2,474 | | | $ | 4,817 | | | $ | 4,859 | | | $ | 4,016 | | | $ | 8,875 | |
| | | | | | | | | | | | |
| Operating margin % | | 26% | | 40% | | 32% | | 29% | | 35% | | 32% |
| | | | | | | | | | | | |
| | | | | | | | | | | | | | | | | | | | | | | | | | | | | | | | | | | | | | |
| | Three Months Ended | | Six Months Ended |
| | Jun 28, 2025 | | Jun 28, 2025 |
| ($ In Millions) | | CCPG | | DCAI | | Total | | CCPG | | DCAI | | Total |
| Revenue | | $ | 7,871 | | | $ | 3,939 | | | $ | 11,810 | | | $ | 15,500 | | | $ | 8,065 | | | $ | 23,565 | |
| Cost of sales and operating expenses | | 5,818 | | | 3,306 | | | 9,124 | | | 11,086 | | | 6,857 | | | 17,943 | |
| Operating income | | $ | 2,053 | | | $ | 633 | | | $ | 2,686 | | | $ | 4,414 | | | $ | 1,208 | | | $ | 5,622 | |
| | | | | | | | | | | | |
| Operating margin % | | 26% | | 16% | | 23% | | 28% | | 15% | | 24% |
1 Operating segment results include intersegment financial activity; refer to "Note 2: Operating Segments" within Notes to Consolidated Condensed Financial Statements for a reconciliation between our operating segment and consolidated financial results for the periods presented.
Operating Segment Revenue Summary
Q2 2026 vs. Q2 2025 and YTD 2026 vs. YTD 2025
Total Intel Products revenue was $15.1 billion in Q2 2026, up $3.3 billion from Q2 2025, and $27.9 billion in YTD 2026, up $4.4 billion from YTD 2025.
▪CCPG revenue increased $1.0 billion from Q2 2025 and $1.1 billion from YTD 2025. Client revenue (collectively notebook and desktop) was $7.7 billion in Q2 2026, up $1.1 billion from Q2 2025, and $14.3 billion in YTD 2026, up $1.2 billion from YTD 2025, primarily driven by ASP increases of 27% and 22%, respectively. The majority of the increase in ASPs was driven by a higher mix of premium products sold in Q2 2026 and YTD 2026, with demand-based pricing actions contributing to a lesser extent, in part to offset higher input costs. This increase in client revenue was partially offset by volume decreases of 8% compared to Q2 2025 and 10% compared to YTD 2025. Market demand exceeded our available product supply in Q2 2026 and YTD 2026 due to industry-wide supply constraints. While supply constraints impacted our results during the first half of 2026, we expect these constraints to ease over the second half of 2026. Other CCPG revenue was $1.1 billion in Q2 2026, down $127 million from Q2 2025, and $2.3 billion in YTD 2026, down $82 million from YTD 2025.
▪DCAI revenue increased $2.3 billion from Q2 2025 and $3.2 billion from YTD 2025, primarily driven by higher server revenue, which increased $2.0 billion in Q2 2026 and $2.7 billion in YTD 2026 due to ASP increases of 48% and 38%, respectively. The majority of the increase in server ASPs was driven by a higher mix of premium products sold in Q2 2026 and YTD 2026, with demand-based pricing actions contributing to a lesser extent, in part to offset higher input costs. Server volume increased 9% compared to Q2 2025 and 2% compared to YTD 2025, primarily driven by higher hyperscaler demand. Market demand exceeded our available product supply in Q2 2026 and YTD 2026 due to internal supply constraints. Though we continue to add capacity in our factories to increase supply and mitigate these constraints, we expect industry-wide supply constraints to persist into next year. Other DCAI revenue was $951 million in Q2 2026, up $304 million from Q2 2025, and $1.9 billion in YTD 2026, up $533 million from YTD 2025, primarily driven by higher demand for purpose-built silicon, or ASICs.
Segment Operating Income Summary
Q2 2026 vs. Q2 2025
Total Intel Products operating income was $4.8 billion in Q2 2026, up $2.1 billion from Q2 2025.
▪CCPG operating income increased $290 million from Q2 2025, primarily driven by $701 million of higher product profit in Q2 2026 primarily related to higher client revenue, partially offset by higher client unit costs resulting from an increased mix of premium products sold in Q2 2026. Operating income also benefited from $258 million of lower operating expenses, primarily related to lower payroll-related expenditures resulting from headcount reductions taken under the 2025 Restructuring Plan and the effects of various cost-reduction measures. These benefits were partially offset by $669 million of higher period charges, primarily due to an inventory-related charge recognized in Q2 2026 to align product mix with customer demand.
▪DCAI operating income increased $1.8 billion from Q2 2025, primarily driven by $1.7 billion of higher product profit in Q2 2026, primarily related to higher server revenue, partially offset by higher server unit costs resulting from an increased mix of premium products sold in Q2 2026.
YTD 2026 vs. YTD 2025
Total Intel Products operating income was $8.9 billion in YTD 2026, up $3.3 billion from YTD 2025.
▪CCPG operating income increased $445 million from YTD 2025, primarily driven by $673 million of higher product profit in YTD 2026, primarily related to higher client revenue, partially offset by higher client unit costs resulting from an increased mix of premium products sold in YTD 2026. Operating income also benefited from $507 million of lower operating expenses, primarily related to lower payroll-related expenditures resulting from headcount reductions taken under the 2025 Restructuring Plan and the effects of various cost-reduction measures. These benefits were partially offset by $735 million of higher period charges, primarily due to an inventory-related charge recognized in Q2 2026 to align product mix with customer demand.
▪DCAI operating income increased $2.8 billion from YTD 2025, primarily driven by $2.3 billion of higher product profit in YTD 2026, primarily related to higher server revenue, partially offset by higher server unit costs resulting from an increased mix of premium products sold in YTD 2026. Operating income also benefited from $512 million of lower period charges in YTD 2026, primarily related to the absence of Gaudi AI accelerator inventory-related charges incurred in YTD 2025.
Intel Foundry
Intel Foundry, comprised of technology development, manufacturing and foundry services, develops new leading-edge semiconductor process technologies and advanced packaging technologies and provides manufacturing, assembly and test and advanced packaging capacity and design enablement solutions across multiple nodes and platforms. We continue to innovate and advance leading-edge semiconductor process technology and manufacturing in the U.S., where we are the only company conducting both leading-edge logic R&D and high-volume manufacturing. At present, substantially all of our Intel Foundry business supports internal manufacturing for Intel Products; however, we are offering our Intel Foundry services to external customers and aim to develop a more significant external foundry business in the future.
Intel Foundry Financial Performance1
| | | | | | | | | | | | | | | | | | | | | | | | | | | | |
| | Three Months Ended | | Six Months Ended | | |
| ($ In Millions) | | Jun 27, 2026 | | Jun 28, 2025 | | Jun 27, 2026 | | Jun 28, 2025 | | |
| Revenue | | $ | 5,765 | | | $ | 4,417 | | | $ | 11,186 | | | $ | 9,084 | | | |
| Cost of sales and operating expenses | | 7,854 | | | 7,585 | | | 15,712 | | | 14,572 | | | |
| Operating loss | | $ | (2,089) | | | $ | (3,168) | | | $ | (4,526) | | | $ | (5,488) | | | |
| | | | | | | | | | |
| Operating loss % | | (36)% | | (72)% | | (40)% | | (60)% | | |
1 Operating segment results include intersegment financial activity; refer to "Note 2: Operating Segments" within Notes to Consolidated Condensed Financial Statements for a reconciliation between our operating segment and consolidated financial results for the periods presented.
Operating Segment Revenue Summary
Q2 2026 vs. Q2 2025 and YTD 2026 vs. YTD 2025
Revenue was $5.8 billion in Q2 2026, up $1.3 billion from Q2 2025, and $11.2 billion in YTD 2026, up $2.1 billion from YTD 2025. Intersegment revenue was $5.5 billion in Q2 2026, up $1.1 billion from Q2 2025, and $10.7 billion in YTD 2026, up $1.7 billion from YTD 2025, primarily driven by higher wafer volumes from Intel 18A, Intel 3, and Intel 4 process nodes, which carry higher ASPs relative to predecessor process nodes. External revenue was $293 million in Q2 2026, up $271 million from Q2 2025, and $467 million in YTD 2026, up $414 million from YTD 2025, primarily due to Altera's transition to an external customer following the deconsolidation of Altera in Q3 2025.
Segment Operating Loss Summary
Q2 2026 vs. Q2 2025
Operating loss was $2.1 billion in Q2 2026, compared to an operating loss of $3.2 billion in Q2 2025, primarily driven by $1.4 billion of lower period charges, including the absence of $797 million of non-cash asset impairment and accelerated depreciation charges recognized in Q2 2025 related to certain manufacturing assets that were determined to have no remaining operational use. This benefit was partially offset by $340 million of lower product profit in Q2 2026, driven by an increased mix of higher-cost wafers manufactured on our Intel 18A process node, which substantially offset higher revenue and lower wafer costs on Intel 3 and Intel 4 process nodes.
YTD 2026 vs. YTD 2025
Operating loss was $4.5 billion in YTD 2026, compared to an operating loss of $5.5 billion in YTD 2025, primarily driven by $1.8 billion of lower period charges, including the absence of $797 million of non-cash asset impairment and accelerated depreciation charges recognized in Q2 2025 related to certain manufacturing assets that were determined to have no remaining operational use, as well as $391 million of lower inventory charges primarily driven by the intersegment sell-through of inventory with lower of cost or net realizable value intersegment reserves resulting from the early ramp of our Intel 18A process node. These benefits were partially offset by $830 million of lower product profit in YTD 2026, driven by an increased mix of higher-cost wafers manufactured on our Intel 18A process node, which substantially offset higher revenue and lower wafer costs on Intel 3 and Intel 4 process nodes.
All Other
Our "All Other" category includes the results of operations from non-reportable segments, including our Mobileye business, our IMS business, start-up businesses that support our initiatives and historical results of operations from divested businesses, including Altera. Mobileye, a publicly traded company, is a global leader in driving assistance and self-driving solutions, with a product portfolio designed to encompass the entire stack required for assisted and autonomous driving, including compute platforms, computer vision and machine learning-based perception, mapping and localization, driving policy and active sensors in development. IMS specializes in developing and manufacturing multi-beam mask writing tools. Altera, a business offering programmable semiconductors, primarily FPGAs, and related products for a broad range of applications that was previously a wholly owned subsidiary, was deconsolidated from our Consolidated Condensed Financial Statements effective September 12, 2025, following the closing of the sale of 51% of Altera's issued and outstanding common stock. Altera's financial results of operations were included in our "All Other" category through September 11, 2025.
All Other Financial Performance1
| | | | | | | | | | | | | | | | | | | | | | | | | | |
| | Three Months Ended | | Six Months Ended |
| ($ In Millions) | | Jun 27, 2026 | | Jun 28, 2025 | | Jun 27, 2026 | | Jun 28, 2025 |
| Revenue | | $ | 701 | | | $ | 1,053 | | | $ | 1,329 | | | $ | 1,996 | |
| Cost of sales and operating expenses | | 471 | | | 984 | | | 997 | | | 1,824 | |
| Operating income | | $ | 230 | | | $ | 69 | | | $ | 332 | | | $ | 172 | |
| | | | | | | | |
| Operating margin % | | 33% | | 7% | | 25% | | 9% |
1 Operating segment results include intersegment financial activity; refer to "Note 2: Operating Segments" within Notes to Consolidated Condensed Financial Statements for a reconciliation between our operating segment and consolidated financial results for the periods presented.
Operating Segment Revenue Summary
Q2 2026 vs. Q2 2025
All Other revenue was $701 million, down $352 million from Q2 2025, primarily driven by lower revenue resulting from the deconsolidation of Altera in Q3 2025. Mobileye revenue was $507 million in Q2 2026, flat with Q2 2025.
YTD 2026 vs. YTD 2025
All Other revenue was $1.3 billion, down $667 million from YTD 2025, primarily driven by lower revenue resulting from the deconsolidation of Altera in Q3 2025. This decrease was partially offset by higher Mobileye revenue in YTD 2026, which totaled $1.1 billion, up $120 million from YTD 2025, primarily driven by higher demand for Mobileye EyeQ* products.
Segment Operating Income Summary
Q2 2026 vs. Q2 2025 and YTD 2026 vs. YTD 2025
All Other operating income was $230 million in Q2 2026, up $161 million from Q2 2025, and $332 million in YTD 2026, up $160 million from YTD 2025, primarily driven by higher operating income from our other businesses in Q2 2026 and YTD 2026, partially offset by the absence of Altera operating margin in Q2 2026 and YTD 2026.
| | | | | |
| Consolidated Condensed Results of Operations | |
| |
| | | | | | | | | | | | | | | | | | | | | | | | | | | | | | | | | | | | | | | | | | | | | | | | | | |
| | Three Months Ended | | Six Months Ended |
| | Jun 27, 2026 | | Jun 28, 2025 | | Jun 27, 2026 | | Jun 28, 2025 |
| (In Millions, Except Per Share Amounts) | | Amount | | % of Net Revenue1 | | Amount | | % of Net Revenue1 | | Amount | | % of Net Revenue1 | | Amount | | % of Net Revenue1 |
| Net revenue | | $ | 16,128 | | | 100.0 | % | | $ | 12,859 | | | 100.0 | % | | $ | 29,705 | | | 100.0 | % | | $ | 25,526 | | | 100.0 | % |
| Cost of sales | | 9,619 | | | 59.6 | % | | 9,317 | | | 72.5 | % | | 17,849 | | | 60.1 | % | | 17,312 | | | 67.8 | % |
| Gross profit | | 6,509 | | | 40.4 | % | | 3,542 | | | 27.5 | % | | 11,856 | | | 39.9 | % | | 8,214 | | | 32.2 | % |
| Research and development | | 3,368 | | | 20.9 | % | | 3,684 | | | 28.6 | % | | 6,743 | | | 22.7 | % | | 7,324 | | | 28.7 | % |
| Marketing, general, and administrative | | 1,175 | | | 7.3 | % | | 1,144 | | | 8.9 | % | | 2,213 | | | 7.4 | % | | 2,321 | | | 9.1 | % |
| Restructuring and other charges | | 170 | | | 1.1 | % | | 1,890 | | | 14.7 | % | | 4,240 | | | 14.3 | % | | 2,046 | | | 8.0 | % |
| Operating income (loss) | | 1,796 | | | 11.1 | % | | (3,176) | | | (24.7) | % | | (1,340) | | | (4.5) | % | | (3,477) | | | (13.6) | % |
| Gains (losses) on equity investments, net | | (39) | | | (0.2) | % | | 502 | | | 3.9 | % | | (111) | | | (0.4) | % | | 390 | | | 1.5 | % |
| Interest and other, net | | (12,576) | | | (78.0) | % | | (95) | | | (0.7) | % | | (13,314) | | | (44.8) | % | | (268) | | | (1.0) | % |
| Income (loss) before taxes | | (10,819) | | | (67.1) | % | | (2,769) | | | (21.5) | % | | (14,765) | | | (49.7) | % | | (3,355) | | | (13.1) | % |
| Provision for (benefit from) taxes | | 29 | | | 0.2 | % | | 255 | | | 2.0 | % | | 364 | | | 1.2 | % | | 556 | | | 2.2 | % |
| Net income (loss) | | (10,848) | | | (67.3) | % | | (3,024) | | | (23.5) | % | | (15,129) | | | (50.9) | % | | (3,911) | | | (15.3) | % |
| Less: net income (loss) attributable to non-controlling interests | | 185 | | | 1.1 | % | | (106) | | | (0.8) | % | | (368) | | | (1.2) | % | | (172) | | | (0.7) | % |
| Net income (loss) attributable to Intel | | $ | (11,033) | | | (68.4) | % | | $ | (2,918) | | | (22.7) | % | | $ | (14,761) | | | (49.7) | % | | $ | (3,739) | | | (14.6) | % |
| | | | | | | | | | | | | | | | |
| Earnings (loss) per share attributable to Intel—diluted | | $ | (2.16) | | | | | $ | (0.67) | | | | | $ | (2.89) | | | | | $ | (0.86) | | | |
| | | | | | | | | | | | | | | | |
1 Totals may not sum due to rounding.
Consolidated Revenue
| | | | | | | |
Consolidated Revenue Walk $B1 | |
| | | |
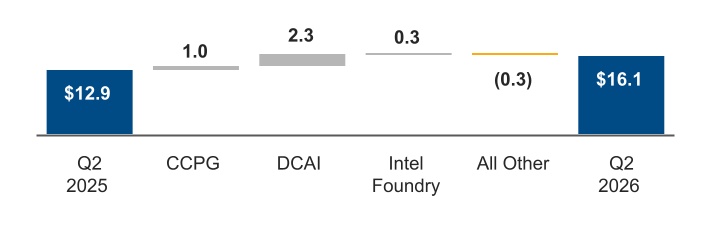
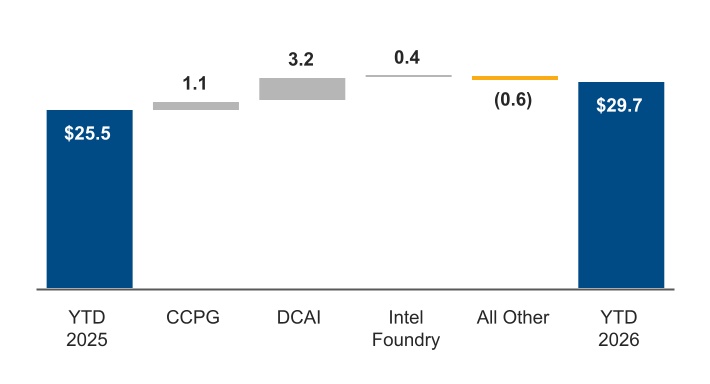
1 Excludes intersegment revenue; totals may not sum due to rounding.
Q2 2026 vs. Q2 2025 and YTD 2026 vs. YTD 2025
Our revenue was $16.1 billion in Q2 2026, up $3.3 billion from Q2 2025, and $29.7 billion in YTD 2026, up $4.2 billion from YTD 2025, primarily driven by higher Intel Products revenue. Intel Products revenue increased 28% from Q2 2025 and 18% from YTD 2025, driven by higher DCAI and CCPG revenue. DCAI revenue increased 59% from Q2 2025 and 40% from YTD 2025, and CCPG revenue increased 13% from Q2 2025 and 7% from YTD 2025. These increases were primarily driven by ASP increases, the majority of which resulted from a higher mix of premium products sold, with demand-based pricing actions contributing to a lesser extent, in part to offset higher input costs in Q2 2026 and YTD 2026. Intel Foundry revenue increased, and All Other revenue decreased, compared to Q2 2025 and YTD 2025, primarily due to Altera's transition to an external customer following the deconsolidation of Altera in Q3 2025.
In Q2 2026 and YTD 2026, market demand exceeded our available product supply due to capacity constraints at our factories and industry-wide supply constraints. We expect these industry-wide shortages of substrates, memory and other critical components to persist into next year, which may limit our ability to fully meet customer demand. We continue to take actions to increase supply and mitigate these constraints, including adding capacity in our factories and securing component supply through long-term agreements with suppliers.
Consolidated Gross Profit
We derived a substantial majority of our consolidated gross profit in Q2 2026 and in YTD 2026 from our Intel Products business sales through our CCPG and DCAI operating segments.
| | | |
| Gross Profit $B1 |
| (Percentages in chart indicate gross profit as a percentage of total revenue) |
1 Amounts presented may not recalculate due to rounding.
Q2 2026 vs. Q2 2025
Our consolidated gross profit in Q2 2026 increased by $3.0 billion, or 84%, compared to Q2 2025, primarily driven by $1.5 billion of higher product profit in Q2 2026, primarily related to higher revenue, partially offset by higher unit costs resulting from an increased mix of premium products sold in Q2 2026. Gross profit also benefited from $1.5 billion of lower period charges. The lower period charges resulted from, among other things, the absence in Q2 2026 of $797 million of non-cash asset impairment and accelerated depreciation charges recognized in Q2 2025 related to certain manufacturing assets that were determined to have no remaining operational use, partially offset by an inventory-related charge recognized in Q2 2026 to align product mix with customer demand.
YTD 2026 vs. YTD 2025
Our consolidated gross profit in YTD 2026 increased by $3.6 billion, or 44%, compared to YTD 2025, primarily driven by $2.2 billion of lower period charges. The lower period charges resulted from, among other things, the absence in Q2 2026 of $797 million of non-cash asset impairment and accelerated depreciation charges recognized in Q2 2025 related to certain manufacturing assets that were determined to have no remaining operational use. Lower period charges also resulted from $294 million of lower inventory-related charges taken in YTD 2026 as compared to YTD 2025, primarily due to the absence of Gaudi AI accelerator inventory-related charges incurred in YTD 2025 and $226 million of lower reserves resulting from the sell-through of inventory with lower of cost or net realizable value reserves recognized during the early ramp of our Intel 18A process node, partially offset by an inventory-related charge recognized in YTD 2026 to align product mix with customer demand. Gross profit also benefited from $1.4 billion of higher product profit in YTD 2026, primarily related to higher revenue, partially offset by higher unit costs resulting from an increased mix of premium products sold in YTD 2026.
Consolidated R&D and MG&A Expenses
Total R&D and MG&A expenses for Q2 2026 were $4.5 billion, down 6% from Q2 2025, and $9.0 billion for YTD 2026, down 7% from YTD 2025. These expenses represent 28.2% of revenue for Q2 2026 and 37.5% of revenue for Q2 2025, and 30.1% of revenue for YTD 2026 and 37.8% of revenue for YTD 2025. In support of our strategy, as described in our 2025 Form 10-K, we continue to make investments to advance our product and process technology roadmaps. As a result of our 2025 and 2024 Restructuring Plans and related cost-reduction measures and the deconsolidation of Altera in Q3 2025, we expect total R&D and MG&A expenses to decrease in 2026 relative to recent historical periods.
| | | | | | | | | |
| Research and Development $B | | Marketing, General, and Administrative $B |
| |
(Percentages in chart indicate operating expenses as a percentage of total revenue)
Research and Development
Q2 2026 vs. Q2 2025 and YTD 2026 vs. YTD 2025
Q2 2026 R&D expenses decreased by $316 million, or 9%, from Q2 2025, and YTD 2026 R&D expenses decreased by $581 million, or 8%, from YTD 2025, primarily driven by lower payroll-related expenditures resulting from headcount reductions taken under the 2025 Restructuring Plan and other cost-reduction measures, as well as lower expenses in Q2 2026 and YTD 2026 due to the Q3 2025 deconsolidation of Altera. These decreases were partially offset by higher incentive-based cash compensation in Q2 2026 and YTD 2026.
Marketing, General, and Administrative
Q2 2026 vs. Q2 2025
Q2 2026 MG&A expenses increased by $31 million, or 3%, from Q2 2025, primarily driven by higher share-based compensation, partially offset by lower payroll-related expenditures resulting from headcount reductions taken under the 2025 Restructuring Plan and other cost-reduction measures, as well as lower expenses in Q2 2026 due to the Q3 2025 deconsolidation of Altera.
YTD 2026 vs. YTD 2025
YTD 2026 MG&A expenses decreased by $108 million, or 5%, from YTD 2025, primarily driven by lower payroll-related expenditures resulting from headcount reductions taken under the 2025 Restructuring Plan and other cost-reduction measures, as well as lower expenses in YTD 2026 due to the Q3 2025 deconsolidation of Altera. These decreases were partially offset by higher share-based compensation in YTD 2026.
Restructuring and Other Charges
| | | | | | | | | | | | | | | | | | | | | | | | | | |
| | Three Months Ended | | Six Months Ended |
| (In Millions) | | Jun 27, 2026 | | Jun 28, 2025 | | Jun 27, 2026 | | Jun 28, 2025 |
| Employee severance and benefit arrangements | | $ | 161 | | | $ | 1,466 | | | $ | 235 | | | $ | 1,607 | |
| | | | | | | | |
| Litigation charges and other | | 7 | | | 8 | | | 38 | | | 20 | |
| Asset impairment charges | | 2 | | | 416 | | | 3,967 | | | 419 | |
| Total restructuring and other charges | | $ | 170 | | | $ | 1,890 | | | $ | 4,240 | | | $ | 2,046 | |
In Q2 2025, we announced and commenced the 2025 Restructuring Plan, which was designed to streamline our organizational structure, enable us to focus on our core businesses and lower our overall operating expenses. Refer to "Note 6: Restructuring and Other Charges" within Notes to Consolidated Condensed Financial Statements for further information. The substantial majority of the actions contemplated by the 2025 Restructuring Plan were completed in 2025, with the remainder expected to be completed in 2026. Any changes to our estimates or timing will be reflected in our results of operations in future periods.
The 2024 Restructuring Plan, which we initiated in Q3 2024, was substantially complete by the end of 2025, with the remainder expected to be completed in 2026.
Q2 2026 vs. Q2 2025 and YTD 2026 vs. YTD 2025
Employee severance and benefit arrangements included charges of $161 million in Q2 2026 and $235 million in YTD 2026, primarily relating to the 2025 Restructuring Plan, compared to $1.5 billion in Q2 2025 and $1.6 billion in YTD 2025. Charges in Q2 2025 and YTD 2025 primarily related to the 2025 Restructuring Plan, with the remaining charges relating to the 2024 Restructuring Plan.
Asset impairment charges in YTD 2026 included non-cash goodwill impairment charges of $3.9 billion (refer to "Note 10: Goodwill" within Notes to Consolidated Condensed Financial Statements). In YTD 2025, asset impairment charges included non-cash charges associated with the 2025 Restructuring Plan resulting from the exit of certain non-core lines of business and the consolidation and exit of certain real estate properties.
Gains (Losses) on Equity Investments, Net and Interest and Other, Net
| | | | | | | | | | | | | | | | | | | | | | | | | | | | | | | |
| | Three Months Ended | | Six Months Ended | | | | | |
| (In Millions) | | Jun 27, 2026 | | Jun 28, 2025 | | Jun 27, 2026 | | Jun 28, 2025 | | | | | |
| Unrealized gains (losses) on marketable equity investments, net | | $ | (60) | | | $ | (58) | | | $ | (216) | | | $ | (350) | | | | | | |
Unrealized gains (losses) on non-marketable equity investments, net1 | | 10 | | | 473 | | | 112 | | | 473 | | | | | | |
| Impairment charges on non-marketable equity investments | | (92) | | | (51) | | | (154) | | | (156) | | | | | | |
| Unrealized gains (losses) on equity investments, net | | (142) | | | 364 | | | (258) | | | (33) | | | | | | |
| Realized gains (losses) on sales of equity investments, net | | 103 | | | 138 | | | 147 | | | 423 | | | | | | |
| Gains (losses) on equity investments, net | | $ | (39) | | | $ | 502 | | | $ | (111) | | | $ | 390 | | | | | | |
| | | | | | | | | | | | | |
| Interest and other, net | | $ | (12,576) | | | $ | (95) | | | $ | (13,314) | | | $ | (268) | | | | | | |
1 Unrealized gains (losses) on non-marketable investments includes observable price adjustments and our share of equity method investee gains (losses) and certain distributions.
Q2 2026 vs. Q2 2025
In Q2 2025, gains (losses) on equity investments, net were primarily driven by unrealized gains (losses) on non-marketable equity investments, which included $469 million of upward observable price adjustments, of which $396 million related to a single investee.
In Q2 2026, interest and other, net included a $12.5 billion net loss from the change in fair value of the derivative liability for the Escrowed Shares (refer to "Note 4: Earnings (Loss) Per Share and Stockholders' Equity" within Notes to Consolidated Condensed Financial Statements).
YTD 2026 vs. YTD 2025
In YTD 2026, gains (losses) on equity investments, net were primarily driven by mark-to-market losses on marketable equity investments due to share price declines related to two of our investments, partially offset by upward observable price adjustments related to five of our non-marketable equity investments. In addition, impairment charges on non-marketable equity investments were mostly offset by realized gains on sales of equity investments.
In YTD 2025, gains (losses) on equity investments, net were driven by upward observable price adjustments and realized gains on sales of equity investments, net, partially offset by unrealized losses on marketable equity investments and impairment charges.
In YTD 2026, interest and other, net included a $13.6 billion net loss from the change in fair value of the derivative liability for the Escrowed Shares, partially offset by a benefit of $223 million resulting from the change in fair value of liquidated damage provisions related to our Ireland SCIP arrangement (refer to "Note 3: Non-Controlling Interests" within Notes to Consolidated Condensed Financial Statements).
In YTD 2025 interest and other, net included $94 million of charges related to the sale of our NAND memory business (refer to "Note 9: Acquisitions and Divestitures" within Notes to Consolidated Condensed Financial Statements), unfavorable foreign currency movements, and a decrease in interest income.
Provision for (Benefit from) Taxes
| | | | | | | | | | | | | | | | | | | | | | | | | | |
| | Three Months Ended | | Six Months Ended |
| ($ In Millions) | | Jun 27, 2026 | | Jun 28, 2025 | | Jun 27, 2026 | | Jun 28, 2025 |
| Income (loss) before taxes | | $ | (10,819) | | | $ | (2,769) | | | $ | (14,765) | | | $ | (3,355) | |
| Provision for (benefit from) taxes | | $ | 29 | | | $ | 255 | | | $ | 364 | | | $ | 556 | |
| Effective tax rate | | (0.3) | % | | (9.2) | % | | (2.5) | % | | (16.6) | % |
Q2 2026 vs. Q2 2025 and YTD 2026 vs. YTD 2025
In all periods presented, our provision for income taxes was determined using our estimated annual effective tax rate applied to our year-to-date ordinary income (loss) before taxes, adjusted for discrete items, and we were not able to benefit from our current year domestic loss before taxes due to the domestic valuation allowance. Our provision for taxes decreased in Q2 2026 and YTD 2026, compared to Q2 2025 and YTD 2025, primarily due to increased stock-based compensation deductions.
Net Income (Loss) Attributable to Non-Controlling Interests
Net income (loss) attributable to non-controlling interests is impacted by the minority-owned portion of our consolidated, majority-owned subsidiaries.
| | | | | | | | | | | | | | | | | | | | | | | | | | |
| | Three Months Ended | | Six Months Ended |
| (In Millions) | | Jun 27, 2026 | | Jun 28, 2025 | | Jun 27, 2026 | | Jun 28, 2025 |
| Ireland SCIP | | $ | — | | | $ | 59 | | | $ | 135 | | | $ | 98 | |
| Arizona SCIP | | 176 | | | (140) | | | 359 | | | (232) | |
| Mobileye | | (5) | | | (7) | | | (872) | | | (19) | |
| IMS | | 14 | | | (18) | | | 10 | | | (19) | |
| Total net income (loss) attributable to non-controlling interests | | $ | 185 | | | $ | (106) | | | $ | (368) | | | $ | (172) | |
Q2 2026 vs. Q2 2025
In Q2 2026, net income attributable to non-controlling interests was primarily driven by income earned by Arizona SCIP based on the ongoing placement of their manufacturing assets into service. In Q2 2025, net loss attributable to non-controlling interests was primarily driven by start-up construction expenses incurred by Arizona SCIP.
As described in “Repurchase of Non-Controlling Interests in Ireland SCIP” at the beginning of this MD&A, in Q2 2026, we acquired all of the outstanding minority holder ownership interests in Ireland SCIP, one of our majority-owned, consolidated subsidiaries, for $14.2 billion in cash. The equity transaction closed on April 8, 2026, after which net income attributable to non-controlling interests in Ireland SCIP ceased.
YTD 2026 vs. YTD 2025
In YTD 2026, net loss attributable to non-controlling interests was primarily driven by a non-cash goodwill impairment charge related to our Mobileye reporting unit in Q1 2026, partially offset by income earned by Arizona SCIP based on the ongoing placement of their manufacturing assets into service. In YTD 2025, net loss attributable to non-controlling interests was primarily driven by start-up construction expenses incurred by Arizona SCIP.
Liquidity and Capital Resources
We believe we have sufficient sources of funding to meet our business requirements for the next 12 months and in the longer term. Our primary sources of liquidity are cash generated by operations and our total cash and short-term investments, as shown in the following table. These sources are further supplemented by our drawn and undrawn committed credit facilities and other borrowing capacity; recent equity securities agreements and issuances; possible future debt and equity issuances pursuant to our shelf registration statement; monetization of non-core assets and contributions from our Arizona SCIP partner.
Short-Term Investing and Borrowing
When assessing our current sources of liquidity, we consider our total cash and short-term investments balances as follows:
| | | | | | | | | | | | | | |
| (In Millions) | | Jun 27, 2026 | | Dec 27, 2025 |
| Cash and cash equivalents | | $ | 12,874 | | | $ | 14,265 | |
| Short-term investments | | 16,853 | | | 23,151 | |
| | | | |
| | | | |
| | | | |
| Total cash and short-term investments | | $ | 29,727 | | | $ | 37,416 | |
| | | | |
| | | | |
| Total debt | | $ | 50,537 | | | $ | 46,585 | |
In Q1 2026, we settled $1.5 billion of our senior notes due February 2026 and amended our 364-day $5.0 billion credit facility agreement to a three-year $3.0 billion credit facility maturing January 2029. Additionally, we have access to our $7.0 billion revolving credit facility, which remains available until February 2029.
In Q2 2026, we settled $1.0 billion of our senior notes due May 2026 and we issued a total of $6.5 billion aggregate principal amount of senior notes comprised of $1.0 billion in 4.65% senior notes due 2031, $1.0 billion in 5.00% senior notes due 2033, $2.2 billion in 5.30% senior notes due 2036, $1.8 billion in 6.13% senior notes due 2056, and $500 million in 6.20% senior notes due 2066. We have other potential sources of liquidity including our commercial paper program and our automatic shelf registration statement on file with the SEC, pursuant to which we may offer an unspecified amount of debt, equity and other securities. Under our commercial paper program, we have an ongoing authorization from our Board of Directors to borrow up to $10.0 billion. As of June 27, 2026, we had no commercial paper obligations outstanding and no outstanding borrowings on the revolving credit facilities. As part of our ongoing capital management strategy to optimize our debt portfolio, we may utilize make-whole provisions, tender offers, or open market repurchases of our debt prior to maturity. In Q2 2026, we did not extinguish any debt prior to maturity.
As described in “Repurchase of Non-Controlling Interests in Ireland SCIP” at the beginning of this MD&A, in Q2 2026 we acquired the minority ownership interest in our majority-owned and consolidated Ireland SCIP VIE for aggregate cash consideration of $14.2 billion, inclusive of transaction costs. We funded the repurchase of Apollo's non-controlling equity interest through a combination of our existing cash and cash equivalents, short-term investments and a $6.5 billion term loan. The term loan facility was repaid in Q2 2026 using proceeds from the issuance of $6.5 billion aggregate principal amount of senior fixed-rate notes described above. Refer to “Note 11: Borrowings” within Notes to Consolidated Condensed Financial Statements.
Our total cash and short-term investments and related cash flows may be affected by certain discretionary actions we may take with customers and suppliers to accelerate or delay certain cash receipts or payments to manage liquidity, among other factors, for our strategic business requirements. These actions can include, among others, negotiating with suppliers to optimize our payment terms and conditions, adjusting the amounts and timing of cash flows associated with customer sales programs and collections, managing inventory levels and purchasing practices and selling certain of our accounts receivable on a non-recourse basis to third-party financial institutions. While such actions have benefited, and may further benefit, cash flow in the near term, we may experience a corresponding detriment to cash flow in future periods as these actions cease or as the impacts of these actions reverse or normalize.
We maintain a diverse investment portfolio that we continually analyze based on issuer, industry and country. Substantially all of our investments in debt instruments were in investment-grade securities.
Funding Requirements
Our short-term funding requirements include capital expenditures for worldwide manufacturing and assembly and test operations, including investments in our process technology roadmap; investments in our product roadmap; working capital requirements, including cash outlays associated with the 2025 Restructuring Plan and prepayments we may enter into to secure supply capacity; partner distributions to our non-controlling interest holder related to Arizona SCIP; reducing outstanding indebtedness; potential acquisitions and strategic investments. Our long-term funding requirements incrementally contemplate investments in significant manufacturing expansion plans and investments to accelerate our process technology. These plans include expanding existing operations in Arizona, New Mexico and Oregon and investing in a new leading-edge manufacturing facility in Ohio in the long term.
In Q1 2026, we entered into long-term arrangements with customers that included deposits totaling $1.7 billion, which were reflected within other accrued liabilities and other long-term liabilities, and for which the related cash was received in Q2 2026. In response to industry shortages of substrates and other components and to support long-term customer arrangements, we continue to enter into long-term agreements with suppliers to secure component supply. Some of these supply arrangements involve prepayments, of which $934 million were made in YTD 2026. These arrangements accelerate cash outflows in the short term.
Cash flows from operating, investing, and financing activities were as follows: | | | | | | | | | | | | | | |
| | Six Months Ended |
| (In Millions) | | Jun 27, 2026 | | Jun 28, 2025 |
| Net cash provided by (used for) operating activities | | $ | 8,102 | | | $ | 2,863 | |
| Net cash provided by (used for) investing activities | | (669) | | | (2,005) | |
| Net cash provided by (used for) financing activities | | (8,548) | | | 586 | |
| | | | |
| Net increase (decrease) in cash, cash equivalents, and restricted cash | | $ | (1,115) | | | $ | 1,444 | |
Operating Activities
Operating cash flows consist of net income (loss) adjusted for certain non-cash items and changes in certain assets and liabilities.
Cash provided by operations in the first six months of 2026 was higher compared to the first six months of 2025, primarily due to higher revenues and lower operating expenses after adjusting for non-cash items in the first six months of 2026 compared to the first six months of 2025. These cash favorable movements were partially offset by higher unfavorable changes in working capital adjustments in the first six months of 2026 compared to the first six months of 2025.
Investing Activities
Investing cash flows consist primarily of purchases, sales and maturities of short-term investments, capital expenditures and proceeds from divestitures.
Cash used for investing activities in the first six months of 2026 was lower compared to the first six months of 2025, primarily due to higher sales and maturities of short-term investments, net of purchases and lower capital expenditures during the first six months of 2026 compared to the first six months of 2025. These cash-favorable movements were partially offset by lower proceeds from capital-related government incentives, cash used for the acquisition of Mentee Robotics and lower inflows from other investing in the first six months of 2026 compared to the first six months of 2025, as well as the absence of proceeds from the divestiture of our NAND memory business received in the first six months of 2025.
Financing Activities
Financing cash flows consist primarily of borrowings and repayments of term debt and commercial paper, financing payments for capital expenditures with extended payment terms, proceeds and payments related to strategic initiatives including SCIP partner contributions and distributions.
Cash used for financing activities in the first six months of 2026, compared to cash provided by financing activities in the first six months of 2025, primarily related to partner distributions made to Apollo in connection with our repurchase of the 49% minority ownership interest in Ireland SCIP, repayment of term debt, the absence of proceeds from commercial paper issuances, higher payments on finance leases and restricted stock unit withholdings in the first six months of 2026. These unfavorable cash movements were partially offset by higher partner contributions, the issuance of term debt and lower financing payments for capital expenditures with extended payment terms in the first six months of 2026 compared to the first six months of 2025.
| | | | | |
Risk Factors and Other Key Information | |
| |
Risk Factors
The risks described within "Risk Factors" in our 2025 Form 10-K could materially and adversely affect our business, financial condition and results of operations, and the trading price of our common stock could decline. These risk factors do not identify all risks that we face as our operations could also be affected by factors that are not presently known to us or that we currently consider to be immaterial to our operations. Due to risks and uncertainties, known and unknown, our past financial results may not be a reliable indicator of future performance and historical trends should not be used to anticipate results or trends in future periods. Refer also to the other information set forth in this Form 10-Q, including in the Forward-Looking Statements, MD&A, and the Consolidated Condensed Financial Statements and Supplemental Details sections.
Quantitative and Qualitative Disclosures About Market Risk
We are affected by changes in currency exchange and interest rates, as well as equity and commodity prices. Our risk management programs are designed to reduce, but may not entirely eliminate, the impacts of these risks. For a discussion about market risk and sensitivity analysis related to changes in currency exchange rates, interest rates, equity prices and commodity prices, refer to "Quantitative and Qualitative Disclosures About Market Risk" within MD&A in our 2025 Form 10-K.
Controls and Procedures
Inherent Limitations on Effectiveness of Controls
Our management, including the principal executive officer and principal financial officer, does not expect that our disclosure controls and procedures or our internal control over financial reporting will prevent or detect all errors and all fraud. A control system, no matter how well-designed and operated, can provide only reasonable, not absolute, assurance that the control system’s objectives will be met. The design of a control system must reflect the fact that there are resource constraints, and the benefits of controls must be considered relative to their costs. Further, because of the inherent limitations in all control systems, no evaluation of controls can provide absolute assurance that misstatements due to error or fraud will not occur or that all control issues and instances of fraud, if any, have been detected.
Evaluation of Disclosure Controls and Procedures
Based on management’s evaluation (with the participation of our principal executive officer and principal financial officer), as of the end of the period covered by this report, our principal executive officer and principal financial officer have concluded that our disclosure controls and procedures (as defined in Rules 13a-15(e) and 15d-15(e) under the Securities Exchange Act of 1934, as amended (the Exchange Act)), were effective to provide reasonable assurance that information required to be disclosed by us in reports that we file or submit under the Exchange Act is recorded, processed, summarized and reported within the time periods specified in SEC rules and forms, and is accumulated and communicated to management, including our principal executive officer and principal financial officer, as appropriate, to allow timely decisions regarding required disclosure.
Changes in Internal Control Over Financial Reporting
There were no changes to our internal control over financial reporting (as defined in Rules 13a-15(f) and 15d-15(f) under the Exchange Act) that occurred during the quarter ended June 27, 2026 that have materially affected, or are reasonably likely to materially affect, our internal control over financial reporting.
Issuer Purchases of Equity Securities
We have an ongoing authorization, originally approved by our Board of Directors in 2005 and subsequently amended on October 24, 2019, to repurchase shares of our common stock in open market or negotiated transactions. No shares were repurchased during the quarter ended June 27, 2026. As of June 27, 2026, we were authorized to repurchase up to $110.0 billion, of which $7.2 billion remained available.
We issue RSUs as part of our equity incentive plans. In our Consolidated Condensed Financial Statements, we treat shares of common stock withheld for tax purposes on behalf of our employees in connection with the vesting of RSUs as common stock repurchases because they reduce the number of shares that would have been issued upon vesting. These withheld shares of common stock are not considered common stock repurchases under our authorized common stock repurchase program.
Rule 10b5-1 Trading Arrangements
Our directors and officers (as defined in Rule 16a-1 under the Exchange Act) may from time to time enter into plans or other arrangements for the purchase or sale of our shares that are intended to satisfy the affirmative defense conditions of Rule 10b5–1(c) or may represent a non-Rule 10b5-1 trading arrangement under the Exchange Act. During the quarter ended June 27, 2026, no such plans or arrangements were adopted or terminated, including by modification.
Disclosure Pursuant to Section 13(r) of the Securities Exchange Act of 1934
Section 13(r) of the Exchange Act requires an issuer to disclose certain information in its periodic reports if it or any of its affiliates knowingly engaged in certain activities, transactions, or dealings with individuals or entities subject to specific U.S. economic sanctions during the reporting period, even when the activities, transactions, or dealings are conducted in compliance with applicable law. On March 2, 2021, the U.S. Secretary of State designated the FSB as a party subject to one such sanction. Though Intel has suspended sales in Russia, there may be a need to file documents or engage with the FSB as Intel winds up our local Russian offices. All such dealings are explicitly authorized by General License 1B issued by the U.S. Department of the Treasury’s OFAC, and there are no gross revenues or net profits directly associated with any such dealings by us with the FSB.
Exhibits
| | | | | | | | | | | | | | | | | | | | | | | | | | | | | | | | | | | | | | |
| | | | | Incorporated by Reference | | |
Exhibit
Number | | Exhibit Description | | Form | | File Number | | Exhibit | | Filing
Date | | Filed or Furnished Herewith |
| 3.1 | | | | 10-Q | | 000-06217 | | 3.1 | | 10/27/2023 | | |
| 3.2 | | | | 8-K | | 000-06217 | | 3.2 | | 12/5/2023 | | |
| 4.1 | | | | 8-K | | 000-06217 | | 4.1 | | 4/30/2026 | | |
10.1† | | | | | | | | | | | | X |
10.2† | | | | | | | | | | | | X |
| 31.1 | | | | | | | | | | | | X |
| 31.2 | | | | | | | | | | | | X |
| | | | | | | | | | | | |
| 32.1 | | | | | | | | | | | | X |
| 101 | | Inline XBRL Document Set for the consolidated condensed financial statements and accompanying notes in Consolidated Condensed Financial Statements and Supplemental Details | | | | | | | | | | X |
| | | | | | | | | | | | |
| | | | | | | | | | | | |
| | | | | | | | | | | | |
| | | | | | | | | | | | |
| | | | | | | | | | | | |
| 104 | | Cover Page Interactive Data File - formatted in Inline XBRL and included as Exhibit 101 | | | | | | | | | | X |
† Management contracts or compensation plans or arrangements in which directors or executive officers are eligible to participate.
Form 10-Q Cross-Reference Index
| | | | | | | | |
| Item Number | Item | |
| Part I - Financial Information | |
| Item 1. | Financial Statements | |
| Item 2. | Management's Discussion and Analysis of Financial Condition and Results of Operations | |
| Results of operations | |
| Liquidity and capital resources | |
| | |
| | |
| | |
| Critical accounting estimates | Not applicable |
| Item 3. | Quantitative and Qualitative Disclosures About Market Risk | |
| Item 4. | Controls and Procedures | |
| | |
| Part II - Other Information | |
| Item 1. | Legal Proceedings | |
| Item 1A. | Risk Factors | |
| Item 2. | Unregistered Sales of Equity Securities and Use of Proceeds | |
| Item 3. | Defaults Upon Senior Securities | Not applicable |
| Item 4. | Mine Safety Disclosures | Not applicable |
| Item 5. | Other Information | |
| | |
| | |
| Rule 10b5-1 Trading Arrangements | |
| Disclosure Pursuant to Section 13(r) of the Securities Exchange Act of 1934 | |
| | |
| Item 6. | Exhibits | |
| | |
| Signatures | |
Signatures
Pursuant to the requirements of the Securities Exchange Act of 1934, the registrant has duly caused this report to be signed on its behalf by the undersigned thereunto duly authorized.
| | | | | | | | | | | | | | | | | |
| | | INTEL CORPORATION
(Registrant) |
| | | | | |
Date: July 23, 2026 | | | By: | | /s/ DAVID ZINSNER |
| | | | | David Zinsner |
| | | | | Executive Vice President and Chief Financial Officer
(Principal Financial Officer and Principal Accounting Officer) |