Financial summary
Ten years ended December 29, 2001
| (In millions—except per share amounts) |
Net revenues |
Cost of sales |
Research & development |
Purchased in-process research & development |
Amortization of goodwill & acquistion- related intangibles & costs |
Operating income |
Net income |
Basic earnings per share |
Diluted earnings per share |
||||||||||||||||||
|---|---|---|---|---|---|---|---|---|---|---|---|---|---|---|---|---|---|---|---|---|---|---|---|---|---|---|---|
| 2001 | $ | 26,539 | $ | 13,487 | $ | 3,796 | $ | 198 | $ | 2,338 | $ | 2,256 | $ | 1,291 | $ | .19 | $ | .19 | |||||||||
| 2000 | $ | 33,726 | $ | 12,650 | $ | 3,897 | $ | 109 | $ | 1,586 | $ | 10,395 | $ | 10,535 | $ | 1.57 | $ | 1.51 | |||||||||
| 1999 | $ | 29,389 | $ | 11,836 | $ | 3,111 | $ | 392 | $ | 411 | $ | 9,767 | $ | 7,314 | $ | 1.10 | $ | 1.05 | |||||||||
| 1998 | $ | 26,273 | $ | 12,088 | $ | 2,509 | $ | 165 | $ | 56 | $ | 8,379 | $ | 6,068 | $ | .91 | $ | .86 | |||||||||
| 1997 | $ | 25,070 | $ | 9,945 | $ | 2,347 | — | — | $ | 9,887 | $ | 6,945 | $ | 1.06 | $ | .97 | |||||||||||
| 1996 | $ | 20,847 | $ | 9,164 | $ | 1,808 | — | — | $ | 7,553 | $ | 5,157 | $ | .78 | $ | .73 | |||||||||||
| 1995 | $ | 16,202 | $ | 7,811 | $ | 1,296 | — | — | $ | 5,252 | $ | 3,566 | $ | .54 | $ | .50 | |||||||||||
| 1994 | $ | 11,521 | $ | 5,576 | $ | 1,111 | — | — | $ | 3,387 | $ | 2,288 | $ | .34 | $ | .33 | |||||||||||
| 1993 | $ | 8,782 | $ | 3,252 | $ | 970 | — | — | $ | 3,392 | $ | 2,295 | $ | .34 | $ | .33 | |||||||||||
| 1992 | $ | 5,844 | $ | 2,557 | $ | 780 | — | — | $ | 1,490 | $ | 1,067 | $ | .16 | $ | .16 | |||||||||||
| (In millions—except employees and per share amounts) |
Employees at year-end (in thousands) |
Net investment in property, plant & equipment |
Total assets |
Long-term debt & put warrants |
Stock- holders' equity |
Additions to property, plant & equipment |
Weighted average diluted shares outstanding |
Dividends declared per share |
Dividends paid per share |
||||||||||||||||
|---|---|---|---|---|---|---|---|---|---|---|---|---|---|---|---|---|---|---|---|---|---|---|---|---|---|
| 2001 | 83.4 | $ | 18,121 | $ | 44,395 | $ | 1,050 | $ | 35,830 | $ | 7,309 | 6,879 | $ | .080 | $ | .080 | |||||||||
| 2000 | 86.1 | $ | 15,013 | $ | 47,945 | $ | 707 | $ | 37,322 | $ | 6,674 | 6,986 | $ | .070 | $ | .070 | |||||||||
| 1999 | 70.2 | $ | 11,715 | $ | 43,849 | $ | 1,085 | $ | 32,535 | $ | 3,403 | 6,940 | $ | .055 | $ | .055 | |||||||||
| 1998 | 64.5 | $ | 11,609 | $ | 31,471 | $ | 903 | $ | 23,377 | $ | 4,032 | 7,035 | $ | .025 | $ | .033 | |||||||||
| 1997 | 63.7 | $ | 10,666 | $ | 28,880 | $ | 2,489 | $ | 19,295 | $ | 4,501 | 7,179 | $ | .029 | $ | .028 | |||||||||
| 1996 | 48.5 | $ | 8,487 | $ | 23,735 | $ | 1,003 | $ | 16,872 | $ | 3,024 | 7,101 | $ | .024 | $ | .023 | |||||||||
| 1995 | 41.6 | $ | 7,471 | $ | 17,504 | $ | 1,125 | $ | 12,140 | $ | 3,550 | 7,072 | $ | .019 | $ | .018 | |||||||||
| 1994 | 32.6 | $ | 5,367 | $ | 13,816 | $ | 1,136 | $ | 9,267 | $ | 2,441 | 6,992 | $ | .014 | $ | .014 | |||||||||
| 1993 | 29.5 | $ | 3,996 | $ | 11,344 | $ | 1,114 | $ | 7,500 | $ | 1,933 | 7,056 | $ | .013 | $ | .013 | |||||||||
| 1992 | 25.8 | $ | 2,816 | $ | 8,089 | $ | 622 | $ | 5,445 | $ | 1,228 | 6,872 | $ | .006 | $ | .003 | |||||||||
Management's discussion and analysis
of financial condition and results of operations
Results of operations
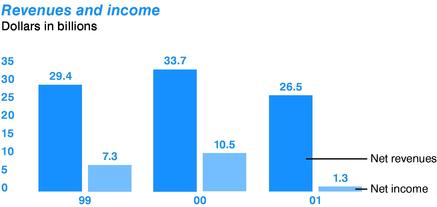
Consolidated revenues and margin > For 2001, our net revenues of $26.5 billion were 21% below 2000 net revenues, reflecting a tough year for the technology industry. Revenues declined across all of our geographies and major product lines as we felt the impact of the worldwide economic slowdown. Our decrease in net revenues came primarily from the Intel Architecture operating segment in the form of significantly lower unit volumes and significantly lower average selling prices of microprocessors. Lower revenues in both the Intel Communications Group and the Wireless Communications and Computing Group also contributed to the decline as demand for these products decreased significantly.
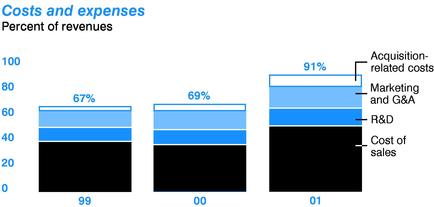
In spite of the revenue decline and the lower sales volume of microprocessors, cost of sales increased 7% in 2001 compared to 2000, primarily due to increased start-up costs and higher unit costs for microprocessors in the Intel Architecture business.
Our gross margin percentage decreased significantly, from 62% in 2000 to 49% in 2001, primarily due to lower revenues from sales of microprocessors, including the effect of lower average selling prices and the impact of spreading fixed factory costs over a lower volume. Higher factory start-up costs for the Intel Architecture business also contributed to the decline in the gross margin percentage. The impact of lower sales volume and a decline in factory capacity utilization in the Wireless Communications and Computing Group, as well as lower sales in the Intel Communications Group, also lowered the gross margin percentage. See "Outlook" for a discussion of gross margin expectations.
By contrast, from 1999 to 2000, our net revenues increased by 15%, primarily due to a higher unit sales volume of microprocessors, partially offset by lower average selling prices in the Intel Architecture business. Additionally, revenues from sales of flash memory in the Wireless Communications and Computing Group grew significantly from 1999 to 2000, as did networking and communications product sales in the Intel Communications Group.
Cost of sales increased 7% in 2000 compared to 1999, due to higher sales volume in the Wireless Communications and Computing Group and the Intel Communications Group. This increase was partially offset by lower cost of sales in the Intel Architecture business, primarily due to lower unit costs.
The gross margin percentage increased to 62% in 2000 from 60% in 1999, primarily as a result of higher gross margin in the Intel Architecture business due to lower microprocessor unit costs. These lower costs were partially offset by lower average selling prices for microprocessors and the costs recorded in 2000 related to chipsets and motherboards with a defective memory translator hub (MTH). Improved demand and higher prices for flash memory in the Wireless Communications and Computing Group also contributed to the improvement in gross margin percentage.
Intel Architecture > The Intel Architecture operating segment consists of the Desktop Platforms Group, the Mobile Platforms Group and the Enterprise Platforms Group. Net revenues for this business decreased by $5.9 billion, or 21%, in 2001 compared to 2000. The decrease in net revenues was primarily due to significantly lower unit volumes and significantly lower average selling prices of microprocessors. The lower selling prices reflect the impact of competitive pricing pressures and our strategy to accelerate the transition from the Pentium® III processor to the Pentium® 4 processor. For 2001, sales of microprocessors based on the P6 microarchitecture (including the Celeron®, Pentium III and Pentium® III Xeon™ processors), as well as related board-level products and chipsets, comprised a majority of our consolidated net revenues and a substantial majority of our gross margin. For the same period, sales of products based on the Intel® NetBurst™ microarchitecture, including the Pentium 4 and Intel® Xeon™ processors and related products, were a significant and rapidly increasing portion of our consolidated net revenues and gross margin.
Net operating results decreased by $6.3 billion, or 50%, in 2001 compared to 2000, primarily due to lower average selling prices, lower unit volumes and higher unit costs for microprocessors. Increased start-up costs related to the 0.13-micron manufacturing process technology, which ramped in four factories during 2001, and start-up costs on 300-millimeter wafer manufacturing also contributed to the decline. Lower revenue-dependent expenses and reduced spending due to company-wide cost reduction programs partially offset the decline in net operating results.
For 2000, net revenues increased by $1.8 billion, or 7%, compared to 1999. The increase in net revenues was primarily due to higher unit sales volume of microprocessors, partially offset by lower average selling prices. For 2000, sales of microprocessors based on the P6 microarchitecture, as well as related board-level products and chipsets comprised a substantial majority of our consolidated net revenues and gross margin.
Net operating results increased by $1.4 billion, or 12%, in 2000 compared to 1999, primarily due to higher sales and lower unit costs of microprocessors. The decreased unit costs were achieved primarily through the continued transition to redesigned microprocessor products with lower cost packaging as well as factory efficiencies. The lower unit costs were partially offset by higher costs due to a higher sales volume of microprocessors and the costs recorded in 2000 related to chipsets and motherboards with the defective MTH component.
In January 2002, we announced the promotion of Paul S. Otellini, who was Executive Vice President and General Manager of the Intel Architecture Group, to President and Chief Operating Officer of Intel.
Intel Communications Group > Net revenues decreased by $903 million, or 26%, in 2001 compared to 2000, primarily due to significantly lower unit volumes of embedded control chips, network processing components, enterprise infrastructure and telecommunications products, including telecommunications boards, consistent with an industry-wide reduction in demand for these products. The overall revenue decline was partially offset by incremental revenues related to acquisitions completed in 2001.
Net operating results decreased by $1.1 billion to a loss of $735 million in 2001 from a profit of $319 million in 2000, primarily due to the lower unit volumes of embedded control chips, network processing components and telecommunications-related products. Higher research and development spending in 2001 also contributed to the decline, primarily due to businesses acquired in 2001 and a full year of spending for acquisitions made in 2000.
For 2000, net revenues increased by $1.1 billion, or 46%, compared to 1999, primarily due to significantly higher unit volumes of telecommunications-related products, network processing components and optical networking equipment. The net increase in revenues includes incremental revenues related to acquisitions completed in 2000 and a full year of revenues from acquisitions completed in 1999.
Net operating results decreased by $118 million to $319 million in 2000 from $437 million in 1999, primarily due to the higher research and development spending from acquired businesses, partially offset by revenues from the higher sales volume of network processing components and telecommunications-related products.
Wireless Communications and Computing Group > Net revenues decreased by $437 million, or 16%, in 2001 compared to 2000. For the first half of 2001, the decline was primarily due to significantly lower unit sales of flash memory as the cellular market worked through inventories built up in the latter part of 2000. For the second half of 2001, the decline was primarily due to lower volumes of flash memory units brought on by the worldwide economic slowdown.
Net operating results decreased by $864 million to a loss of $256 million in 2001 from a profit of $608 million in 2000, primarily due to lower flash memory volume, the impact of decreased factory capacity utilization and higher inventory writedowns in the first half of 2001. Higher research and development spending also contributed to the decline.
By contrast, 2000 net revenues increased by $1.4 billion compared to 1999, primarily due to a significant increase in the unit sales of flash memory as worldwide demand for cellular phones increased dramatically. Average selling prices for flash memory also increased significantly as our mix shifted toward higher density products and we benefited from long-term supply agreements with customers.
Net operating results increased by $704 million to a profit of $608 million in 2000 from a loss of $96 million in 1999, primarily due to increased flash memory revenues, partially offset by increased research and development spending.
Operating expenses, other and taxes > Excluding charges of $198 million for purchased in-process research and development (IPR&D) related to the current year's acquisitions ($109 million in 2000 and $392 million in 1999), research and development spending decreased $101 million, or 3%, in 2001 compared to 2000 and increased $786 million, or 25%, in 2000 compared to 1999. The decrease for 2001 compared to 2000 was primarily due to cost containment efforts, including reductions in discretionary spending on travel-related expenses. The increase for 2000 compared to 1999 was primarily due to increased spending on product development programs, including the product development programs of companies acquired. Marketing, general and administrative expenses decreased $625 million, or 12%, in 2001 compared to 2000, primarily due to decreased revenue-dependent Intel Inside® cooperative advertising program expenses and profit-dependent bonus expenses, as well as lower discretionary spending as a result of cost reduction programs, partially offset by marketing, general and administrative expenses from companies acquired. Marketing, general and administrative expenses increased $1.2 billion, or 31%, from 1999 to 2000, primarily due to increases for the Intel Inside cooperative advertising program, profit-dependent bonus expenses, and marketing, general and administrative expenses from companies acquired.
Amortization of goodwill and other acquisition-related intangibles and costs increased to $2.3 billion in 2001 compared to $1.6 billion in 2000, primarily due to new acquisitions in 2001, a full year's impact of prior-year acquisitions and write-offs of impaired goodwill and identified intangibles of $124 million. Through 2001, in accordance with our accounting policy, we reviewed acquisition-related goodwill and identified intangibles for impairment based on undiscounted cash flows, and these analyses incorporated our estimates of future cash flows related to the acquired businesses. If the new goodwill and intangibles asset accounting standards issued by the Financial Accounting Standards Board (FASB) in July 2001 had been applied in 2001, we estimate that amortization expense would have been approximately $1.6 billion lower than the $2.3 billion reported. For 1999 to 2000, amortization increased $1.2 billion, primarily due to the impact of additional acquisitions and a full year's impact of prior year acquisitions. Amortization for all periods is included in the calculation of the operating loss for the "all other" category for segment reporting purposes.
For 2001, net losses on investments in equity securities and certain equity derivatives totaled $466 million, compared to net gains of $3.8 billion (including a significant gain on the sale of our holdings of Micron Technology, Inc.) in 2000. For 2001, the net loss included impairments of $1.1 billion, partially offset by net gains on transactions of $517 million and mark-to-market gains on trading assets and derivatives of $122 million. For 2000 compared to 1999, gains on investments increased by $2.9 billion, primarily due to sales of appreciated securities, including the Micron gain.
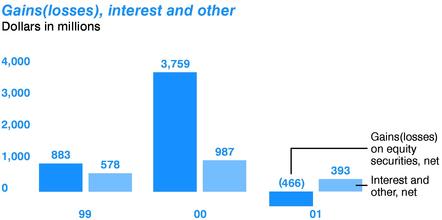
Interest and other, net decreased $594 million from 2000 to 2001. Interest income decreased due to lower average investment balances and lower interest rates in 2001 compared to 2000. In addition, we recognized a net loss of $196 million from our investment in Convera Corporation, including $39 million as our proportionate share of Convera's loss and $157 million on the impairment and subsequent sale of the investment. This compares to a gain of $117 million that we recognized on our contribution of a business in the formation of Convera in 2000. For 2000 compared to 1999, interest and other, net increased $409 million, primarily due to higher average investment balances and higher average interest rates, and the $117 million gain on Convera.
Our effective income tax rate was 40.9% in 2001, 30.4% in 2000 and 34.9% in 1999. Excluding the impact of non-deductible IPR&D charges, amortization of non-deductible goodwill, and tax benefits related to prior years of $100 million in 2001 and $600 million in 2000, our adjusted effective tax rate was 25.7% in 2001, 31.8% in 2000 and 33% in 1999. The lower adjusted rate in 2001 compared to 2000 was due to a shift in the mix of income in various tax jurisdictions. The lower adjusted rate in 2000 compared to 1999 reflected the impact of the resolution reached with the Internal Revenue Service in 2000 on a number of issues, including adjustments related to the intercompany allocation of profits.
Purchased in-process research and development
The following table summarizes the significant assumptions underlying the valuations related to IPR&D from major companies acquired at the time of acquisition in fiscal 2001, 2000 and 1999.
| (Dollars in millions) |
IPR&D |
Estimated cost to complete technology |
Discount rate applied to IPR&D |
Weighted average cost of capital |
|||||||
|---|---|---|---|---|---|---|---|---|---|---|---|
| 2001 | |||||||||||
| Xircom | $ | 53 | $ | 7 | 25—55 | % | 22 | % | |||
| VxTel | $ | 68 | $ | 14 | 25—35 | % | 22 | % | |||
| LightLogic | $ | 46 | $ | 7 | 25—35 | % | 23 | % | |||
2000 |
|||||||||||
| GIGA | $ | 52 | $ | 12 | 20 | % | 15 | % | |||
1999 |
|||||||||||
| Dialogic | $ | 83 | $ | 32 | 22 | % | 17 | % | |||
| Level One | $ | 231 | $ | 19 | 30 | % | 23 | % | |||
| DSP Communications | $ | 59 | $ | 13 | 20 | % | 17 | % | |||
Included below are further details regarding the technology acquired in these transactions.
2001 acquisitions > In March, we acquired Xircom, Inc., which specializes in PC cards and other products used to connect mobile computing devices to corporate networks and the Internet. Xircom had 20 IPR&D projects, each contributing from 1% to 24% of the total IPR&D value. The in-process projects included the development of next-generation PC card devices for portable computing connectivity that support various computing standards. These projects ranged from 5% to 86% complete. All projects had expected completion dates in 2001 at the time of acquisition. Expected completion dates for three projects comprising 30% of the total IPR&D value were revised to 2002, and nine additional projects representing 33% of the total IPR&D value were cancelled in the third quarter of 2001 in order to focus on core competencies and the next generation of current products. Xircom's remaining projects were completed as scheduled.
In April, we acquired VxTel Inc., which designs signal and packet processing silicon and system-level solutions that form the foundation for next-generation optical networks. VxTel had two IPR&D projects, with its digital signal processor project accounting for 89% of the total IPR&D value. The project was 84% complete at the time of acquisition and was completed in 2001.
In May, we acquired LightLogic, Inc., which designs advanced opto-electronic modules for next-generation optical communications systems. LightLogic had four IPR&D projects, each contributing from 8% to 52% of the total IPR&D value. These projects ranged from 40% to 80% complete and had expected completion dates in 2001 at the time of acquisition. Two projects have been completed, and the remaining two projects are expected to be completed in 2002.
2000 acquisitions > In March, we acquired GIGA A/S. GIGA specializes in the design of advanced, high-speed communications chips used in optical networking and communications products that direct traffic across the Internet and corporate networks. One project accounted for 73% of the IPR&D value and was approximately 61% complete at the time of acquisition. This project was completed on schedule in 2000.
1999 acquisitions > In July, we acquired Dialogic Corporation. Dialogic designs, manufactures and markets computer hardware and software enabling technology for computer telephony systems. Two projects accounted for 65% of the value assigned to IPR&D and were 55% to 60% complete at the time of acquisition. Dialogic's projects have been completed.
In August, we acquired Level One Communications, Inc. Level One provides silicon connectivity, switching and access solutions for high-speed telecommunications, and networking applications. Eight IPR&D projects were identified and valued, ranging from 39% to 86% complete at the time of acquisition. Level One's projects have been completed.
In November, we acquired DSP Communications, Inc. DSP Communications develops and supplies form-fit reference designs, chipsets and software for mobile telephone manufacturers. Four IPR&D projects were identified and valued, with each project representing from 9% to 31% of the total IPR&D value and ranging from 10% to 90% complete at the time of acquisition. Significant portions of three projects, representing 73% of the value assigned to IPR&D, have been cancelled, with technology development efforts refocused on next-generation standards. Projects completed represented approximately 23% of the value assigned to IPR&D.
Financial condition
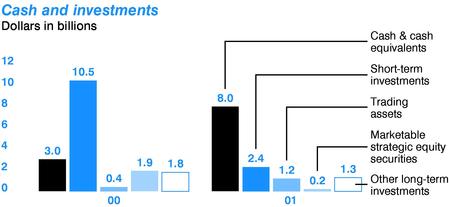
Although 2001 was a difficult year, our financial condition remained strong. At December 29, 2001, cash, short-term investments and trading assets totaled $11.6 billion, down from $13.8 billion at December 30, 2000. Total short-term and long-term debt of $1.5 billion was 4% of stockholders' equity at the end of 2001, compared to 3% of stockholders' equity at the end of 2000. At the end of 2001, we had future operating lease obligations not included on our balance sheet totaling $610 million, primarily related to facilities. In addition, at the end of 2001, we had contractual obligations of $1.9 billion for the purchase or construction of property, plant and equipment. See "Outlook" for a discussion of capital expenditure expectations for 2002.
For 2001, cash provided by operating activities was $8.7 billion, compared to $12.8 billion in 2000 and $12.1 billion in 1999. Although unit sales were down significantly in 2001, we ended the year with inventory levels approximately the same as at the end of 2000. Raw materials and finished goods inventory decreased, offset by an increase in work-in-process inventory associated with the ramp of the
Pentium 4 processor and the 0.13-micron manufacturing process technology. For 2001, accounts receivable decreased significantly, primarily due to the lower revenues, but the days' sales outstanding were unchanged from fiscal year-end 2000. For 2001, as a group, our five largest customers accounted for approximately 38% of net revenues, and of this group one customer accounted for 14% of revenues. At December 29, 2001, these five largest customers accounted for approximately 41% of net accounts receivable.
We used $195 million in net cash for investing activities during 2001, compared to $10.0 billion during 2000 and $6.2 billion during 1999. This decrease reflects net sales of available-for-sale investments and a shift to investments with shorter initial maturities that are classified as cash equivalents. Capital expenditures totaled $7.3 billion in 2001 as we continued to invest in property, plant and equipment, primarily for additional microprocessor manufacturing capacity, including 300-millimeter manufacturing capacity and the transition to the 0.13-micron manufacturing process technology. During 2001, we also paid $883 million in cash for acquisitions, net of cash acquired, including the purchases of Xircom and VxTel.
We used $3.5 billion in net cash for financing activities in 2001, compared to $3.5 billion in 2000 and $4.2 billion in 1999. The major financing applications of cash in 2001 were for the repurchase of 133 million shares of common stock for $4.0 billion and payment of dividends of $538 million. The major financing applications of cash in 2000 were for stock repurchases totaling $4.0 billion ($4.6 billion in 1999) and payments of dividends of $470 million ($366 million in 1999). Financing sources of cash during 2001 were primarily $762 million in proceeds from the sale of shares, pursuant to employee stock plans ($797 million in 2000 and $543 million in 1999).
At December 29, 2001, marketable strategic equity securities totaled $155 million, with $46 million in net unrealized appreciation. The total value of the marketable strategic equity securities decreased by $1.8 billion compared to December 30, 2000, and net unrealized appreciation decreased by approximately $246 million, primarily due to sales of securities and declines in market values. At the end of 2001, the carrying value of our non-marketable equity securities was $1.3 billion, down from $1.7 billion at the end of 2000, primarily due to the impact of impairment charges, partially offset by additional investments.
Another potential source of liquidity is authorized borrowings, including commercial paper, of $3.0 billion. We also maintain the ability to issue an aggregate of approximately $1.4 billion in debt, equity and other securities under U.S. Securities and Exchange Commission shelf registration statements.
We believe that we have the financial resources needed to meet business requirements for the next 12 months, including capital expenditures for the expansion or upgrading of worldwide manufacturing capacity, working capital requirements and the dividend program.
Financial market risks
We are exposed to financial market risks, including changes in interest rates, non-U.S. currency exchange rates and marketable equity security prices. To mitigate these risks, we utilize derivative financial instruments, among other strategies. Other than warrants and other equity derivatives that we acquired for strategic purposes, we do not use derivative financial instruments for speculative purposes. All of the potential changes noted below are based on sensitivity analyses performed on our financial positions at December 29, 2001. Actual results may differ materially.
The primary objective of our investments in debt securities is to preserve principal while maximizing yields, without significantly increasing risk. To achieve this objective, the returns on a substantial majority of our marketable investments in long-term fixed rate debt securities are swapped to U.S. dollar LIBOR-based returns. We considered the historical volatility of the three-month LIBOR rate experienced in the past year and determined that it was reasonably possible that an adverse change of 80 basis points, approximately 43% of the rate at the end of 2001, could be experienced in the near term. A hypothetical 80-basis-point increase in interest rates, after taking into account hedges and offsetting positions, would have resulted in an approximate $10 million decrease in the fair value of our investments in debt securities as of the end of 2001 and a $20 million decrease as of the end of 2000.
We generally hedge currency risks of investments denominated in non-U.S. currencies with non-U.S.-currency borrowings, currency forward contracts and currency interest rate swaps. Gains and losses on these non-U.S.-currency investments would generally be offset by corresponding losses and gains on the related hedging instruments, resulting in negligible net exposure.
A substantial majority of our revenue, expense and capital purchasing activities are transacted in U.S. dollars. However, we do enter into these transactions in other currencies, primarily Japanese yen and certain other Asian and European currencies. To protect against reductions in value and the volatility of future cash flows caused by changes in currency exchange rates, we have established revenue, expense and balance sheet hedging programs. Currency forward contracts and currency options are utilized in these hedging programs. Our hedging programs reduce, but do not always entirely eliminate, the impact of currency exchange rate movements. We considered the historical trends in currency exchange rates and determined that it was reasonably possible that adverse changes in exchange rates of 20% for certain Asian and European currencies and 10% for all other currencies could be experienced in the near term. Such an adverse change, after taking into account hedges and offsetting positions, would have resulted in an adverse impact on income before taxes of less than $6 million as of the end of 2001 and $20 million as of the end of 2000.
We have a portfolio of equity investments that includes marketable securities classified as either marketable strategic equity securities or trading assets, as well as derivative equity instruments such as warrants and options. To the extent that these investments continue to have strategic value, we typically do not attempt to reduce or eliminate our market exposure. These investments are generally in companies in the high-technology industry, and a substantial majority of the market value of the portfolio is in two sectors: communications, including networking and storage companies, and computing. As of December 29, 2001, five equity positions constituted approximately 50% of the market value of the portfolio, with no individual position exceeding 11% of the portfolio.
We analyzed the historical movements over the past several years of high-technology stock indices that we considered appropriate. Based on the analysis, we estimated that it was reasonably possible that the prices of the stocks in our portfolio could experience a 30% adverse change in the near term. Assuming a 30% adverse change in market prices, and after reflecting the impact of hedges and offsetting positions, our portfolio would decrease in value by approximately $70 million, based on the value of the portfolio as of December 29, 2001 (a decrease in value of $575 million based on the portfolio as of the end of 2000). The decrease in this hypothetical exposure from 2000 to 2001 reflects the decrease in the size of the portfolio due to sales of investments and declines in market values. The portfolio's concentrations in specific companies or sectors may vary over time and may be different from the compositions of the indices analyzed, and these factors may affect the portfolio's price volatility. This estimate is not necessarily indicative of future performance, and actual results may differ materially.
An adverse movement of equity market prices would also have an impact on our portfolio of non-marketable strategic equity securities, although the impact cannot be directly quantified. Such a movement and the related underlying economic conditions would negatively affect the prospects of the companies we invest in, their ability to raise additional capital and the likelihood of our being able to realize our investments through liquidity events such as initial public offerings, mergers and private sales. At December 29, 2001, our non-marketable strategic equity securities had a carrying amount of $1.3 billion, excluding equity derivatives that are subject to mark-to-market requirements.
Strategy
This strategy section and the following outlook section contain a number of forward-looking statements, all of which are based on current expectations. Actual results may differ materially. These statements do not reflect the potential impact of any mergers, acquisitions or business combinations that had not closed as of March 7, 2002.
Our goal is to be the preeminent building block supplier to the worldwide Internet economy by focusing on our core competencies in silicon design and manufacturing, and digital computing and communications. Our primary focus areas are the desktop and mobile platforms, the server platform, the networking and communications platform, and the handheld computing platform. The platforms are supported by our four silicon architectures for the Internet: IA-32, the Intel® Itanium™ processor family, the Intel® Internet Exchange Architecture (Intel® IXA) and the Intel® Personal Internet Client Architecture (Intel® PCA).
Intel Architecture > The Intel Architecture operating segment supports the desktop and mobile platforms with the IA-32 architecture. The IA-32 architecture includes both the Intel NetBurst and P6 microarchitectures. Our strategy for desktop and mobile platforms is to introduce ever higher performance microprocessors and chipsets, tailored for the different market segments of the worldwide computing market, using a tiered branding approach. In line with our strategy, we deliver the Pentium 4 processor for the performance and mainstream market segments, focused on both home and business applications. These applications are optimized for consumers who want to take advantage of the latest Web technologies, such as broadband, interactive 3D, and streaming video and audio. (See "Contingencies" in the "Notes to consolidated financial statements" for a discussion of patent litigation by VIA Technologies, Inc. relating to the Pentium 4 processor.) We also deliver the Intel Celeron processor for the value market segment. To further enhance the acceptance and deployment of these products, we drive initiatives that will support technologies that address wireless solutions, software enabling, security and extended battery life for mobile personal computers (PCs). We also strive to align the industry, our customers and end users to increase acceptance of the desktop and mobile platforms by working with standards bodies, trade associations, original equipment manufacturers and independent software vendors.
The Intel Architecture operating segment also supports the server platform with the Intel Xeon processor family under the IA-32 architecture for workstations and mid-range to high-end servers, and the Intel Itanium processor family for enterprise-class servers. Our strategy for the server platform is to provide higher performance processors and the best price for performance for the various server and workstation market segments. In line with this strategy, we introduced a new version of the Intel Xeon processor running at 2.0 GHz, which established benchmark records in a broad range of server workload categories. In December 2001, we began shipping pilot systems of the next-generation Itanium processor, codenamed "McKinley." (See "Contingencies" in the "Notes to consolidated financial statements" for a discussion of patent litigation by Intergraph Corporation relating to the Itanium processor.) To further increase the acceptance and deployment of these server and workstation products by our customers, we also provide e-Business solutions and best practices through our Intel® e-Business Network. In 2001, we also broadened engagements with developers and solutions providers to make it easier for end users to deploy best-of-class solutions on Intel architecture products.
We plan to cultivate new businesses as well as continue to work with the computing industry to expand Internet capabilities and product offerings, and develop compelling software applications that can take advantage of higher performance microprocessors and chipsets, thus driving demand toward our newer products in each computing market segment. Our microprocessor products compete with existing and future products in the various computing market segments, and we have experienced an increase in the competitive product offerings in the performance desktop market segment and recently in the mobile market segment. We may continue to take various steps, including reducing microprocessor prices and offering rebates and other incentives, at such times as we deem appropriate, in order to increase acceptance of our latest technology and to remain competitive within each relevant market segment.
Intel Communications Group > Within the Intel Communications Group, our strategy for the networking and communications platform is based on three focus areas that we believe are defining trends for the Internet: Ethernet connectivity products, optical components and network processing components. Our strategy for Ethernet connectivity is to expand our product portfolio within the local area network (LAN) and to address the emerging metropolitan area network (MAN) and networked storage market segments. Within the LAN, we will invest in Gigabit Ethernet technologies and wireless technologies based on the 802.11 industry standards. In the storage market segment, we are developing products that enable storage resources to be added to any location on an Ethernet network. Our strategy for optical components is to deliver equipment based on industry standards, including Ethernet and data transport standards in the telecommunications industry (SONET/SDH), focused on the MAN and wide area network (WAN) market segments. We are providing 10-Gigabit Ethernet-based optical components at multiple levels of integration with increased speed and signal transmission distance. In network processing, our strategy is to deliver products that are
the basic building blocks for modular networking infrastructure. These include advanced, programmable processors that are used to manage and direct data moving across the Internet and corporate networks.
Wireless Communications and Computing Group > Within the Wireless Communications and Computing Group, our strategy for the cellular handset and handheld computing platform is to deliver complete solutions that enable quick deployment of applications and services for wireless Internet and handheld computing devices. The Intel PCA architecture describes the separation of the communication and application building blocks for data-enabled cellular phones and portable handheld devices. By separating the communication and application elements within a device, Intel PCA allows for faster time-to-market for our customers and a standard, scalable platform for application development. Our current and expected future products for the handheld platform include flash memory, processors based on the Intel® StrongARM* processor and Intel® XScale™ microarchitecture, and cellular baseband chipsets.
The New Business Group > The New Business Group is chartered to develop and grow new businesses around our core capabilities. The group's current investments include Web hosting services, software and semiconductor products.
Outlook
The methods, estimates and judgments we use in applying our most critical accounting policies have a significant impact on the results we report in our financial statements. The U.S. Securities and Exchange Commission has defined the most critical accounting policies as the ones that are most important to the portrayal of our financial condition and results, and require us to make our most difficult and subjective judgments, often as a result of the need to make estimates of matters that are inherently uncertain. Based on this definition, our most critical policies include: valuation of non-marketable equity securities, which impacts gains (losses) on equity securities when we record impairments; valuation of inventory, which impacts cost of sales and gross margin; and the assessment of recoverability of goodwill and other intangible assets, which impacts write-offs of goodwill and intangibles. Below, we discuss these policies further, as well as the estimates and judgments involved. We also have other key accounting policies, such as our policies for revenue recognition, including the deferral of revenues on sales to distributors, and for estimating the useful lives of our manufacturing assets. We believe that these other policies either do not generally require us to make estimates and judgments that are as difficult or as subjective, or it is less likely that they would have a material impact on our reported results of operations for a given period.
In general, as we look ahead to the rest of 2002, economic indicators remain weak, and we continue to be cautious, although the steep declines we saw over the past year appear to have abated. We expect to be ready for a turn in the economy, with products, capacity and people in place, but we cannot predict when that will happen. Although it is difficult to predict product demand in 2002, we expect continued growth in the total number of computers using the Intel Pentium 4 processor based on the new Intel NetBurst microarchitecture. The flash memory business within the Wireless Communications and Computing Group remains soft due to flattening sales of cellular phones, and we continue to see weak demand from telecommunications customers in the Intel Communications Group.
Our financial results are substantially dependent on sales of microprocessors and related components by the Intel Architecture operating segment. Revenues are partly a function of the mix of microprocessor types and speeds sold, as well as the mix of related chipsets, motherboards, purchased components and other semiconductor products, all of which are difficult to forecast. Because of the wide price difference among performance desktop, value desktop, mobile and server microprocessors, the mix of types of microprocessors sold affects the average price that we will realize and has a large impact on our revenues and gross margin. Microprocessor revenues are dependent on the availability of other parts of the system platform, including chipsets, motherboards, operating system software and application software. Our expectations regarding conditions in the worldwide computing industry are dependent in part on the growth in Internet use and the expansion of Internet product offerings. Our expectations are also subject to the impact of economic conditions in various geographic regions.
Our gross margin expectation for 2002 is 51% plus or minus a few points, and 51% is two points higher than the 2001 gross margin of 49%. The gross margin percentage should benefit from revenue growth and expected cost savings as we ramp the 0.13-micron manufacturing process in 2001. Our gross margin varies, depending on unit volumes, the mix of types and speeds of processors sold, as well as the mix of microprocessors, related chipsets and motherboards, and other semiconductor and non-semiconductor products. Our policy for valuation of inventory, including the determination of obsolete or excess inventory, requires us to estimate the future demand for our products within specific time horizons, generally six months or less. The estimates of future demand that we use in the valuation of inventory are also used for near-term factory planning, and are consistent with our published revenue forecast. If our demand forecast is greater than actual demand and we fail to reduce manufacturing output accordingly, we would likely be required to record additional inventory reserves, which would have a negative impact on our gross margin. Various other factors—including unit volumes, yield issues associated with production at factories, ramp of new technologies, excess or shortage of manufacturing capacity and the reusability of factory equipment—will also continue to affect cost of sales and the variability of gross margin percentages.
We have significantly expanded our semiconductor manufacturing and assembly and test capacity over the last few years, and we continue to plan capacity based on the assumed continued success of our strategy as well as the acceptance of our products in specific market segments. However, we expect that capital spending will decrease to approximately $5.5 billion in 2002 from $7.3 billion in 2001. The reduction is primarily the result of expected improvements in capital efficiency as we transition to the larger, 300-millimeter wafer manufacturing process and the timing of manufacturing process technology cycles. If market demand does not grow and move rapidly toward higher performance products in the various market segments, revenues and gross margin may be adversely affected, manufacturing capacity could be under-utilized, and the rate of capital spending could be reduced. Revenues and gross margin may also be affected if we do not add capacity fast enough to meet market demand. This capital spending plan is dependent on expectations regarding production efficiencies and delivery times of various machinery and equipment, and construction schedules for new facilities. Depreciation for 2002 is expected to be approximately $4.6 billion, compared to $4.1 billion in 2001. Most of this increase would be included in cost of sales and research and development spending.
Our industry is characterized by very short product life cycles, and our continued success is dependent on technological advances, including the development and implementation of new processes and new strategic products for specific market segments. Because we consider it imperative to maintain a strong research and development
program, spending for research and development in 2002, excluding purchased in-process research and development, is expected to increase to approximately $4.1 billion from $3.8 billion in 2001. The higher spending is primarily for next-generation manufacturing technology, including development of 90-nanometer (0.09-micron) manufacturing process technology on 300-millimeter wafer manufacturing. We also intend to continue spending to promote our products and to increase the value of our product brands.
In March 2001, we announced that we expected to reduce our employee base by approximately 5,000 people over the remainder of 2001, primarily through attrition and a voluntary separation plan. We had exceeded this goal by the end of 2001.
We are completing the adoption of the FASB Statements of Financial Accounting Standards Nos. 141 and 142 on accounting for business combinations and goodwill as of the beginning of 2002. Accordingly, we will no longer amortize goodwill from acquisitions, but will continue to amortize other acquisition-related intangibles and costs. Consequently, we expect amortization of acquisition-related intangibles and costs to be approximately $440 million for 2002, down from $2.3 billion of amortized goodwill and acquisition-related intangibles and costs in 2001.
In conjunction with the implementation of the new accounting rules for goodwill, as of the beginning of fiscal 2002, we have completed a goodwill impairment review for the Intel Communications Group and the Wireless Communications and Computing Group, the reporting units that have substantially all of our recorded goodwill, and found no impairment. According to our accounting policy under the new rules, we will perform a similar review annually, or earlier if indicators of potential impairment exist. Our impairment review is based on a discounted cash flow approach that uses our estimates of future market share and revenues and costs for these groups as well as appropriate discount rates. The estimates we have used are consistent with the plans and estimates that we are using to manage the underlying businesses. If we fail to deliver new products for these groups, if the products fail to gain expected market acceptance, or if market conditions in the communications businesses fail to improve, our revenue and cost forecasts may not be achieved, and we may incur charges for impairment of goodwill.
During 2000 and 2001, we sold most of our portfolio of marketable strategic equity securities; however, at the end of 2001, we held $1.3 billion in non-marketable equity securities. Our ability to recover our investments in non-marketable equity securities and to earn a return on these investments is largely dependent on equity market conditions and the occurrence of liquidity events, such as initial public offerings, mergers and private sales. All of these factors are difficult to predict, particularly in the current economic environment. In addition, under our accounting policy, we are required to review all of our investments for impairment. For non-marketable equity securities, this requires significant judgment, including assessment of the investees' financial condition, the existence of subsequent rounds of financing and the impact of any relevant contractual preferences, as well as the investees' historical results of operations, and projected results and cash flows. If the actual outcomes for the investees are significantly different from our projections, our recorded impairments may be understated, and we may incur additional charges in future periods.
We currently expect our tax rate to be approximately 28.4% for 2002, excluding the impact of costs from prior and any future acquisitions. This estimate is based on current tax law, the current estimate of earnings and the expected distribution of income among various tax jurisdictions, and is subject to change.
On January 1, 2002, the national currencies of 12 European countries were replaced with the Euro. During the three-year transition period, our conversion of systems and processes was successfully completed with no material impact on our operations. The introduction of the Euro has not materially affected our currency exchange and hedging activities, and has not resulted in any material increase in costs.
We are currently a party to various legal proceedings. Although litigation is subject to inherent uncertainties, management, including internal counsel, does not believe that the ultimate outcome of these legal proceedings will have a material adverse effect on our financial position or overall trends in results of operations. However, if an unfavorable ruling were to occur in any specific period, there exists the possibility of a material adverse impact on the results of operations of that period. Management believes, given our current liquidity and cash and investment balances, that even an adverse judgment would not have a material impact on cash and investments or liquidity.
Our future results of operations and the other forward-looking statements contained in this outlook and in our strategy discussion involve a number of risks and uncertainties—in particular the statements regarding our goals and strategies, expectations regarding new product introductions, plans to cultivate new business to expand the Internet, future economic conditions, revenues, pricing, gross margin and costs, capital spending, depreciation and amortization, research and development expenses, potential impairment of investments, the tax rate and pending legal proceedings. In addition to the factors discussed above, among the other factors that could cause actual results to differ materially are the following: business and economic conditions and trends in the computing and communications industries in various geographic regions; possible disruption in commercial activities related to terrorist activity and armed conflict, such as changes in logistics and security arrangements, and reduced end-user purchases relative to expectations; the impact of events outside the United States, such as the business impact of fluctuating currency rates, unrest or political instability in a locale, such as unrest in Israel; changes in customer order patterns; competitive factors such as competing chip architectures and manufacturing technologies, competing software-compatible microprocessors and acceptance of new products in specific market segments; pricing pressures; development and timing of the introduction of compelling software applications; excess or obsolete inventory and variations in inventory valuation; continued success in technological advances, including development and implementation of new processes and strategic products for specific market segments; execution of the manufacturing ramp, including the transition to 0.13-micron manufacturing process technology; excess manufacturing capacity; the ability to sustain and grow networking, communications, wireless and other Internet-related businesses, and successfully integrate and operate any acquired businesses; unanticipated costs or other adverse effects associated with processors and other products containing errata (deviations from published specifications); and litigation involving intellectual property, stockholder and other issues.
We believe that we have the product offerings, facilities, personnel, and competitive and financial resources for continued business success, but future revenues, costs, margins and profits are all influenced by a number of factors, including those discussed above, all of which are inherently difficult to forecast.
Consolidated statements of income
| Three years ended December 29, 2001 (In millions—except per share amounts) |
2001 |
2000 |
1999 |
||||||
|---|---|---|---|---|---|---|---|---|---|
| Net revenues | $ | 26,539 | $ | 33,726 | $ | 29,389 | |||
| Cost of sales | 13,487 | 12,650 | 11,836 | ||||||
| Research and development | 3,796 | 3,897 | 3,111 | ||||||
| Marketing, general and administrative | 4,464 | 5,089 | 3,872 | ||||||
| Amortization of goodwill and other acquisition-related intangibles and costs | 2,338 | 1,586 | 411 | ||||||
| Purchased in-process research and development | 198 | 109 | 392 | ||||||
| Operating costs and expenses | 24,283 | 23,331 | 19,622 | ||||||
| Operating income | 2,256 | 10,395 | 9,767 | ||||||
| Gains (losses) on equity securities, net | (466 | ) | 3,759 | 883 | |||||
| Interest and other, net | 393 | 987 | 578 | ||||||
| Income before taxes | 2,183 | 15,141 | 11,228 | ||||||
| Provision for taxes | 892 | 4,606 | 3,914 | ||||||
| Net income | $ | 1,291 | $ | 10,535 | $ | 7,314 | |||
| Basic earnings per common share | $ | 0.19 | $ | 1.57 | $ | 1.10 | |||
| Diluted earnings per common share | $ | 0.19 | $ | 1.51 | $ | 1.05 | |||
| Weighted average common shares outstanding | 6,716 | 6,709 | 6,648 | ||||||
| Weighted average common shares outstanding, assuming dilution | 6,879 | 6,986 | 6,940 | ||||||
See accompanying notes.
Consolidated balance sheets
| December 29, 2001 and December 30, 2000 (In millions-except par value) |
2001 |
2000 |
||||||
|---|---|---|---|---|---|---|---|---|
| Assets | ||||||||
| Current assets: | ||||||||
| Cash and cash equivalents | $ | 7,970 | $ | 2,976 | ||||
| Short-term investments | 2,356 | 10,497 | ||||||
| Trading assets | 1,224 | 350 | ||||||
| Accounts receivable, net of allowance for doubtful accounts of $68 ($84 in 2000) | 2,607 | 4,129 | ||||||
| Inventories | 2,253 | 2,241 | ||||||
| Deferred tax assets | 958 | 721 | ||||||
| Other current assets | 265 | 236 | ||||||
| Total current assets | 17,633 | 21,150 | ||||||
| Property, plant and equipment: | ||||||||
| Land and buildings | 10,709 | 7,416 | ||||||
| Machinery and equipment | 21,605 | 15,994 | ||||||
| Construction in progress | 2,042 | 4,843 | ||||||
| 34,356 | 28,253 | |||||||
| Less accumulated depreciation | 16,235 | 13,240 | ||||||
| Property, plant and equipment, net | 18,121 | 15,013 | ||||||
| Marketable strategic equity securities | 155 | 1,915 | ||||||
| Other long-term investments | 1,319 | 1,797 | ||||||
| Goodwill, net | 4,330 | 4,977 | ||||||
| Acquisition-related intangibles, net | 797 | 964 | ||||||
| Other assets | 2,040 | 2,129 | ||||||
| Total assets | $ | 44,395 | $ | 47,945 | ||||
Liabilities and stockholders' equity |
||||||||
| Current liabilities: | ||||||||
| Short-term debt | $ | 409 | $ | 378 | ||||
| Accounts payable | 1,769 | 2,387 | ||||||
| Accrued compensation and benefits | 1,179 | 1,696 | ||||||
| Accrued advertising | 560 | 782 | ||||||
| Deferred income on shipments to distributors | 418 | 674 | ||||||
| Other accrued liabilities | 1,247 | 1,440 | ||||||
| Income taxes payable | 988 | 1,293 | ||||||
| Total current liabilities | 6,570 | 8,650 | ||||||
| Long-term debt | 1,050 | 707 | ||||||
| Deferred tax liabilities | 945 | 1,266 | ||||||
| Commitments and contingencies | ||||||||
| Stockholders' equity: | ||||||||
| Preferred stock, $0.001 par value, 50 shares authorized; none issued | — | — | ||||||
| Common stock, $0.001 par value, 10,000 shares authorized; 6,690 issued and outstanding (6,721 in 2000) and capital in excess of par value | 8,833 | 8,486 | ||||||
| Acquisition-related unearned stock compensation | (178 | ) | (97 | ) | ||||
| Accumulated other comprehensive income | 25 | 195 | ||||||
| Retained earnings | 27,150 | 28,738 | ||||||
| Total stockholders' equity | 35,830 | 37,322 | ||||||
| Total liabilities and stockholders' equity | $ | 44,395 | $ | 47,945 | ||||
See accompanying notes.
Consolidated statements of cash flows
| Three years ended December 29, 2001 (In millions) |
2001 |
2000 |
1999 |
||||||||||
|---|---|---|---|---|---|---|---|---|---|---|---|---|---|
| Cash and cash equivalents, beginning of year | $ | 2,976 | $ | 3,695 | $ | 2,038 | |||||||
| Cash flows provided by (used for) operating activities: | |||||||||||||
| Net income | 1,291 | 10,535 | 7,314 | ||||||||||
| Adjustments to reconcile net income to net cash provided by (used for) operating activities: | |||||||||||||
| Depreciation | 4,131 | 3,249 | 3,186 | ||||||||||
| Amortization of goodwill and other acquisition-related intangibles and costs | 2,338 | 1,586 | 411 | ||||||||||
| Purchased in-process research and development | 198 | 109 | 392 | ||||||||||
| (Gains) losses on equity investments, net | 466 | (3,759 | ) | (883 | ) | ||||||||
| (Gain) loss on investment in Convera | 196 | (117 | ) | — | |||||||||
| Net loss on retirements of property, plant and equipment | 119 | 139 | 193 | ||||||||||
| Deferred taxes | (519 | ) | (130 | ) | (219 | ) | |||||||
| Tax benefit from employee stock plans | 435 | 887 | 506 | ||||||||||
| Changes in assets and liabilities: | |||||||||||||
| Trading assets | 898 | 38 | (72 | ) | |||||||||
| Accounts receivable | 1,561 | (384 | ) | 153 | |||||||||
| Inventories | 24 | (731 | ) | 169 | |||||||||
| Accounts payable | (673 | ) | 978 | 79 | |||||||||
| Accrued compensation and benefits | (524 | ) | 231 | 127 | |||||||||
| Income taxes payable | (270 | ) | (362 | ) | 726 | ||||||||
| Other assets and liabilities | (1,017 | ) | 558 | 52 | |||||||||
| Total adjustments | 7,363 | 2,292 | 4,820 | ||||||||||
| Net cash provided by operating activities | 8,654 | 12,827 | 12,134 | ||||||||||
| Cash flows provided by (used for) investing activities: | |||||||||||||
| Additions to property, plant and equipment | (7,309 | ) | (6,674 | ) | (3,403 | ) | |||||||
| Acquisitions, net of cash acquired | (883 | ) | (2,317 | ) | (2,979 | ) | |||||||
| Purchases of available-for-sale investments | (7,141 | ) | (17,188 | ) | (7,055 | ) | |||||||
| Maturities and sales of available-for-sale investments | 15,398 | 17,124 | 7,987 | ||||||||||
| Other investing activities | (260 | ) | (980 | ) | (799 | ) | |||||||
| Net cash used for investing activities | (195 | ) | (10,035 | ) | (6,249 | ) | |||||||
| Cash flows provided by (used for) financing activities: | |||||||||||||
| Increase in short-term debt, net | 23 | 138 | 69 | ||||||||||
| Additions to long-term debt | 306 | 77 | 118 | ||||||||||
| Repayment and retirement of long-term debt | (10 | ) | (46 | ) | — | ||||||||
| Proceeds from sales of shares through employee stock plans and other | 762 | 797 | 543 | ||||||||||
| Proceeds from sales of put warrants | — | — | 20 | ||||||||||
| Repurchase and retirement of common stock | (4,008 | ) | (4,007 | ) | (4,612 | ) | |||||||
| Payment of dividends to stockholders | (538 | ) | (470 | ) | (366 | ) | |||||||
| Net cash used for financing activities | (3,465 | ) | (3,511 | ) | (4,228 | ) | |||||||
| Net increase (decrease) in cash and cash equivalents | 4,994 | (719 | ) | 1,657 | |||||||||
| Cash and cash equivalents, end of year | $ | 7,970 | $ | 2,976 | $ | 3,695 | |||||||
Supplemental disclosures of cash flow information: |
|||||||||||||
| Cash paid during the year for: | |||||||||||||
| Interest | $ | 53 | $ | 43 | $ | 40 | |||||||
| Income taxes | $ | 1,208 | $ | 4,209 | $ | 2,899 | |||||||
See accompanying notes.
Consolidated statements of stockholders' equity
| |
Common stock and capital in excess of par value |
|
|
|
|
|||||||||||||||
|---|---|---|---|---|---|---|---|---|---|---|---|---|---|---|---|---|---|---|---|---|
| |
Acquisition- related unearned stock compensation |
Accumulated other comprehensive income |
|
|
||||||||||||||||
| Three years ended December 29, 2001 (In millions—except per share amounts) |
Number of shares |
Amount |
Retained earnings |
Total |
||||||||||||||||
| Balance at December 26, 1998 | 6,631 | $ | 4,822 | $ | — | $ | 603 | $ | 17,952 | $ | 23,377 | |||||||||
Components of comprehensive income: |
||||||||||||||||||||
| Net income | — | — | — | — | 7,314 | 7,314 | ||||||||||||||
| Change in net unrealized gain on available-for-sale investments, net of tax | — | — | — | 3,188 | — | 3,188 | ||||||||||||||
| Total comprehensive income | 10,502 | |||||||||||||||||||
| Proceeds from sales of shares through employee stock plans, tax benefit of $506 and other | 112 | 1,049 | — | — | — | 1,049 | ||||||||||||||
| Proceeds from sales of put warrants | — | 20 | — | — | — | 20 | ||||||||||||||
| Reclassification of put warrant obligation, net | — | 7 | — | — | 64 | 71 | ||||||||||||||
| Repurchase and retirement of common stock | (143 | ) | (1,076 | ) | — | — | (3,536 | ) | (4,612 | ) | ||||||||||
| Issuance of common stock and assumption of stock options in connection with acquisitions | 69 | 2,494 | — | — | — | 2,494 | ||||||||||||||
| Cash dividends declared ($0.055 per share) | — | — | — | — | (366 | ) | (366 | ) | ||||||||||||
| Balance at December 25, 1999 | 6,669 | 7,316 | — | 3,791 | 21,428 | 32,535 | ||||||||||||||
| Components of comprehensive income: | ||||||||||||||||||||
| Net income | — | — | — | — | 10,535 | 10,535 | ||||||||||||||
| Change in net unrealized gain on available-for-sale investments, net of tax | — | — | — | (3,596 | ) | — | (3,596 | ) | ||||||||||||
| Total comprehensive income | 6,939 | |||||||||||||||||||
| Proceeds from sales of shares through employee stock plans, tax benefit of $887 and other | 116 | 1,687 | — | — | (3 | ) | 1,684 | |||||||||||||
| Reclassification of put warrant obligation, net | — | 35 | — | — | 95 | 130 | ||||||||||||||
| Issuance of common stock and assumption of stock options in connection with acquisitions | 3 | 401 | (123 | ) | — | — | 278 | |||||||||||||
| Amortization of acquisition-related unearned stock compensation | — | — | 26 | — | — | 26 | ||||||||||||||
| Conversion of subordinated notes | 7 | 207 | — | — | — | 207 | ||||||||||||||
| Repurchase and retirement of common stock | (74 | ) | (1,160 | ) | — | — | (2,847 | ) | (4,007 | ) | ||||||||||
| Cash dividends declared ($0.070 per share) | — | — | — | — | (470 | ) | (470 | ) | ||||||||||||
| Balance at December 30, 2000 | 6,721 | 8,486 | (97 | ) | 195 | 28,738 | 37,322 | |||||||||||||
| Components of comprehensive income: | ||||||||||||||||||||
| Net income | — | — | — | — | 1,291 | 1,291 | ||||||||||||||
| Change in net unrealized gain on available-for-sale investments, net of tax | — | — | — | (163 | ) | — | (163 | ) | ||||||||||||
| Change in net unrealized loss on derivatives, net of tax | — | — | — | (7 | ) | — | (7 | ) | ||||||||||||
| Total comprehensive income | 1,121 | |||||||||||||||||||
| Proceeds from sales of shares through employee stock plans, tax benefit of $435 and other | 81 | 1,197 | — | — | — | 1,197 | ||||||||||||||
| Issuance of common stock and aassumption of stock options in connection with acquisitions, net | 21 | 817 | (255 | ) | — | — | 562 | |||||||||||||
| Amortization of acquisition-related unearned stock compensation | — | — | 174 | — | — | 174 | ||||||||||||||
| Repurchase and retirement of common stock | (133 | ) | (1,667 | ) | — | — | (2,341 | ) | (4,008 | ) | ||||||||||
| Cash dividends declared ($0.080 per share) | — | — | — | — | (538 | ) | (538 | ) | ||||||||||||
| Balance at December 29, 2001 | 6,690 | $ | 8,833 | $ | (178 | ) | $ | 25 | $ | 27,150 | $ | 35,830 | ||||||||
See accompanying notes.
Notes to consolidated financial statements
Accounting policies
Fiscal year > Intel Corporation has a fiscal year that ends on the last Saturday in December. Fiscal year 2001, a 52-week year, ended on December 29, 2001. Fiscal year 2000 was a 53-week year that ended on December 30, while 1999, a 52-week year, ended on December 25. The next 53-week year will end on December 31, 2005.
Basis of presentation > The consolidated financial statements include the accounts of Intel and its wholly owned subsidiaries. Intercompany accounts and transactions have been eliminated. Partially owned equity affiliates are accounted for under the equity method. Accounts denominated in non-U.S. currencies have been remeasured using the U.S. dollar as the functional currency.
The preparation of financial statements in conformity with accounting principles generally accepted in the United States requires management to make estimates and judgments that affect the amounts reported in the financial statements and accompanying notes. The critical accounting policies that require management's most significant estimates and judgments include valuation of non-marketable equity securities, valuation of inventory, and the assessment of recoverability of goodwill and other intangible assets. The actual results experienced by the company may differ materially from management's estimates.
Recent accounting pronouncements > In July 2001, the Financial Accounting Standards Board (FASB) issued Statement of Financial Accounting Standards (SFAS) No. 141, "Business Combinations," and SFAS No. 142, "Goodwill and Other Intangible Assets." Beginning in the first quarter of fiscal 2002, the company will no longer amortize goodwill, but will perform impairment tests annually, or earlier if indicators of potential impairment exist. All other intangible assets continue to be amortized over their estimated useful lives. In conjunction with the implementation of SFAS No. 142, the company has completed a goodwill impairment review as of the beginning of fiscal 2002 using a fair-value based approach in accordance with provisions of that standard and found no impairment. Based on acquisitions completed as of June 30, 2001, application of the goodwill non-amortization provisions is expected to result in a decrease in amortization of approximately $1.6 billion for fiscal year 2002.
Accounting change > Effective as of the beginning of 2001, the company adopted SFAS No. 133, "Accounting for Derivative Instruments and Hedging Activities," as amended, which requires the company to recognize all derivative instruments as either assets or liabilities on the balance sheet at fair value. The accounting for gains or losses from changes in fair value of a derivative instrument depends on whether it has been designated and qualifies as part of a hedging relationship, as well as on the type of hedging relationship.
The cumulative effect of the adoption of SFAS No. 133 was an increase in income before taxes of $45 million, which is included in interest and other, net for 2001. The adoption did not have a material effect on other comprehensive income.
Cash and cash equivalents > Highly liquid debt securities with insignificant interest rate risk and with original maturities of three months or less are classified as cash and cash equivalents.
Investments > The company's investments consist of:
Trading assets. The company elects to classify as trading assets certain marketable debt and equity securities. The interest, currency and/or equity market risks inherent in these investments are generally mitigated through the use of derivative instruments. Also included in trading assets is a marketable equity portfolio held to generate returns that offset changes in liabilities related to certain deferred compensation arrangements. Trading assets are stated at fair value, with gains or losses resulting from changes in fair value recognized currently in earnings. For marketable debt securities, gains or losses from changes in fair value, offset by losses or gains on related derivatives, are included in interest and other, net. For marketable equity securities having related derivative instruments, gains or losses from changes in fair value, offset or partially offset by losses or gains on the derivatives, are included in gains (losses) on equity securities, net. For other marketable equity securities related to deferred compensation arrangements, gains or losses from changes in fair value, offset by losses or gains on the related liabilities, are included in interest and other, net.
Available-for-sale investments. Investments designated as available-for-sale include marketable debt and equity securities. Investments that are designated as available-for-sale as of the balance sheet date are reported at fair value, with unrealized gains and losses, net of tax, recorded in stockholders' equity. The cost of securities sold is based on the specific identification method. Realized gains and losses on the sale of debt securities are recorded in interest and other, net. Realized gains or losses on the sale or exchange of equity securities and declines in value judged to be other than temporary are recorded in gains (losses) on equity securities, net. Marketable equity securities are presumed to be impaired if the fair value is less than the cost basis for six months, absent compelling evidence to the contrary.
Debt securities with original maturities greater than three months and remaining maturities less than one year are classified as short-term investments. Debt securities with remaining maturities greater than one year are classified as other long-term investments.
The company acquires certain equity investments for the promotion of business and strategic objectives, and to the extent these investments continue to have strategic value, the company typically does not attempt to reduce or eliminate the inherent market risks. The marketable portion of these investments is classified separately as marketable strategic equity securities.
Non-marketable equity securities and other investments. Non-marketable equity securities and other investments are accounted for at historical cost or, if Intel has significant influence over the investee, using the equity method. The company's proportionate share of income or losses from investments accounted for under the equity method and any gain or loss on disposal is recorded in interest and other, net. Non-marketable equity securities and other investments, as well as equity-method investments, are included in other assets. Non-marketable equity securities are subject to a periodic impairment review, including assessment of the investee's financial condition, the existence of subsequent rounds of financing and the impact of any relevant contractual preferences, as well as the investee's historical results of operations, projected results and cash flows. Impairment of non-marketable equity investments is recorded in gains (losses) on equity securities, net.
Securities lending > The company, from time to time, enters into secured lending agreements with financial institutions, generally to facilitate hedging transactions. Selected securities are loaned for short periods of time and are secured by collateral in the form of cash or securities. The loaned securities continue to be carried as investment assets on the balance sheet. Cash collateral is recorded as an asset with a corresponding liability. For lending agreements collateralized by securities, the collateral is not recorded as an asset or a liability, unless the collateral is repledged (see "Short-term debt" under "Borrowings").
Fair values of financial instruments > Fair values of cash equivalents approximate cost due to the short period of time to maturity. Fair values of short-term investments, trading assets, marketable strategic equity securities, other long-term investments, certain non-marketable investments, short-term debt, long-term debt, swaps, currency forward contracts, equity options and warrants are based on quoted market prices or pricing models using current market rates. Debt securities are generally valued using discounted cash flows in an industry-standard yield-curve model based on LIBOR. Equity options and warrants are priced using a Black-Scholes option valuation model. For certain non-marketable equity securities, fair value is estimated based on prices recently paid for shares in that company. All of the estimated fair values are management's estimates; however, when there is no readily available market, the fair values may not necessarily represent the amounts that could be realized in a current transaction.
Derivative financial instruments > The company's primary objective for holding derivative financial instruments is to manage interest rate, non-U.S. currency and some equity market risks. The company's derivative instruments are recorded at fair value and are included in other current assets, other assets, other accrued liabilities or long-term debt. The company's accounting policies for these instruments are based on whether they meet the company's criteria for designation as hedging transactions, either as cash flow or fair value hedges. A hedge of the exposure to variability in the cash flows of an asset or a liability, or of a forecasted transaction, is referred to as a cash flow hedge. A hedge of the exposure to changes in fair value of an asset or a liability, or of an unrecognized firm commitment, is referred to as a fair value hedge. The criteria for designating a derivative as a hedge include the instrument's effectiveness in risk reduction and in most cases a one-to-one matching of the derivative instrument to its underlying transaction. Gains and losses on derivatives that are not designated as hedges for accounting purposes are recognized currently in earnings, and generally offset changes in the values of related assets, liabilities or debt.
As part of its strategic investment program, the company also acquires equity derivative instruments, such as warrants, that are not designated as hedging instruments. The gains or losses from changes in fair values of these equity derivatives are recognized in gains (losses) on equity securities, net.
Currency risk. The company transacts business in various non-U.S. currencies, primarily Japanese yen and certain other Asian and European currencies. The company has established revenue, expense and balance sheet risk management programs to protect against reductions in value and volatility of future cash flows caused by changes in exchange rates. The company uses currency forward contracts, currency options, borrowings in various currencies and currency interest rate swaps in these risk management programs. These programs reduce, but do not always entirely eliminate, the impact of currency exchange movements.
Currency forward contracts and currency options that are used to hedge exposures to variability in anticipated non-U.S.-dollar- denominated cash flows are designated as cash flow hedges. The maturities of these instruments are generally less than 12 months. For these derivatives, the effective portion of the gain or loss is reported as a component of other comprehensive income in stockholders' equity and is reclassified into earnings in the same period or periods in which the hedged transaction affects earnings, and within the same income statement line item. The ineffective portion of the gain or loss on the derivative in excess of the cumulative change in the present value of future cash flows of the hedged item, if any, is recognized in interest and other, net during the period of change. Prior to the adoption of SFAS No. 133, derivatives hedging the currency risk of future cash flows were not recognized on the balance sheet.
Currency interest rate swaps and currency forward contracts are used to offset the currency risk of non-U.S.-dollar-denominated debt securities classified as trading assets, as well as other assets and liabilities denominated in various currencies. Changes in fair value of the underlying assets and liabilities are generally offset by the changes in fair value of the related derivatives, with the resulting net gain or loss, if any, recorded in interest and other, net.
Interest rate risk. The company's primary objective for holding investments in debt securities is to preserve principal while maximizing yields, without significantly increasing risk. To achieve this objective, the returns on a substantial majority of the company's investments in long-term fixed-rate marketable debt securities are swapped to U.S. dollar LIBOR-based returns, using interest rate swaps and currency interest rate swaps in transactions that are not designated as hedges for accounting purposes. The floating interest rates on the swaps are reset on a monthly, quarterly or semiannual basis. Changes in fair value of the debt securities classified as trading assets are generally offset by changes in fair value of the related derivatives, resulting in negligible net impact. The net gain or loss, if any, is recorded in interest and other, net.
The company also enters into interest rate swap agreements to modify the interest characteristics of its outstanding long-term debt. These transactions are designated as fair value hedges. The gains or losses from the changes in fair value of the interest rate swaps, as well as the offsetting change in the hedged fair value of the long-term debt, are recognized in interest expense. Prior to the adoption of SFAS No. 133, interest rate swaps related to long-term debt were not recognized on the balance sheet, nor were the changes in the hedged fair value of the debt.
Equity market risk. The company may enter into transactions designated as fair value hedges using equity options, swaps or forward contracts to hedge the equity market risk of marketable securities in its portfolio of strategic equity investments once the securities are no longer considered to have strategic value. The gain or loss from the change in fair value of these equity derivatives, as well as the offsetting change in hedged fair value of the related strategic equity securities, are recognized currently in gains or losses on equity investments, net. The company also uses equity derivatives in transactions not designated as hedges to offset the change in fair value of certain equity securities classified as trading assets. The company may or may not enter into transactions to reduce or eliminate the market risks of its investments in strategic equity derivatives, including warrants. Prior to the adoption of SFAS No. 133, warrants were not considered to be derivative instruments for accounting purposes and were not marked-to-market.
Measurement of effectiveness of hedge relationships. For currency forward contracts, effectiveness of the hedge is measured using forward rates to value the forward contract and the forward value of the underlying hedged transaction. For currency options and equity options, effectiveness is measured by the change in the option's intrinsic value, which represents the change in the option's strike price compared to the spot price of the underlying hedged transaction. Not included in the assessment of effectiveness are the changes in time value of these options. For interest rate swaps, effectiveness is measured by offsetting the change in fair value of the long-term debt with the change in fair value of the interest rate swap.
Any ineffective portions of the hedge, as well as amounts not included in the assessment of effectiveness, are recognized currently in interest and other, net or in gains (losses) on equity investments, net, depending on the nature of the underlying asset or liability. If a cash flow hedge were to be discontinued because it is probable that the original hedged transaction will not occur as anticipated, the unrealized gains or losses would be reclassified into earnings. Subsequent gains or losses on the related derivative instrument would be recognized in income in each period until the instrument matures, is terminated or is sold.
During 2001, the portion of hedging instruments' gains or losses excluded from the assessment of effectiveness and the ineffective portions of hedges had no material impact on earnings for either cash flow or fair value hedges. No cash flow hedges were discontinued as a result of forecasted transactions that did not occur.
Inventories > Inventory cost is computed on a currently adjusted standard basis (which approximates actual cost on a current average or first-in, first-out basis). Work in process and finished goods inventory are determined to be saleable based on a demand forecast within a specific time horizon, generally six months or less. Inventory in excess of saleable amounts is not valued, and the remaining inventory is valued at the lower of cost or market. Inventories at fiscal year-ends were as follows:
| (In millions) |
2001 |
2000 |
||||
|---|---|---|---|---|---|---|
| Raw materials | $ | 237 | $ | 384 | ||
| Work in process | 1,316 | 1,057 | ||||
| Finished goods | 700 | 800 | ||||
| Total | $ | 2,253 | $ | 2,241 | ||
Property, plant and equipment > Property, plant and equipment are stated at cost. Depreciation is computed for financial reporting purposes principally using the straight-line method over the following estimated useful lives: machinery and equipment, 2 - 4 years; buildings, 4 - 40 years. Reviews are regularly performed to determine whether facts and circumstances exist which indicate that the useful life is shorter than originally estimated or the carrying amount of assets may not be recoverable. The company assesses the recoverability of its assets by comparing the projected undiscounted net cash flows associated with the related asset or group of assets over their remaining lives against their respective carrying amounts. Impairment, if any, is based on the excess of the carrying amount over the fair value of those assets.
Goodwill and other acquisition-related intangibles > Goodwill is recorded when the consideration paid for an acquisition exceeds the fair value of identifiable net tangible and intangible assets acquired. Through December 29, 2001, goodwill has been amortized over an estimated life of 2 - 6 years. Goodwill is presented net of accumulated amortization of $3.0 billion at December 29, 2001 and $1.6 billion at December 30, 2000. During 2001, goodwill was reduced by $125 million, primarily related to the reduction of a valuation allowance on deferred tax assets due to changes in the realizability of certain tax benefits related to companies acquired in the current and prior years.
Through fiscal 2001, goodwill and other acquisition-related intangibles were reviewed for recoverability periodically and whenever events or changes in circumstances indicated that the carrying amount may not be recoverable. The carrying amount was compared to the undiscounted cash flows of the businesses acquired, and if the review indicated that these intangibles were not recoverable, their carrying amount was reduced by the estimated shortfall of the undiscounted cash flows for goodwill and discounted cash flows for other acquisition-related intangibles. As a result of these reviews, $124 million of goodwill and acquisition-related intangibles was written off in fiscal 2001.
Acquisition-related intangibles, comprised primarily of developed technology, are amortized on a straight-line basis over periods ranging from 2-6 years. Acquisition-related intangibles are presented net of accumulated amortization of $623 million at December 29, 2001 and $389 million at December 30, 2000.
Amortization of goodwill and other acquisition-related intangibles and costs was $2.3 billion for 2001. This amount includes $1.6 billion of amortization of goodwill, $347 million of amortization of other acquisition-related intangibles (a substantial majority of which was related to developed technology) and write-offs of $124 million. In addition, the total includes $174 million of amortization of acquisition-related stock compensation costs (see "Acquisition-related unearned stock compensation") and $81 million of amortization of other acquisition-related costs.
Revenue recognition > The company recognizes net revenues when the earnings process is complete, as evidenced by an agreement with the customer, transfer of title and acceptance if applicable, fixed pricing and probable collectibility. Because of frequent sales price reductions and rapid technology obsolescence in the industry, sales made to distributors under agreements allowing price protection and/or right of return are deferred until the distributors sell the merchandise.
Advertising > Cooperative advertising obligations are accrued and the costs expensed at the same time the related revenues are recognized. All other advertising costs are expensed as incurred. Advertising expense was $1.6 billion in 2001 ($2.0 billion in 2000 and $1.7 billion in 1999).
Earnings per share > The shares used in the computation of the company's basic and diluted earnings per common share are reconciled as follows:
| (In millions) |
2001 |
2000 |
1999 |
||||
|---|---|---|---|---|---|---|---|
| Weighted average common shares outstanding | 6,716 | 6,709 | 6,648 | ||||
| Dilutive effect of: | |||||||
| Employee stock options | 163 | 272 | 289 | ||||
| Convertible notes | — | 5 | 3 | ||||
| Weighted average common shares outstanding, assuming dilution | 6,879 | 6,986 | 6,940 | ||||
Weighted average common shares outstanding, assuming dilution, includes the incremental shares that would be issued upon the assumed exercise of stock options, as well as the assumed conversion of the convertible notes, for the period the notes were outstanding. Approximately 211 million of the company's stock options were excluded from the calculation of diluted earnings per share for 2001 (34 million in 2000 and 8 million in 1999). These options were excluded because they were antidilutive, but they could be dilutive in the future.
Reclassifications > Certain amounts reported in previous years have been reclassified to conform to the 2001 presentation.
Common stock
Stock repurchase program > The company has an ongoing authorization, as amended, from the Board of Directors to repurchase up to 1.8 billion shares of Intel's common stock in open market or negotiated transactions. During 2001, the company repurchased 133 million shares of common stock at a cost of $4 billion. As of December 29, 2001, the company had repurchased and retired approximately 1.5 billion shares at a cost of $26 billion since the program began in 1990. As of December 29, 2001, 293 million shares remained available under the repurchase authorization.
Prior to 2001, the company sold put warrants that allowed the holder to sell one share of stock to the company at a specified price. During 1999, the company received premiums of $20 million. As of December 29, 2001 and December 30, 2000, no put warrants were outstanding.
Borrowings
Short-term debt > Short-term debt at fiscal year-ends was as follows:
| (In millions) |
2001 |
2000 |
||||
|---|---|---|---|---|---|---|
| Drafts payable (non-interest-bearing) | $ | 224 | $ | 368 | ||
| Floating rate obligations under securities lending agreements | 153 | — | ||||
| Other short-term debt | 18 | — | ||||
| Current portion of long-term debt | 14 | 10 | ||||
| Total | $ | 409 | $ | 378 | ||
Obligations under securities lending agreements had an average rate of 1.75% as of December 29, 2001. The company also borrows under commercial paper programs. Maximum borrowings under commercial paper programs reached $105 million during 2001 and $539 million during 2000. This debt is rated A-1+ by Standard & Poor's and P-1 by Moody's.
Long-term debt > Long-term debt at fiscal year-ends was as follows:
| (In millions) |
2001 |
2000 |
||||||
|---|---|---|---|---|---|---|---|---|
| Payable in U.S. dollars: | ||||||||
| Puerto Rico bonds adjustable 2003, due 2013 at 3.9%—4.25% | $ | 116 | $ | 110 | ||||
| Zero coupon senior exchangeable notes due 2004 | 256 | — | ||||||
| Other U.S. dollar debt | 5 | 5 | ||||||
| Payable in other currencies: | ||||||||
| Euro debt due 2001—2027 at 3.5%—13% | 687 | 602 | ||||||
| 1,064 | 717 | |||||||
| Less current portion of long-term debt | (14 | ) | (10 | ) | ||||
| Total | $ | 1,050 | $ | 707 | ||||
The company has guaranteed repayment of principal and interest on bonds issued by the Puerto Rico Industrial, Tourist, Educational, Medical and Environmental Control Facilities Financing Authority. The bonds are adjustable and redeemable at the option of either the company or the bondholder every five years through 2013 and are next adjustable and redeemable in 2003.
In April 2001, the company issued zero coupon senior exchangeable notes for net proceeds of $208 million in a private placement. The note holders have the right to exchange their Intel notes for Samsung Electronics Co., Ltd. convertible notes (Samsung notes) owned by Intel. The Intel note holders may exercise their exchange option any time prior to January 12, 2004. The exchangeable notes were issued in order to partially mitigate the equity market risk of Intel's investment in the Samsung notes, and the exchange option is accounted for as an equity derivative and marked-to-market. The carrying value of the debt instrument, excluding the portion allocated to the equity derivative, is being accreted to its principal amount of $200 million through interest expense over the period to its maturity. The Intel notes are redeemable by Intel at any time.
In September 2000, all of the company's convertible subordinated notes, with a carrying value of $207 million, were exchanged for approximately 7.4 million shares of unregistered Intel common stock.
The Euro borrowings were made in connection with the financing of manufacturing facilities in Ireland, and Intel has invested the proceeds in Euro-denominated instruments of similar maturity to hedge currency and interest rate exposures.
As of December 29, 2001, aggregate debt maturities were as follows: 2002—$14 million; 2003—$142 million; 2004—$285 million; 2005—$34 million; 2006—$36 million; and thereafter—$553 million.
Investments
Trading assets > In addition to the debt and equity investments that are offset by related derivatives, a portion of the company's trading asset portfolio consists of equity securities that are maintained to generate returns that partially offset changes in liabilities related to certain deferred compensation arrangements. The company also uses fixed income investments and derivative instruments to offset the remaining portion of the changes in the compensation liabilities. The deferred compensation liabilities were $399 million in 2001 and $392 million in 2000, and are included in other accrued liabilities on the consolidated balance sheets. Net gains (losses) on all trading assets were $7 million in 2001, $(41) million in 2000 and $44 million in 1999, and these gains and losses were offset by gains and losses on the related derivatives and liabilities.
Trading assets outstanding at fiscal year-ends were as follows:
| |
2001 |
2000 |
||||||||||
|---|---|---|---|---|---|---|---|---|---|---|---|---|
| (In millions) |
Net unrealized gains (losses) |
Estimated fair value |
Net unrealized gains (losses) |
Estimated fair value |
||||||||
| Debt instruments | $ | (15 | ) | $ | 836 | $ | — | $ | — | |||
| Equity securities | 72 | 74 | — | — | ||||||||
| Equity securities offsetting deferred compensation | 35 | 314 | (39 | ) | 350 | |||||||
| Total trading assets | $ | 92 | $ | 1,224 | $ | (39 | ) | $ | 350 | |||
Upon initial adoption of SFAS No. 133 at the beginning of 2001, approximately $1.4 billion of available-for-sale investments in marketable debt securities that had related derivative instruments were reclassified to trading assets. At the same time, the related derivatives were reclassified to other current assets, other assets or other accrued liabilities. These investments and derivatives had total associated unrealized gains of $57 million and unrealized losses of $56 million.
Available-for-sale investments > Available-for-sale investments at December 29, 2001 were as follows:
| (In millions) |
Adjusted cost |
Gross unrealized gains |
Gross unrealized losses |
Estimated fair value |
|||||||||
|---|---|---|---|---|---|---|---|---|---|---|---|---|---|
| Commercial paper | $ | 6,329 | $ | 2 | $ | — | $ | 6,331 | |||||
| Bank time deposits | 2,047 | 1 | (1 | ) | 2,047 | ||||||||
| Corporate bonds | 911 | 1 | — | 912 | |||||||||
| Loan participations | 838 | — | — | 838 | |||||||||
| Floating rate notes | 795 | 1 | — | 796 | |||||||||
| Other debt securities | 371 | — | — | 371 | |||||||||
| Marketable strategic equity securities | 109 | 48 | (2 | ) | 155 | ||||||||
| Preferred stock and other equity | 104 | — | — | 104 | |||||||||
| Total available-for-sale investments | 11,504 | 53 | (3 | ) | 11,554 | ||||||||
| Less amounts classified as cash equivalents | (7,724 | ) | — | — | (7,724 | ) | |||||||
| $ | 3,780 | $ | 53 | $ | (3 | ) | $ | 3,830 | |||||
Available-for-sale investments at December 30, 2000 were as follows:
| (In millions) |
Adjusted cost |
Gross unrealized gains |
Gross unrealized losses |
Estimated fair value |
|||||||||
|---|---|---|---|---|---|---|---|---|---|---|---|---|---|
| Commercial paper | $ | 7,182 | $ | 24 | $ | (5 | ) | $ | 7,201 | ||||
| Bank time deposits | 3,171 | 2 | — | 3,173 | |||||||||
| Floating rate notes | 2,011 | 10 | (7 | ) | 2,014 | ||||||||
| Marketable strategic equity securities | 1,623 | 756 | (464 | ) | 1,915 | ||||||||
| Corporate bonds | 1,195 | 5 | (16 | ) | 1,184 | ||||||||
| Loan participations | 903 | — | — | 903 | |||||||||
| Other debt securities | 416 | — | — | 416 | |||||||||
| Preferred stock and other equity | 109 | — | — | 109 | |||||||||
| Swaps hedging investments in debt securities | — | 24 | (12 | ) | 12 | ||||||||
| Currency forward contracts hedging investments in debt securities | — | 4 | (21 | ) | (17 | ) | |||||||
| Total available-for-sale investments | 16,610 | 825 | (525 | ) | 16,910 | ||||||||
| Less amounts classified as cash equivalents | (2,701 | ) | — | — | (2,701 | ) | |||||||
| $ | 13,909 | $ | 825 | $ | (525 | ) | $ | 14,209 | |||||
The company sold available-for-sale securities with a fair value at the date of sale of $1.3 billion in 2001, $4.2 billion in 2000 and $1.0 billion in 1999. The gross realized gains on these sales totaled $548 million in 2001, $3.4 billion in 2000 and $883 million in 1999. The company realized gross losses on sales of $187 million in 2001, $52 million in 2000 and none in 1999. The company recognized gains on shares exchanged in third-party merger transactions of $156 million in 2001 and $682 million in 2000. The company recognized impairment losses on available-for-sale and non-marketable investments of $1.1 billion in 2001 and $297 million in 2000. For 2001, the company also recognized $122 million of net marked-to-market gains on equity trading assets and equity derivatives.
The amortized cost and estimated fair value of available-for-sale investments in debt securities at December 29, 2001, by contractual maturity, were as follows:
| (In millions) |
Cost |
Estimated fair value |
||||
|---|---|---|---|---|---|---|
| Due in 1 year or less | $ | 9,990 | $ | 9,993 | ||
| Due in 1-2 years | 679 | 680 | ||||
| Due in 2-5 years | 107 | 107 | ||||
| Due after 5 years | 515 | 515 | ||||
| Total investments in available-for- sale debt securities | $ | 11,291 | $ | 11,295 | ||
Fair values of financial instruments
The estimated fair values of financial instruments outstanding at fiscal year-ends were as follows:
| |
2001 |
2000 |
|||||||||||
|---|---|---|---|---|---|---|---|---|---|---|---|---|---|
| (In millions—assets (liabilities)) |
Carrying amount |
Estimated fair value |
Carrying amount |
Estimated fair value |
|||||||||
| Cash and cash equivalents | $ | 7,970 | $ | 7,970 | $ | 2,976 | $ | 2,976 | |||||
| Short-term investments | $ | 2,356 | $ | 2,356 | $ | 10,498 | $ | 10,498 | |||||
| Trading assets | $ | 1,224 | $ | 1,224 | $ | 355 | $ | 355 | |||||
| Marketable strategic equity securities | $ | 155 | $ | 155 | $ | 1,915 | $ | 1,915 | |||||
| Other long-term investments | $ | 1,319 | $ | 1,319 | $ | 1,801 | $ | 1,801 | |||||
| Non-marketable equity securities | $ | 1,276 | $ | 1,719 | $ | 1,726 | $ | 2,912 | |||||
| Other non-marketable instruments | $ | 161 | $ | 161 | $ | 148 | $ | 148 | |||||
| Warrants and other equities marked-to-market as derivatives in 2001 | $ | 172 | $ | 172 | $ | 12 | $ | 36 | |||||
| Options hedging or offsetting equities | $ | 51 | $ | 51 | $ | — | $ | — | |||||
| Swaps related to investments in debt securities | $ | 12 | $ | 12 | $ | 12 | $ | 12 | |||||
| Options related to deferred compensation liabilities | $ | (6 | ) | $ | (6 | ) | $ | (5 | ) | $ | (5 | ) | |
| Short-term debt | $ | (409 | ) | $ | (409 | ) | $ | (378 | ) | $ | (378 | ) | |
| Long-term debt | $ | (1,050 | ) | $ | (1,045 | ) | $ | (707 | ) | $ | (702 | ) | |
| Swaps hedging debt | $ | 4 | $ | 4 | $ | — | $ | (1 | ) | ||||
| Currency forward contracts | $ | 1 | $ | 1 | $ | 2 | $ | 6 | |||||
Due to restrictions on sales extending beyond one year, publicly traded securities with a carrying value of $85 million and an estimated fair value of $210 million were classified as non-marketable equity securities at December 29, 2001. At December 30, 2000, similarly restricted securities had a carrying amount of $109 million and an estimated fair value of $631 million.
Concentrations of credit risk
Financial instruments that potentially subject the company to concentrations of credit risk consist principally of investments in debt securities, derivative financial instruments and trade receivables. Intel places its investments with high-credit-quality counterparties and, by policy, limits the amount of credit exposure to any one counterparty based on Intel's analysis of that counterparty's relative credit standing. Investments in debt securities with maturities of greater than six months consist primarily of A and A2 or better rated financial instruments and counterparties. Investments with maturities of up to six months consist primarily of A-1 and P-1 or better rated financial instruments and counterparties. Government regulations
imposed on investment alternatives of non-U.S. subsidiaries, or the absence of A and A2 rated counterparties in certain countries, result in some minor exceptions. Credit rating criteria for derivative instruments are similar to those for investments. The amounts subject to credit risk related to derivative instruments are generally limited to the amounts, if any, by which a counterparty's obligations exceed the obligations of Intel with that counterparty. At December 29, 2001, debt investments were placed with approximately 180 different counterparties. Intel's practice is to obtain and secure available collateral from counterparties against obligations, including securities lending transactions, whenever Intel deems appropriate.
A majority of the company's trade receivables are derived from sales to manufacturers of computer systems, with the remainder spread across various other industries. The company's five largest customers accounted for approximately 38% of net revenues for 2001. At December 29, 2001, these customers accounted for approximately 41% of net accounts receivable.
The company endeavors to keep pace with the evolving computer and communications industries, and has adopted credit policies and standards intended to accommodate industry growth and inherent risk. Management believes that credit risks are moderated by the diversity of its end customers and geographic sales areas. Intel performs ongoing credit evaluations of its customers' financial condition and requires collateral as deemed necessary.
Interest and other, net
| (In millions) |
2001 |
2000 |
1999 |
|||||||
|---|---|---|---|---|---|---|---|---|---|---|
| Interest income | $ | 615 | $ | 920 | $ | 618 | ||||
| Interest expense | (56 | ) | (35 | ) | (36 | ) | ||||
| Gain (loss) on investment in Convera | (196 | ) | 117 | — | ||||||
| Other, net | 30 | (15 | ) | (4 | ) | |||||
| Total | $ | 393 | $ | 987 | $ | 578 | ||||
In December 2000, Intel contributed its Interactive Media Services division to Convera Corporation and invested $150 million in cash in exchange for 14.9 million voting and 12.2 million non-voting shares of Convera. Intel recognized a gain of $117 million on the portion of the business and related assets contributed to Convera in which Intel did not retain an ownership interest. During 2001, Intel recorded a loss of approximately $39 million as its proportionate share of Convera's loss and recognized a combined net loss of $157 million on the impairment and subsequent sale of the remaining investment.
Comprehensive income
The components of other comprehensive income and related tax effects were as follows:
| (In millions) |
2001 |
2000 |
1999 |
|||||||
|---|---|---|---|---|---|---|---|---|---|---|
| Change in net unrealized gain on investments, net of tax of $187, $620 and $(2,026) in 2001, 2000 and 1999, respectively | $ | (347 | ) | $ | (1,153 | ) | $ | 3,762 | ||
Less: adjustment for net gain or loss realized and included in net income, net of tax of $(99), $1,316 and $309 in 2001, 2000 and 1999, respectively |
184 |
(2,443 |
) |
(574 |
) |
|||||
Change in net unrealized loss on derivatives, net of tax of $4 in 2001 |
(7 |
) |
— |
— |
||||||
| Other comprehensive income | $ | (170 | ) | $ | (3,596 | ) | $ | 3,188 | ||
The components of accumulated other comprehensive income, net of tax, were as follows:
| (In millions) |
2001 |
2000 |
||||
|---|---|---|---|---|---|---|
| Accumulated net unrealized gain on available-for-sale investments | $ | 32 | $ | 195 | ||
| Accumulated net unrealized loss on derivatives | (7 | ) | — | |||
| Total accumulated other comprehensive income | $ | 25 | $ | 195 | ||
Provision for taxes
Income before taxes and the provision for taxes consisted of the following:
| (In millions) |
2001 |
2000 |
1999 |
||||||||
|---|---|---|---|---|---|---|---|---|---|---|---|
| Income (loss) before taxes: | |||||||||||
| U.S. | $ | (350 | ) | $ | 11,162 | $ | 7,239 | ||||
| Non-U.S. | 2,533 | 3,979 | 3,989 | ||||||||
| Total income before taxes | $ | 2,183 | $ | 15,141 | $ | 11,228 | |||||
| Provision for taxes: | |||||||||||
| Federal: | |||||||||||
| Current | $ | 903 | $ | 3,809 | $ | 3,356 | |||||
| Deferred | (417 | ) | (65 | ) | (162 | ) | |||||
| 486 | 3,744 | 3,194 | |||||||||
| State: | |||||||||||
| Current | 142 | 454 | 393 | ||||||||
| Non-U.S.: | |||||||||||
| Current | 366 | 473 | 384 | ||||||||
| Deferred | (102 | ) | (65 | ) | (57 | ) | |||||
| 264 | 408 | 327 | |||||||||
| Total provision for taxes | $ | 892 | $ | 4,606 | $ | 3,914 | |||||
| Effective tax rate | 40.9 | % | 30.4 | % | 34.9 | % | |||||
The tax benefit associated with dispositions from employee stock plans reduced taxes currently payable for 2001 by $435 million ($887 million for 2000 and $506 million for 1999).
The provision for taxes reconciles to the amount computed by applying the statutory federal rate of 35% to income before taxes as follows:
| (In millions) |
2001 |
2000 |
1999 |
|||||||
|---|---|---|---|---|---|---|---|---|---|---|
| Computed expected tax | $ | 764 | $ | 5,299 | $ | 3,930 | ||||
| State taxes, net of federal benefits | 92 | 295 | 255 | |||||||
| Non-U.S. income taxed at different rates | (336 | ) | (363 | ) | (239 | ) | ||||
| Non-deductible acquisition-related costs | 667 | 444 | 274 | |||||||
| Export sales benefit | (245 | ) | (230 | ) | (170 | ) | ||||
| Reversal of previously accrued taxes | — | (600 | ) | — | ||||||
| Other | (50 | ) | (239 | ) | (136 | ) | ||||
| Provision for taxes | $ | 892 | $ | 4,606 | $ | 3,914 | ||||
Deferred income taxes reflect the net tax effects of temporary differences between the carrying amount of assets and liabilities for financial reporting purposes and the amounts used for income tax purposes.
Significant components of the company's deferred tax assets and liabilities at fiscal year-ends were as follows:
| (In millions) |
2001 |
2000 |
|||||
|---|---|---|---|---|---|---|---|
| Deferred tax assets | |||||||
| Accrued compensation and benefits | $ | 120 | $ | 87 | |||
| Accrued advertising | 102 | 88 | |||||
| Deferred income | 207 | 307 | |||||
| Inventory valuation and related reserves | 209 | 120 | |||||
| Interest and taxes | 89 | 52 | |||||
| Other, net | 231 | 67 | |||||
| 958 | 721 | ||||||
Deferred tax liabilities |
|||||||
| Depreciation | (461 | ) | (721 | ) | |||
| Acquired intangibles | (280 | ) | (309 | ) | |||
| Unremitted earnings of certain subsidiaries | (164 | ) | (131 | ) | |||
| Unrealized gains on investments | (30 | ) | (105 | ) | |||
| Other, net | (10 | ) | — | ||||
| (945 | ) | (1,266 | ) | ||||
| Net deferred tax asset (liability) | $ | 13 | $ | (545 | ) | ||
U.S. income taxes were not provided for on a cumulative total of approximately $5.5 billion of undistributed earnings for certain non-U.S. subsidiaries. The company intends to reinvest these earnings indefinitely in operations outside the United States.
The company reduced its tax provision for 2001 by $100 million, or approximately $0.015 per share, due to an increase in the calculated tax benefit related to export sales for 2000, including the impact of a revision in the tax law. This change in estimated taxes was reflected in the federal tax return for 2000 filed in September 2001.
In March 2000, the Internal Revenue Service (IRS) closed its examination of the company's tax returns for years up to and including 1998. Resolution was reached on a number of issues, including adjustments related to the intercompany allocation of profits. As part of this closure, the company reversed previously accrued taxes, reducing the tax provision for the first quarter of 2000 by $600 million, or approximately $0.09 per share.
Years after 1998 are open to examination by the IRS. Management believes that adequate amounts of tax and related interest and penalties, if any, have been provided for any adjustments that may result for these years.
Employee benefit plans
Stock option plans > The company has a stock option plan under which officers, key employees and non-employee directors may be granted options to purchase shares of the company's authorized but unissued common stock. The company also has a broad-based stock option plan under which stock options may be granted to all employees other than officers and directors. During 2001, the Board of Directors approved an increase to the authorized shares under this plan, which made an additional 900 million shares available for grant to employees other than officers and directors. As of December 29, 2001, substantially all of our employees were participating in one of the stock option plans. The company's Executive Long-Term Stock Option Plan, under which certain key employees, including officers, were granted stock options, terminated in 1998. No further grants may be made under this plan, although options granted prior to the termination may remain outstanding. Under all of the plans, the option exercise price is equal to the fair market value of Intel common stock at the date of grant. Intel has also assumed the stock option plans and the outstanding options of certain acquired companies. No additional stock grants will be granted under these assumed plans.
Options granted by Intel currently expire no later than 10 years from the grant date and generally vest within 5 years. Additional information with respect to stock option plan activity is as follows:
| |
|
Outstanding options |
|||||
|---|---|---|---|---|---|---|---|
| (Shares in millions) |
Shares available for options |
Number of shares |
Weighted average exercise price |
||||
| December 26, 1998 | 534.4 | 625.0 | $ | 9.07 | |||
| Grants | (81.2 | ) | 81.2 | $ | 31.96 | ||
| Options assumed in acquisitions | — | 25.6 | $ | 12.87 | |||
| Exercises | — | (96.0 | ) | $ | 3.32 | ||
| Cancellations | 24.6 | (24.6 | ) | $ | 16.43 | ||
| December 25, 1999 | 477.8 | 611.2 | $ | 12.87 | |||
| Grants | (162.8 | ) | 162.8 | $ | 54.68 | ||
| Options assumed in acquisitions | — | 4.3 | $ | 5.21 | |||
| Exercises | — | (107.5 | ) | $ | 4.66 | ||
| Cancellations | 32.6 | (32.6 | ) | $ | 26.28 | ||
| December 30, 2000 | 347.6 | 638.2 | $ | 24.16 | |||
| Supplemental grant | (51.9 | ) | 51.9 | $ | 25.69 | ||
| 2002 merit grant | (67.6 | ) | 67.6 | $ | 24.37 | ||
| Other grants | (118.6 | ) | 118.6 | $ | 25.48 | ||
| Options assumed in acquisitions | — | 9.0 | $ | 19.25 | |||
| Exercises | — | (68.0 | ) | $ | 6.06 | ||
| Cancellations | 45.1 | (48.8 | ) | $ | 35.01 | ||
| Additional shares reserved | 900.0 | — | — | ||||
| December 29, 2001 | 1,054.6 | 768.5 | $ | 25.33 | |||
| Options exercisable at: | |||||||
| December 25, 1999 | 206.4 | $ | 4.71 | ||||
| December 30, 2000 | 195.6 | $ | 7.07 | ||||
| December 29, 2001 | 230.9 | $ | 11.27 | ||||
In March 2001, a supplemental stock grant was given to employees who had been previously granted options with an exercise price above $30 per share. These additional grants were made in order to retain employees due to competitive market conditions and a decline in the company's stock price. The 2001 supplemental grants vest ratably over a two-year period from the date of grant.
In October 2001, the company granted merit-based options that would have been granted in 2002 in order to enhance the potential long-term retention value of these stock options. The company intends to reduce merit grants in 2002 by the shares in this early grant program. The 2002 merit grant vests in 2007, on about the same date it would vest if granted in 2002.
The range of option exercise prices for options outstanding at December 29, 2001 was $0.01 to $87.90. The range of exercise prices for options is wide, primarily due to the impact of assumed options of acquired companies that had experienced significant price fluctuations.
The following tables summarize information about options outstanding at December 29, 2001:
| |
Outstanding options |
||||||
|---|---|---|---|---|---|---|---|
| Range of exercise prices |
Number of shares (in millions) |
Weighted average contractual life (in years) |
Weighted average exercise price |
||||
| $0.01-$17.40 | 187.3 | 3.2 | $ | 6.32 | |||
| $17.42-$24.20 | 155.9 | 6.0 | $ | 18.86 | |||
| $24.23-$30.66 | 216.5 | 9.3 | $ | 24.98 | |||
| $30.70-$87.90 | 208.8 | 8.1 | $ | 47.57 | |||
| Total | 768.5 | 6.8 | $ | 25.33 | |||
| |
Exercisable options |
||||
|---|---|---|---|---|---|
| Range of exercise prices |
Number of shares (in millions) |
Weighted average exercise price |
|||
| $0.01-$17.40 | 174.0 | $ | 5.97 | ||
| $17.42-$24.20 | 35.5 | $ | 18.75 | ||
| $24.23-$30.66 | 4.6 | $ | 26.98 | ||
| $30.70-$87.90 | 16.8 | $ | 46.10 | ||
| Total | 230.9 | $ | 11.27 | ||
These options will expire if not exercised at specific dates through December 2011. Option exercise prices for options exercised during the three-year period ended December 29, 2001 ranged from $0.01 to $49.81.
Stock Participation Plan > Under this plan, eligible employees may purchase shares of Intel's common stock at 85% of fair market value at specific, predetermined dates. Approximately 67,000 of our 83,400 employees were participating in the plan as of December 29, 2001. Of the 944 million shares authorized to be issued under the plan, 126.7 million shares remained available for issuance at December 29, 2001. Employees purchased 13.0 million shares in 2001 (8.9 million in 2000 and 10.9 million in 1999) for $351 million ($305 million in 2000 and $241 million in 1999).
Pro forma information > The company has elected to follow APB Opinion No. 25, "Accounting for Stock Issued to Employees," in accounting for its employee stock options because, as discussed below, the alternative fair value accounting provided for under SFAS No. 123, "Accounting for Stock-Based Compensation," requires the use of option valuation models that were not developed for use in valuing employee stock options. Under APB No. 25, because the exercise price of the company's employee stock options equals the market price of the underlying stock on the date of grant, no compensation expense is recognized in the company's financial statements.
Pro forma information is required by SFAS No. 123 as if the company had accounted for its employee stock options (including shares issued under the Stock Participation Plan, collectively called "options") granted subsequent to December 31, 1994 under the fair value method of that statement. The fair value of options granted in 2001, 2000 and 1999 reported below was estimated at the date of grant using a Black-Scholes option-pricing model with the following weighted average assumptions:
| Employee stock options |
2001 |
2000 |
1999 |
||||
|---|---|---|---|---|---|---|---|
| Expected life (in years) | 6.0 | 6.5 | 6.5 | ||||
| Risk-free interest rate | 4.9 | % | 6.2 | % | 5.2 | % | |
| Volatility | .47 | .42 | .38 | ||||
| Dividend yield | .3 | % | .1 | % | .2 | % |
| Stock Participation Plan shares |
2001 |
2000 |
1999 |
||||
|---|---|---|---|---|---|---|---|
| Expected life (in years) | .5 | .5 | .5 | ||||
| Risk-free interest rate | 4.1 | % | 6.1 | % | 4.9 | % | |
| Volatility | .54 | .66 | .45 | ||||
| Dividend yield | .3 | % | .1 | % | .2 | % |
The Black-Scholes option valuation model was developed for use in estimating the fair value of traded options that have no vesting restrictions and are fully transferable. In addition, option valuation models require the input of highly subjective assumptions, including the expected stock price volatility. Because the company's employee stock options have characteristics significantly different from those of traded options, and because changes in the subjective input assumptions can materially affect the fair value estimate, in the opinion of management, the existing models do not necessarily provide a reliable single measure of the fair value of employee stock options. The weighted average estimated fair value of employee stock options granted during 2001 was $12.62 ($28.27 in 2000 and $14.77 in 1999). The weighted average estimated fair value of shares granted under the Stock Participation Plan during 2001 was $8.97 ($19.60 in 2000 and $9.90 in 1999).
For purposes of pro forma disclosures, the estimated fair value of the options is amortized to expense over the options' vesting periods. The company's pro forma information follows:
| (In millions—except per share amounts) |
2001 |
2000 |
1999 |
||||||
|---|---|---|---|---|---|---|---|---|---|
| Net income | $ | 254 | $ | 9,699 | $ | 6,860 | |||
| Basic earnings per share | $ | .04 | $ | 1.45 | $ | 1.03 | |||
| Diluted earnings per share | $ | .04 | $ | 1.40 | $ | .99 | |||
Retirement plans > The company provides tax-qualified profit-sharing retirement plans (the "Qualified Plans") for the benefit of eligible employees, former employees and retirees in the U.S. and Puerto Rico and certain other countries. The plans are designed to provide employees with an accumulation of funds for retirement on a tax-deferred basis and provide for annual discretionary employer contributions to trust funds.
The company also provides a non-qualified profit-sharing retirement plan (the "Non-Qualified Plan") for the benefit of eligible employees in the U.S. This plan is designed to permit certain discretionary employer contributions and to permit employee deferral of a portion of salaries in excess of certain tax limits and deferral of bonuses. This plan is unfunded.
The company expensed $190 million for the Qualified Plans and the Non-Qualified Plan in 2001 ($362 million in 2000 and $294 million in 1999). The company expects to fund approximately $250 million for the 2001 contribution to the Qualified Plans and to allocate approximately $10 million for the Non-Qualified Plan, including the utilization of amounts expensed in prior years. A remaining accrual of approximately $47 million carried forward from prior years is expected to be contributed to these plans in future years.
Contributions made by the company vest based on the employee's years of service. Vesting begins after three years of service in 20% annual increments until the employee is 100% vested after seven years.
The company provides tax-qualified defined-benefit pension plans for the benefit of eligible employees and retirees in the U.S. and Puerto Rico. Each plan provides for minimum pension benefits that are determined by a participant's years of service, final average compensation (taking into account the participant's social security wage base) and the value of the company's contributions, plus earnings, in the Qualified Plan. If the participant's balance in the Qualified Plan exceeds the pension guarantee, the participant will receive benefits from the Qualified Plan only. Intel's funding policy is consistent with the funding requirements of federal laws and regulations. The company also provides defined-benefit pension plans in certain other countries. The company's funding policy for non-U.S. defined-benefit pension plans is consistent with the local requirements in each country.
The company provides certain postretirement benefits for retired employees in the U.S. Upon retirement, eligible employees are credited with a defined dollar amount based on years of service. These credits can be used to pay all or a portion of the cost to purchase coverage in an Intel-sponsored medical plan.
The defined-benefit pension plans and the postretirement benefits had no material impact on the company's financial statements for the periods presented. The related unrecognized actuarial gains or losses and unrecognized prior service costs were not material to the company's balance sheet at December 29, 2001 or December 30, 2000.
Acquisitions
All of the company's acquisitions have been accounted for using the purchase method of accounting. Consideration includes the cash paid and the value of any stock issued and options assumed, less any cash acquired, and excludes contingent employee compensation payable in cash and any debt assumed. As of July 2000, the company began to account for the intrinsic value of stock options assumed related to future services as unearned compensation within stockholders' equity (see "Acquisition-related unearned stock compensation").
2001 > In March 2001, the company acquired Xircom, Inc. for total consideration of $517 million, including net cash paid and options assumed. Xircom is a supplier of PC cards and other products used to connect mobile computing devices to corporate networks and the Internet.
In April 2001, the company acquired VxTel Inc. In addition to the $381 million of consideration paid upon acquisition, payment of approximately $110 million is contingent upon the continued employment of certain employees. VxTel is a semiconductor company that has developed Voice over Packet (VoP) products that deliver high-quality voice and data communications over next-generation optical networks.
In April 2001, the company acquired Cognet, Inc. in exchange for cash and 3.6 million unregistered shares of Intel common stock, of which approximately 1.4 million shares are contingent upon the continued employment of the founding stockholders. An additional 900,000 registered shares are issuable to certain employees contingent upon meeting certain performance criteria and are not included in purchase consideration. In addition to the total common stock and cash consideration of $156 million, payment of approximately $60 million in cash compensation is contingent upon continued employment of certain employees and meeting certain performance criteria. Cognet is a developer of components that process electrical signals within optical modules after those signals have been converted from light waves. Cognet has developed electronic components for use in 10-Gigabit Ethernet modules.
In May 2001, the company acquired LightLogic, Inc. in exchange for 14.2 million shares of Intel common stock. Approximately 1.9 million of these shares are contingent upon the continued employment of certain employees. LightLogic develops highly integrated opto-electronic components and subsystems for high-speed fiber-optic telecommunications equipment.
2000 > In March 2000, the company acquired GIGA A/S. GIGA specializes in the design of advanced high-speed communications chips used in optical networking and communications products that direct traffic across the Internet and corporate networks.
In May 2000, the company acquired Basis Communications Corporation. Basis designs and markets advanced semiconductors and other products used in equipment that directs traffic across the Internet and corporate networks.
In August 2000, the company acquired Trillium Digital Systems, Inc. in exchange for 2.6 million unregistered shares of Intel common stock, cash and options assumed, of which approximately 1.2 million shares are contingent upon the continued employment of certain employees. Trillium is a provider of communications software solutions used by suppliers of wireless, Internet, broadband and telephony products.
In October 2000, the company acquired Ziatech Corporation. Ziatech designs and markets a full range of Intel® architecture-based circuit boards, hardware platforms and development systems.
1999 > In July 1999, the company acquired Dialogic Corporation to expand Intel's standard high-volume server business in the networking and telecommunications market segments. Dialogic designs, manufactures and markets computer hardware and software enabling technology for computer telephony systems.
In August 1999, the company acquired Level One Communications, Inc. Approximately 69 million shares of Intel common stock were issued in connection with the purchase. In addition, Intel assumed Level One's convertible debt with a fair value of approximately $212 million at acquisition. This debt has since been converted to Intel common stock. Level One provides silicon connectivity solutions for high-speed telecommunications and networking applications.
In September 1999, the company acquired NetBoost Corporation. NetBoost develops and markets hardware and software solutions for communications equipment suppliers and independent software vendors in the networking and communications market segments.
In October 1999, the company acquired IPivot, Inc. IPivot designs and manufactures Internet commerce equipment that manages large volumes of Internet traffic securely and efficiently.
In November 1999, the company acquired DSP Communications, Inc., which supplies solutions for digital cellular communications products, including chipsets, reference designs, software and other key technologies for lightweight wireless handsets. (See "Contingencies" for a discussion of class-action litigation relating to Intel's acquisition of DSP Communications.)
These purchase transactions are further described below:
| (In millions) |
Consideration |
Purchased in-process research & development |
Goodwill |
Identified intangibles |
Form of consideration |
|||||||||
|---|---|---|---|---|---|---|---|---|---|---|---|---|---|---|
| 2001 | ||||||||||||||
| Xircom | $ | 517 | $ | 53 | $ | 320 | $ | 176 | Cash and options assumed | |||||
| VxTel | $ | 381 | $ | 68 | $ | 277 | $ | — | Cash and options assumed | |||||
| Cognet | $ | 156 | $ | 9 | $ | 93 | $ | 20 | Cash, common stock and options assumed | |||||
| LightLogic | $ | 409 | $ | 46 | $ | 295 | $ | 9 | Common stock and options assumed | |||||
2000 |
||||||||||||||
| GIGA | $ | 1,247 | $ | 52 | $ | 1,040 | $ | 139 | Cash | |||||
| Basis | $ | 453 | $ | 21 | $ | 349 | $ | 123 | Cash and options assumed | |||||
| Trillium | $ | 277 | $ | 8 | $ | 125 | $ | 104 | Common stock, cash and options assumed | |||||
| Ziatech | $ | 222 | $ | 18 | $ | 147 | $ | 38 | Cash and options assumed | |||||
1999 |
||||||||||||||
| Dialogic | $ | 732 | $ | 83 | $ | 403 | $ | 211 | Cash and options assumed | |||||
| Level One | $ | 2,137 | $ | 231 | $ | 1,626 | $ | 373 | Common stock and options assumed | |||||
| NetBoost | $ | 215 | $ | 10 | $ | 201 | $ | — | Cash and options assumed | |||||
| IPivot | $ | 496 | $ | — | $ | 479 | $ | 21 | Cash and options assumed | |||||
| DSP | $ | 1,599 | $ | 59 | $ | 1,259 | $ | 200 | Cash and options assumed | |||||
In addition to the transactions described above, Intel purchased other businesses in seven smaller transactions in 2001 (thirteen in 2000 and seven in 1999). The 2001 transactions were in exchange for total consideration of $228 million, $73 million in cash and $147 million representing 3.2 million unregistered shares of Intel common stock. Of these shares, 1.9 million shares are contingent upon the continued employment of certain employees. The remaining consideration of $8 million related to the value of assumed options. A total of $153 million was allocated to goodwill for these transactions in 2001, while $71 million was allocated to deferred stock compensation and $22 million to purchased in-process research and development (IPR&D). Consideration for the smaller transactions in 2000 was $513 million, with $477 million allocated to goodwill, $5 million to intangibles and $10 million to IPR&D. In 1999, consideration for these transactions was $468 million, with $363 million allocated to goodwill, $44 million to intangibles and $9 million to IPR&D.
For 2001, $198 million was allocated to IPR&D and expensed upon acquisition of the above companies ($109 million for 2000 and $392 million for 1999), because the technological feasibility of products under development had not been established and no future alternative uses existed. The fair value of the IPR&D was determined using the income approach, which discounts expected future cash flows from projects under development to their net present value. Each project was analyzed to determine the technological innovations included; the utilization of core technology; the complexity, cost and time to complete development; any alternative future use or current technological feasibility; and the stage of completion. Future cash flows were estimated, taking into account the expected life cycles of the products and the underlying technology, relevant market sizes and industry trends. For 2001, the company adopted the recommendations of an accounting industry task force, and determined a discount rate for each project based on the relative risks inherent in the project's development horizon, the estimated costs of development, and the level of technological change in the project and the industry, among other factors. This change in methodology did not have a material impact on the valuation of the IPR&D. Intel believes that the amounts determined for IPR&D, as well as developed technology, are representative of fair value and do not exceed the amounts an independent party would pay for these projects.
The consolidated financial statements include the operating results of acquired businesses from the dates of acquisition. The operating results of all of the significant companies acquired have been included in the Intel Communications Group operating segment, except for the results of DSP Communications, which have been included in the Wireless Communications and Computing Group operating segment.
The unaudited pro forma information below assumes that companies acquired in 2001 and 2000 had been acquired at the beginning of 2000, and includes the effect of amortization of goodwill and other identified intangibles from that date. The impact of charges for IPR&D has been excluded. This is presented for informational purposes only and is not necessarily indicative of the results of future operations or results that would have been achieved had the acquisitions taken place at the beginning of 2000.
| (In millions, except per share amounts-unaudited) |
2001 |
2000 |
||||
|---|---|---|---|---|---|---|
| Net revenues | $ | 26,616 | $ | 34,320 | ||
| Net income | $ | 1,368 | $ | 9,982 | ||
| Basic earnings per common share | $ | .20 | $ | 1.48 | ||
| Diluted earnings per common share | $ | .20 | $ | 1.42 | ||
Acquisition-related unearned stock compensation
During 2001, the company recorded acquisition-related purchase consideration of $255 million ($123 million in 2000) as unearned stock-based compensation, in accordance with FASB Interpretation No. 44, "Accounting for Certain Transactions Involving Stock Compensation." This amount represents the portion of the purchase consideration related to shares issued contingent upon the continued employment of certain employee stockholders, and in some cases on the completion of certain milestones. The unearned stock-based compensation also includes the intrinsic value of stock options assumed that is earned as the employees provide future services. The compensation is being recognized over the period earned, and the expense is included in the amortization of goodwill and other acquisition-related intangibles and costs. A total of $174 million of expense was recognized for 2001, and $26 million for 2000.
MTH reserve
During 2000, the company announced that it would replace motherboards that had a defective memory translator hub (MTH) component with the Intel® 820 Chipset. The company took a charge with a total impact on gross margin of approximately $253 million. As of December 30, 2000, the remaining balance was approximately $54 million, and as of December 29, 2001, no material balance remained.
Commitments
The company leases a portion of its capital equipment and certain of its facilities under operating leases that expire at various dates through 2026. Rental expense was $182 million in 2001, $123 million in 2000 and $71 million in 1999. Minimum rental commitments under all non-cancelable leases with an initial term in excess of one year are payable as follows: 2002—$110 million; 2003—$91 million; 2004—$70 million; 2005—$61 million; 2006—$60 million; 2007 and beyond—$218 million. Commitments for construction or purchase of property, plant and equipment approximated $1.9 billion at December 29, 2001.
Contingencies
In November 1997, Intergraph Corporation filed suit in Federal District Court in Alabama, generally alleging that Intel attempted to coerce Intergraph into relinquishing certain patent rights. The suit alleges that Intel infringes five Intergraph microprocessor-related patents and includes alleged violations of antitrust laws and various state law claims. The suit seeks injunctive relief, damages and prejudgment interest, and further alleges that Intel's infringement is willful and that any damages awarded should be trebled. Intergraph's expert witness has claimed that Intergraph is entitled to damages of approximately $2.2 billion for Intel's alleged patent infringement and approximately $350 million for alleged state law violations, plus prejudgment interest. Intel has counterclaimed, alleging infringement of seven Intel patents, breach of contract and misappropriation of trade secrets. In March 2000, the District Court granted Intel's motion for summary judgment on Intergraph's federal antitrust claims, and in June 2001, the United States Court of Appeals for the Federal Circuit sustained the District Court's ruling. Intergraph's patent and state law claims remain at issue in the trial court. The company disputes the plaintiff's claims and intends to defend the lawsuit vigorously.
In August 2001, Intergraph filed a second suit in the U.S. District Court for the Eastern District of Texas, alleging that the Intel® Itanium™ processor infringes two Intergraph microprocessor-related patents, and seeking an injunction and unspecified damages. Intergraph has withdrawn its request for damages and, consequently, Intergraph's sole requested remedy is an injunction that would prohibit Intel from making, using or selling Itanium processors. If granted, such an injunction would significantly limit Intel's ability to succeed in the enterprise server market segment for 64-bit processors. The Texas suit is currently scheduled for trial before Judge Ward, sitting without a jury, in July 2002. The company disputes the plaintiff's claims and intends to defend the lawsuit vigorously.
On May 1, 2000, various plaintiffs filed a class-action lawsuit in the United States District Court for the Northern District of California, alleging violations of the Securities Exchange Act of 1934 and U.S. Securities and Exchange Commission Rule 14d-10 in connection with Intel's acquisition of DSP Communications. The complaint alleges that Intel and CWC (Intel's wholly owned subsidiary at the time) agreed to pay certain DSP Communications insiders additional consideration of $15.6 million not offered or paid to other stockholders. The alleged purpose of this payment to the insiders was to obtain DSP Communications insiders' endorsement of Intel's tender offer in violation of the anti-discrimination provision of Section 14(d)(7) and Rule 14d-10. The plaintiffs are seeking unspecified damages for the class, and unspecified costs and expenses. The suit is currently scheduled for trial in July 2002; however, the presiding judge has retired and the case has been reassigned. The company disputes the plaintiffs' claims and intends to defend the lawsuit vigorously.
On September 10, 2001, VIA Technologies, Inc. and Centaur Technology, Inc. sued Intel in the United States District Court for the Western District of Texas, alleging that the Intel® Pentium® 4 processor infringes a VIA Technologies microprocessor-related patent. The suit seeks injunctive relief and damages in an unspecified amount. The company disputes the plaintiffs' claims and intends to defend the lawsuit vigorously.
In September, October and November 2001, various plaintiffs filed lawsuits against Intel alleging violations of the Securities Exchange Act of 1934. The five class-action complaints allege that purchasers of Intel stock between July 19, 2000 and September 29, 2000 were misled by false and misleading statements by Intel and certain of its officers and directors concerning the company's business and financial condition. In addition, stockholder derivative complaints have been filed in California Superior Court and Delaware Chancery Court against the company's directors and certain officers, alleging that they have mismanaged the company and otherwise breached their fiduciary obligations to the company. All complaints seek unspecified damages. The company disputes the plaintiffs' claims and intends to defend the lawsuits vigorously.
The company is currently party to various legal proceedings, including those noted above. While management, including internal counsel, currently believes that the ultimate outcome of these proceedings, individually and in the aggregate, will not have a material adverse effect on the company's financial position or overall trends in results of operations, litigation is subject to inherent uncertainties. Were an unfavorable ruling to occur, there exists the possibility of a material adverse impact on the net income of the period in which the ruling occurs.
Intel has been named to the California and U.S. Superfund lists for three of its sites and has completed, along with two other companies, a Remedial Investigation/Feasibility study with the U.S.
Environmental Protection Agency (EPA) to evaluate the groundwater in areas adjacent to one of its former sites. The EPA has issued a Record of Decision with respect to a groundwater cleanup plan at that site, including expected costs to complete. Under the California and U.S. Superfund statutes, liability for cleanup of this site and the adjacent area is joint and several. The company, however, has reached agreement with those same two companies which significantly limits the company's liabilities under the proposed cleanup plan. Also, the company has completed extensive studies at its other sites and is engaged in cleanup at several of these sites. In the opinion of management, including internal counsel, the potential losses to the company in excess of amounts already accrued arising out of these matters would not have a material adverse effect on the company's financial position or overall trends in results of operations, even if joint and several liability were to be assessed.
The estimate of the potential impact on the company's financial position or overall results of operations for the above legal proceedings could change in the future.
Operating segment and geographic information
Intel designs, develops, manufactures and markets computing and communications products at various levels of integration. The company is organized into four product-line operating segments: the Intel Architecture business, which is comprised of the Desktop Platforms Group, the Mobile Platforms Group and the Enterprise Platforms Group; the Intel Communications Group; the Wireless Communications and Computing Group; and the New Business Group. Intel is reporting three operating segments for 2001. The New Business Group is not a reportable segment under the segment reporting standard, SFAS No. 131.
For the periods presented, the Chief Operating Decision Maker (CODM), as defined by SFAS No. 131, was the Chief Executive Officer (CEO), who is Craig R. Barrett. The CODM allocates resources to and assesses the performance of each operating segment using information about their revenues and operating profits before interest and taxes. In January 2002, the company announced the promotion of Paul S. Otellini, who was Executive Vice President and General Manager of the Intel Architecture Group, to President and Chief Operating Officer (COO) of Intel. Beginning in 2002, the company's Executive Office will consist of both the CEO and COO, who will have joint responsibility as the CODM.
The Intel Architecture operating segment's products include microprocessors and related board-level products and chipsets based on the P6 microarchitecture (including the Intel® Pentium® III, Celeron® and Pentium® III Xeon™ processors), as well as the Pentium 4 and Intel® Xeon™ processors based on the new Intel® NetBurst™ microarchitecture. Sales of microprocessors and related products based on the P6 microarchitecture comprised a majority of the company's 2001 revenues and a substantial majority of the company's 2001 gross margin. For the same period, sales of products based on the Intel NetBurst microarchitecture, including Pentium 4 and Intel Xeon processors and related products, were a significant and rapidly increasing portion of our consolidated net revenues and gross margin. For 2000, sales of microprocessors and related products based on the P6 microarchitecture comprised a substantial majority of our consolidated net revenues and gross margin. The Intel Communications Group's products include Ethernet connectivity products, network processing components, modular network infrastructure components and embedded microcontrollers. The Wireless Communications and Computing Group's products include flash memory, application processors and cellular baseband chipsets for cellular handsets and handheld devices. The New Business Group provides e-Business data center services. Intel's products in all operating segments are sold directly to original equipment manufacturers, and through retail and industrial distributors, resellers and e-Business channels throughout the world.
In addition to these operating segments, the company has sales and marketing, manufacturing, finance and administration groups. Expenses of these groups are allocated to the operating segments and are included in the operating results reported below.
The "all other" category includes acquisition-related costs, including amortization of goodwill and identified intangibles, in-process research and development, and write-offs of acquisition-related goodwill and intangibles, as well as the revenues and earnings or losses of the New Business Group. In addition, certain corporate-level operating expenses (primarily the amount by which profit-dependent bonus expenses differ from a targeted level recorded by the operating segments) are not allocated to operating segments and are included in "all other" in the reconciliation of operating profits reported below. Prior to 2001, the majority of the profit-dependent bonus expenses were reported at the corporate level. For 2001, a higher percentage of these expenses has been allocated to the operating segments. Information for prior periods has been restated to conform to the 2001 presentation.
Intel does not identify or allocate assets by operating segment, and does not allocate depreciation as such to the operating segments, nor does the CODM evaluate operating segments on these criteria. Operating segments do not record intersegment revenues, and, accordingly, there are none to be reported. Intel does not allocate interest and other income, interest expense or taxes to operating segments. The accounting policies for segment reporting are the same as for the company as a whole (see "Accounting policies").
Information on reportable segments for the three years ended December 29, 2001 is as follows:
| (In millions) |
2001 |
2000 |
1999 |
|||||||
|---|---|---|---|---|---|---|---|---|---|---|
| Intel Architecture Business | ||||||||||
| Revenues | $ | 21,446 | $ | 27,301 | $ | 25,459 | ||||
| Operating profit | $ | 6,252 | $ | 12,511 | $ | 11,131 | ||||
Intel Communications Group |
||||||||||
| Revenues | $ | 2,580 | $ | 3,483 | $ | 2,380 | ||||
| Operating profit (loss) | $ | (735 | ) | $ | 319 | $ | 437 | |||
Wireless Communications and Computing Group |
||||||||||
| Revenues | $ | 2,232 | $ | 2,669 | $ | 1,264 | ||||
| Operating profit (loss) | $ | (256 | ) | $ | 608 | $ | (96 | ) | ||
All other |
||||||||||
| Revenues | $ | 281 | $ | 273 | $ | 286 | ||||
| Operating loss | $ | (3,005 | ) | $ | (3,043 | ) | $ | (1,705 | ) | |
Total |
||||||||||
| Revenues | $ | 26,539 | $ | 33,726 | $ | 29,389 | ||||
| Operating profit | $ | 2,256 | $ | 10,395 | $ | 9,767 | ||||
In 2001, one customer accounted for approximately 14% of the company's revenues. In both 2000 and 1999, two customers each accounted for 13% of the company's revenues. A substantial majority of the sales to these customers were Intel Architecture products.
Geographic revenue information for the three years ended December 29, 2001 is based on the location of the selling entity. Property, plant and equipment information is based on the physical location of the assets at the end of each of the fiscal years.
Revenues from unaffiliated customers by geographic region were as follows:
| (In millions) |
2001 |
2000 |
1999 |
||||||
|---|---|---|---|---|---|---|---|---|---|
| United States | $ | 9,382 | $ | 13,912 | $ | 12,740 | |||
| Asia-Pacific | 8,308 | 8,674 | 6,704 | ||||||
| Europe | 6,500 | 8,066 | 7,798 | ||||||
| Japan | 2,349 | 3,074 | 2,147 | ||||||
| Total revenues | $ | 26,539 | $ | 33,726 | $ | 29,389 | |||
Net property, plant and equipment by country was as follows:
| (In millions) |
2001 |
2000 |
||||
|---|---|---|---|---|---|---|
| United States | $ | 14,484 | $ | 11,108 | ||
| Ireland | 1,436 | 1,545 | ||||
| Other countries | 2,201 | 2,360 | ||||
| Total property, plant and equipment, net | $ | 18,121 | $ | 15,013 | ||
Supplemental information (unaudited)
Quarterly information for the two years ended December 29, 2001 is presented in "Financial information by quarter (unaudited)" on page 37.
Report of Ernst & Young LLP, independent auditors
The Board of Directors and Stockholders, Intel Corporation
We have audited the accompanying consolidated balance sheets of Intel Corporation as of December 29, 2001 and December 30, 2000, and the related consolidated statements of income, stockholders' equity, and cash flows for each of the three years in the period ended December 29, 2001. These financial statements are the responsibility of the company's management. Our responsibility is to express an opinion on these financial statements based on our audits.
We conducted our audits in accordance with auditing standards generally accepted in the United States. Those standards require that we plan and perform the audit to obtain reasonable assurance about whether the financial statements are free of material misstatement. An audit includes examining, on a test basis, evidence supporting the amounts and disclosures in the financial statements. An audit also includes assessing the accounting principles used and significant estimates made by management, as well as evaluating the overall financial statement presentation. We believe that our audits provide a reasonable basis for our opinion.
In our opinion, the consolidated financial statements referred to above present fairly, in all material respects, the consolidated financial position of Intel Corporation at December 29, 2001 and December 30, 2000, and the consolidated results of its operations and its cash flows for each of the three years in the period ended December 29, 2001, in conformity with accounting principles generally accepted in the United States.
/s/ Ernst & Young LLP
San
Jose, California
January 14, 2002
Financial information by quarter (unaudited)
| (In millions-except per share amounts) 2001 for quarter ended |
December 29 |
September 29 |
June 30 |
March 31 |
|||||||||
|---|---|---|---|---|---|---|---|---|---|---|---|---|---|
| Net revenues | $ | 6,983 | $ | 6,545 | $ | 6,334 | $ | 6,677 | |||||
| Cost of sales | $ | 3,402 | $ | 3,553 | $ | 3,307 | $ | 3,225 | |||||
| Amortization of goodwill and other acquisition-related intangibles and costs | $ | 550 | $ | 609 | $ | 594 | $ | 585 | |||||
| Purchased in-process research and development | $ | — | $ | — | 123 | 75 | |||||||
| Net income | 504 | 106 | 196 | 485 | |||||||||
| Basic earnings per share | $ | .08 | $ | .02 | $ | .03 | $ | .07 | |||||
| Diluted earnings per share | $ | .07 | $ | .02 | $ | .03 | $ | .07 | |||||
| Dividends per share | |||||||||||||
| Declared | $ | — | $ | .040 | $ | — | $ | .040 | |||||
| Paid | $ | .020 | $ | .020 | $ | .020 | $ | .020 | |||||
| Market price range common stock † | |||||||||||||
| High | $ | 34.61 | $ | 32.11 | $ | 32.49 | $ | 37.81 | |||||
| Low | $ | 19.54 | $ | 19.30 | $ | 22.63 | $ | 24.63 | |||||
| (In millions-except per share amounts) 2000 for quarter ended |
December 30 |
September 30 |
July 1 |
April 1 |
|||||||||
|---|---|---|---|---|---|---|---|---|---|---|---|---|---|
| Net revenues | $ | 8,702 | $ | 8,731 | $ | 8,300 | $ | 7,993 | |||||
| Cost of sales | $ | 3,230 | $ | 3,148 | $ | 3,283 | $ | 2,989 | |||||
| Amortization of goodwill and other acquisition-related intangibles and costs | $ | 459 | $ | 420 | $ | 394 | $ | 313 | |||||
| Purchased in-process research and development | $ | 18 | $ | 8 | $ | 21 | $ | 62 | |||||
| Net income | $ | 2,193 | $ | 2,509 | $ | 3,137 | $ | 2,696 | |||||
| Basic earnings per share | $ | .33 | $ | .37 | $ | .47 | $ | .40 | |||||
| Diluted earnings per share | $ | .32 | $ | .36 | $ | .45 | $ | .39 | |||||
| Dividends per share | |||||||||||||
| Declared | $ | — | $ | .020 | $ | .020 | $ | .030 | |||||
| Paid | $ | .020 | $ | .020 | $ | .015 | $ | .015 | |||||
| Market price range common stock † | |||||||||||||
| High | $ | 46.69 | $ | 74.88 | $ | 69.50 | $ | 72.03 | |||||
| Low | $ | 30.06 | $ | 41.56 | $ | 53.03 | $ | 39.38 | |||||