Exhibit 99.1

| Exhibit 99.1
|
INVESTOR MEETING
FEBRUARY 2017
|
|
Brian Krzanich
Chief Executive Officer
|
|
Disclosures
This presentation contains non-GAAP financial measures relating to our performance. You can find the reconciliation of these measures to the most directly comparable GAAP financial measure in the Appendix at the end of this presentation. The non-GAAP financial measures disclosed by Intel should not be considered a substitute for, or superior to, the financial measures prepared in accordance with GAAP. Please refer to “Explanation of Non-GAAP Measures” in Intel’s quarterly earnings release for a detailed explanation of the adjustments made to the comparable GAAP measures, the ways management uses the non-GAAP measures, and the reasons why management believes the non-GAAP measures provide investors with useful supplemental information.
Statements in this presentation that refer to Business Outlook, forecast, future plans and expectations are forward-looking statements that involve a number of risks and uncertainties. Words such as “anticipates,” “expects,” “intends,”
“goals,” “plans,” “believes,” “seeks,” “estimates,” “continues,” “may,” “will,” “would,” “should,” “could,” and variations of such words and similar expressions are intended to identify such forward-looking statements. Statements that refer to or are based on projections, uncertain events or assumptions also identify forward-looking statements. Such statements are based on management’s expectations as of February 9, 2017 and involve many risks and uncertainties that could cause actual results to differ materially from those expressed or implied in these forward-looking statements. Important factors that could cause actual results to differ materially from the company’s expectations are set in Intel’s earnings release dated January 26, 2017, which is included as an exhibit to Intel’s Form 8-K furnished to the SEC on such date. Additional information regarding these and other factors that could affect Intel’s results is included in Intel’s SEC filings, including the company’s most recent reports on Forms 10-K and 10-Q. Copies of Intel’s Form 10-K, 10-Q and 8-K reports may be obtained by visiting our Investor Relations website at www.intc.com or the SEC’s website at www.sec.gov.
3
|
|
Agenda
2016 Results
DATA: Driving Growth & Innovation
Intel’s Strategy
4
|
|
Agenda
2016 Results
DATA: DRIVING GROWTH & INNOVATION
INTEL’S STRATEGY
5
|
|
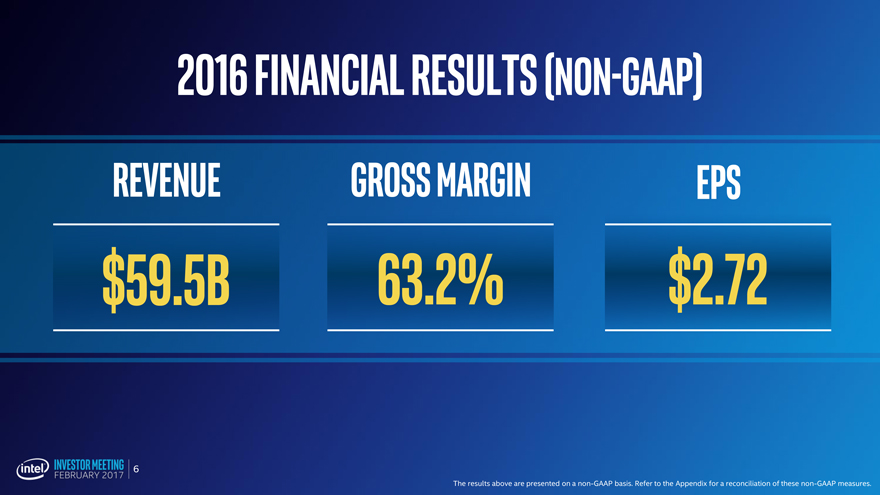
2016 Financial Results (non-gaap)
revenue gross margin EPS
$59.5B 63.2% $2.72
The results above are presented on a non-GAAP basis. Refer to the Appendix for a reconciliation of these non-GAAP measures.
6
|
|
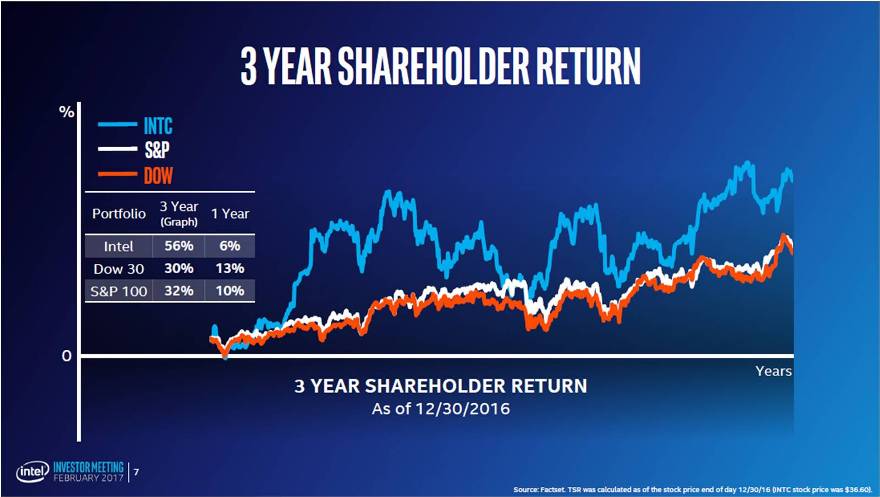
3 YEAR SHAREHOLDER RETURN % INT C S&P DOW Portfolio 3 Year1 Year (Graph) Intel 56%6% Dow 30 30%13%
S&P 100 32%10% 0 Years 3 YEAR SHAREHOLDER RETURN As of 12/30/2016 Source: Factset. TSR was calculated as of the stock price end of day 12/30/16 (INTC stock price was $36.60).
7
|
|
CCG BANNER YEAR IN CLIENT
8
|
|
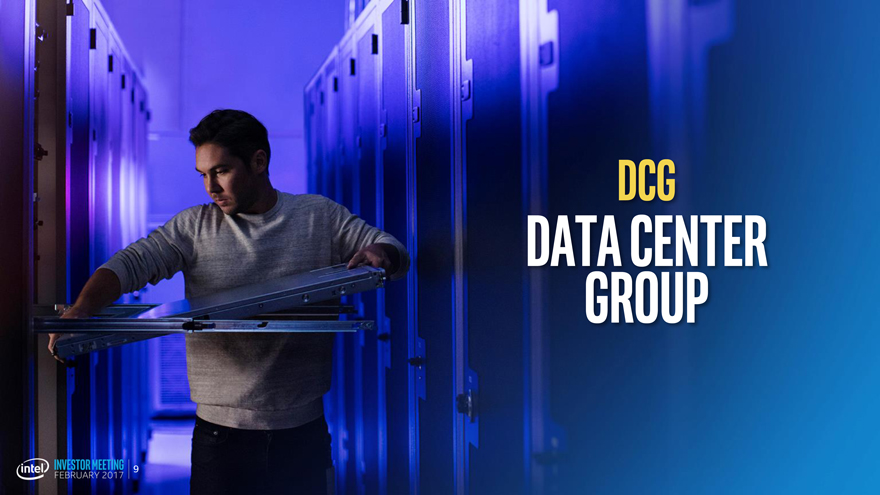
DCG DATA CENTER GROUP
9
|
|
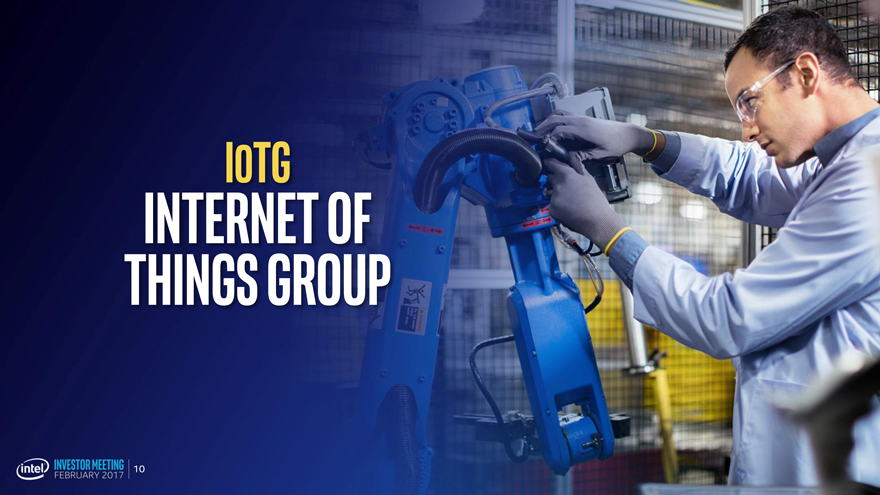
IOTG INTERNET OF THINGS GROUP
10
|
|
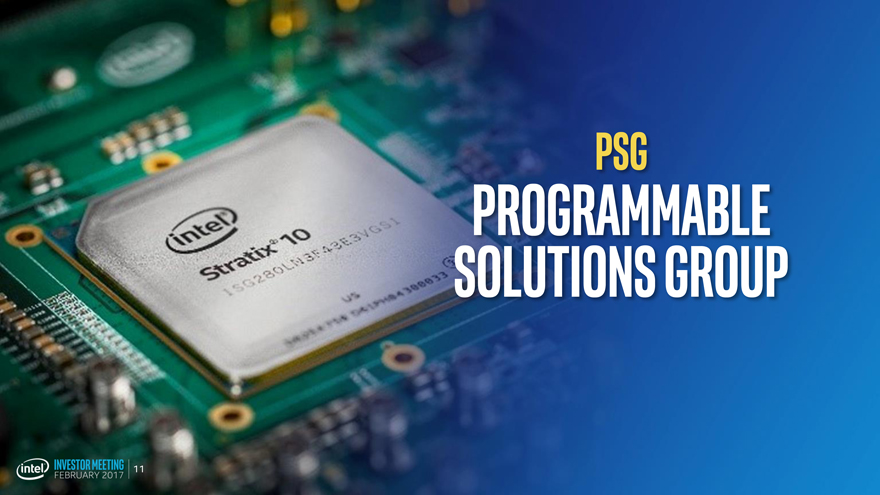
PSG PROGRAMMABLE SOLUTIONS GROUP
11
|
|
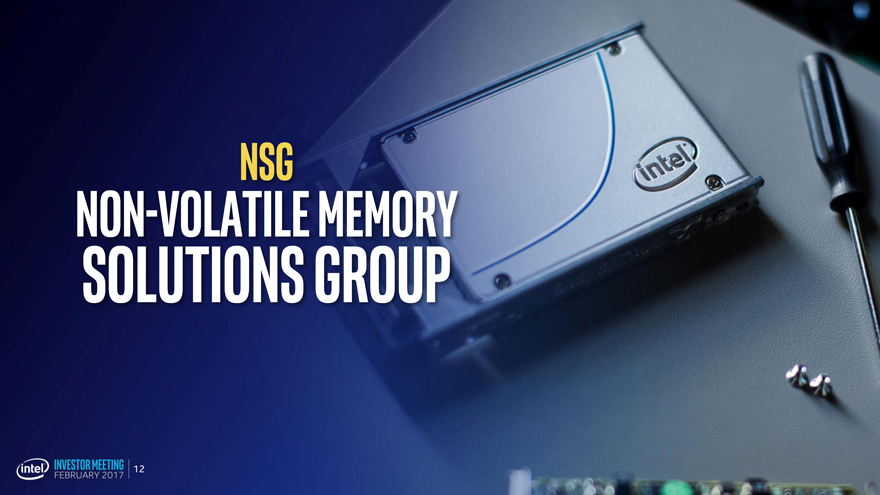
VSG Non-Volatile Memory Solutions Group
12
|
|
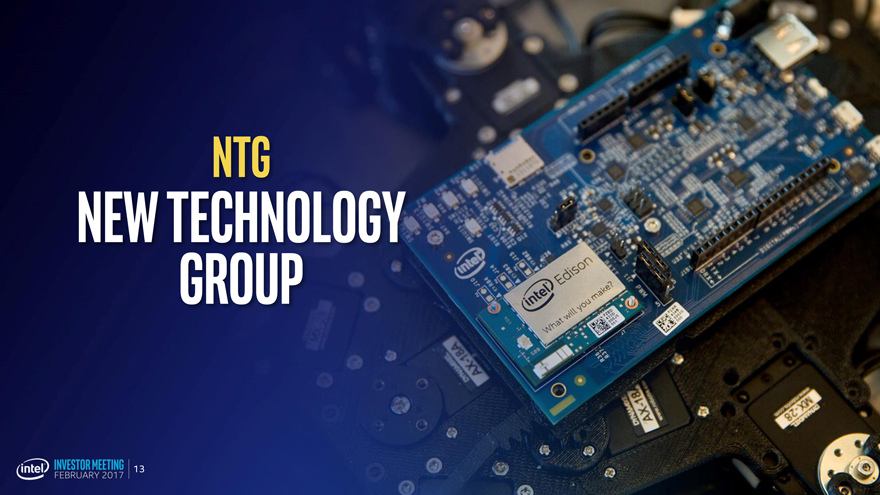
NTG
New Technology Group
13
|
|
2016: A Year of Transformation Executive leadership changes Restructuring and Reinvestment focusing our salesforce
14
|
|
Agenda 2016 RESULTS DATA: Driving Growth & Innovation INTEL’S STRATEGY
15
|
|
Data:
Driving Growth and Innovation
16
|
|
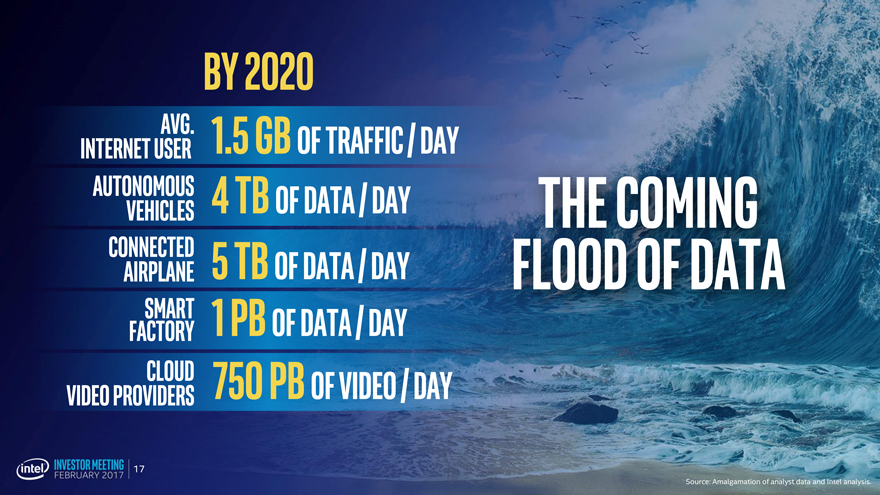
By 2020 internet userAvg. 1.5 GB of traffic / Day Autonomousvehicles 4 TB of data / Day CONNECTED AIRPLANE 5 TBof data / Day FactorySmart 1 PBof Data / Day video ProvidersCloud 750 pB of video / Day The Coming Flood of Data
17
|
|
We are a Data Company
18
|
|
Agenda 2016 RESULTS DATA: DRIVING GROWTH & INNOVATION Intel’s Strategy
19
|
|
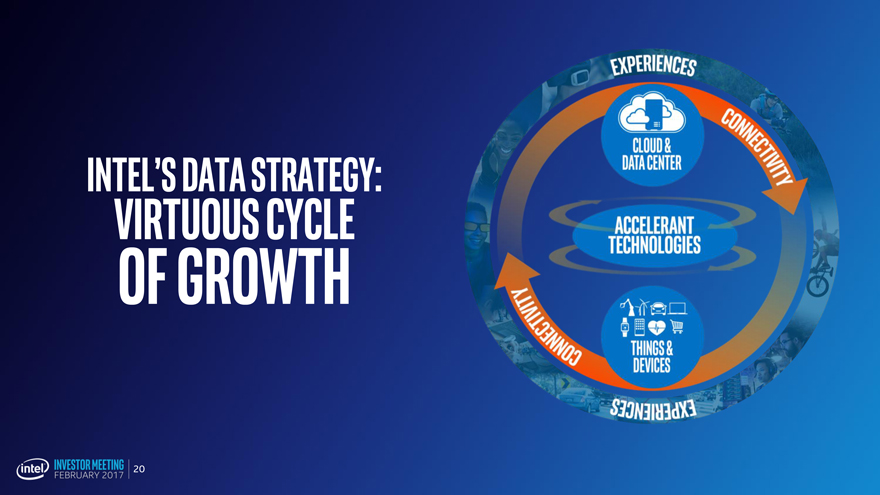
Intel’s Data Strategy: Virtuous Cycle of Growth
20
|
|
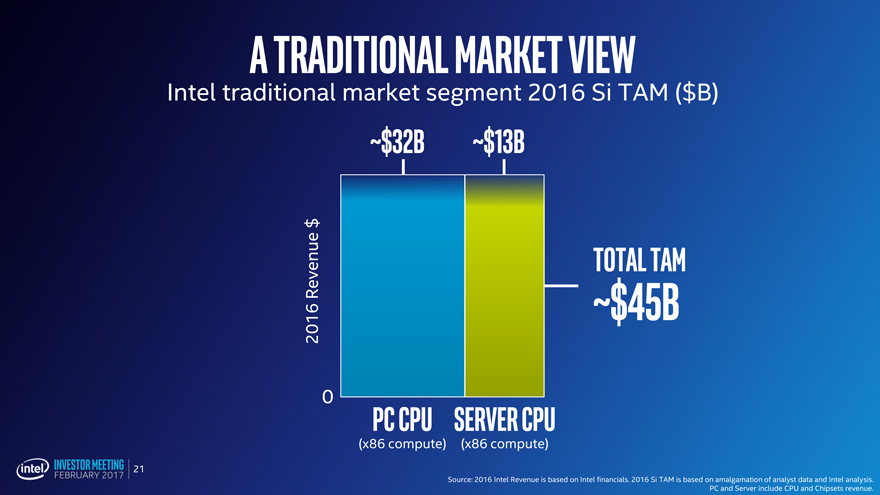
A traditional market view Intel traditional market segment 2016 Si TAM ($B) ~$32B~$13B $ Revenue Total Tam 2016 ~$45B
0 PC CPUServer CPU (x86 compute)(x86 compute) Source: 2016 Intel Revenue is based on Intel financials. 2016 Si TAM is based on amalgamation of analyst data and Intel analysis. PC and Server include CPU and Chipsets revenue.
21
|
|
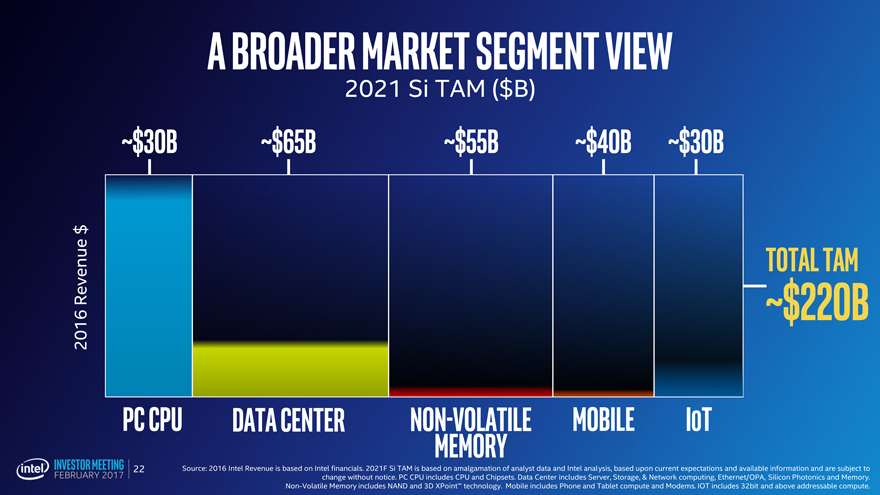
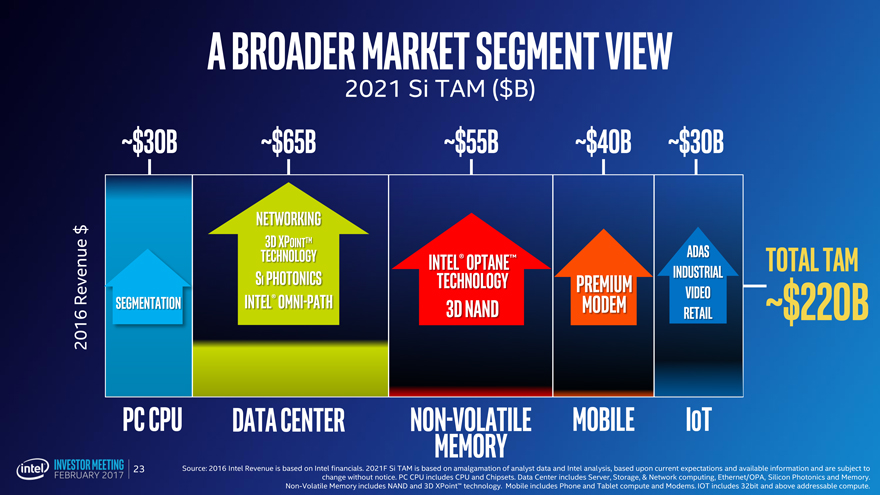
A broader market SEGMENT view 2021 Si TAM ($B) ~$30B ~$65B~$55B~$40B~$30B $ Revenue ~ Total $220BTam 2016 PC CPU Data centerNon-volatileMobileIoT Memory Source: 2016 Intel Revenue is based on Intel financials. 2021F Si TAM is based on amalgamation of analyst data and Intel analysis, based upon current expectations and available information and are subject to change without notice. PC CPU includes CPU and Chipsets. Data Center includes Server, Storage, & Network computing, Ethernet/OPA, Silicon Photonics and Memory. Non-Volatile Memory includes NAND and 3D XPoint™ technology. Mobile includes Phone and Tablet compute and Modems. IOT includes 32bit and above addressable compute.
22
|
|
A broader market segment view 2021 Si TAM ($B) ~$30B ~$65B~$55B~$40B~$30B Networking $ TechnologyADAS
PhotonicstechnologyIndustrial Revenue Segmentation Intel® Omni path3D NANDmodemVideo Retail 2016 PC CPU Data centerNon-volatileMobileIoT Memory Source: 2016 Intel Revenue is based on Intel financials. 2021F Si TAM is based on amalgamation of analyst data and Intel analysis, based upon current expectations and available information and are subject to change without notice. PC CPU includes CPU and Chipsets. Data Center includes Server, Storage, & Network computing, Ethernet/OPA, Silicon Photonics and Memory. Non-Volatile Memory includes NAND and 3D XPoint™ technology. Mobile includes Phone and Tablet compute and Modems. IOT includes 32bit and above addressable compute.
23
|
|
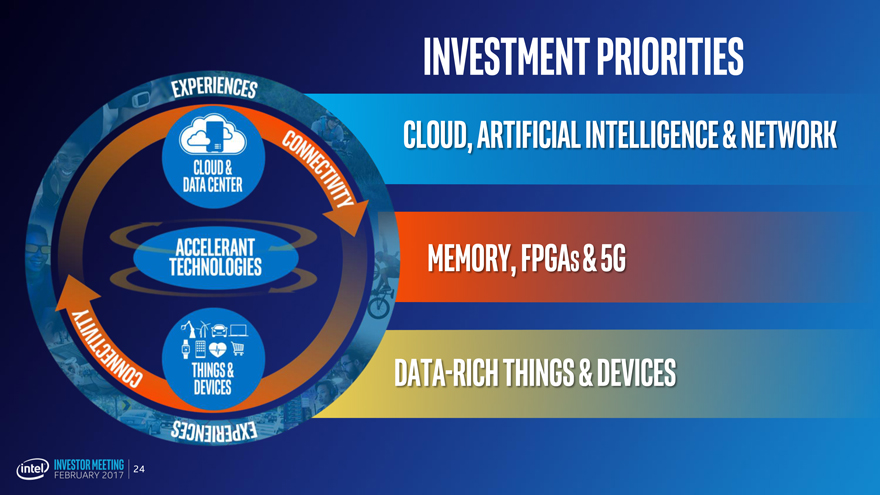
Investment Priorities
Cloud, ARTIFICIAL INTELLIGENCE & Network
memory, fpga & 5G
Data rich Things & Devices
24
|
|
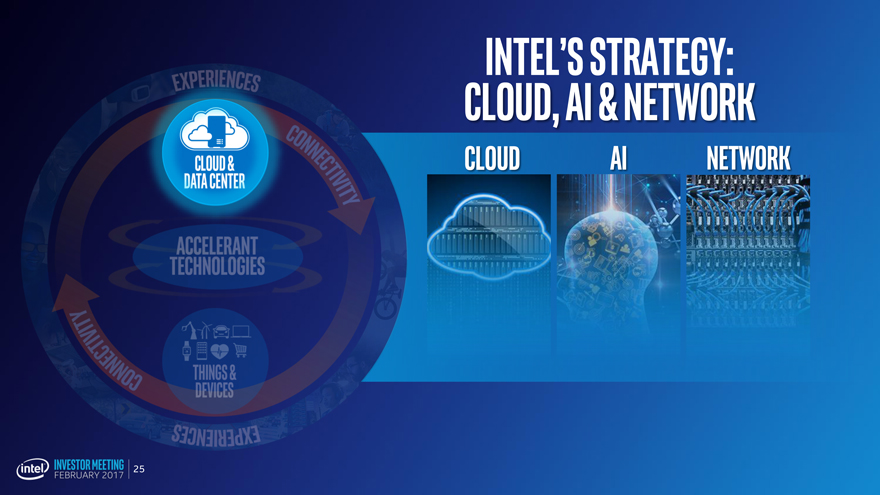
INTEL’S STRATEGY:
Cloud, AI & Network
cloud AI Network
25
|
|
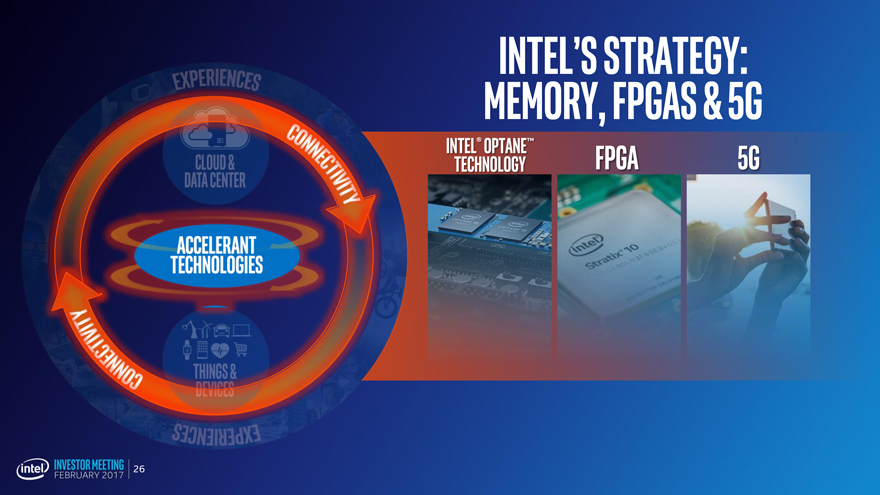
Intel’s Strategy:
Memory, FPGAs & 5G
Technology FPGA 5G
26
|
|
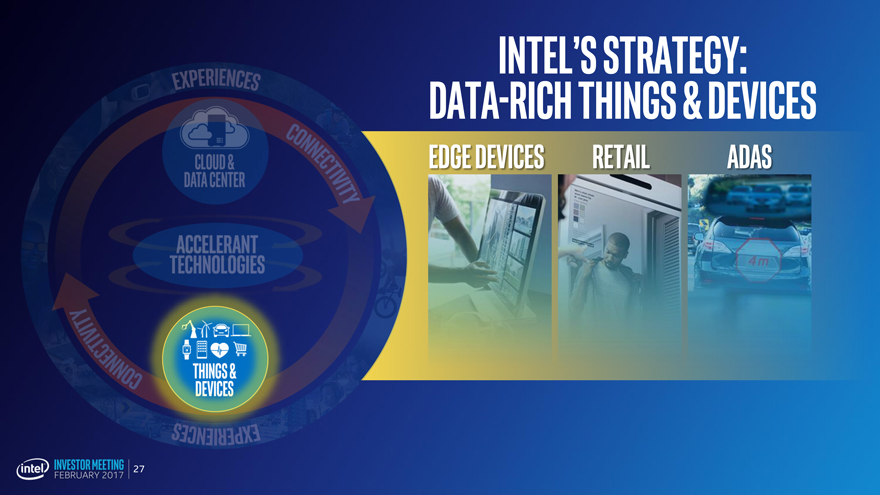
Intel’s Strategy:
Data-rich Things & Devices
EDGE devices Retail ADAS
27
|
|
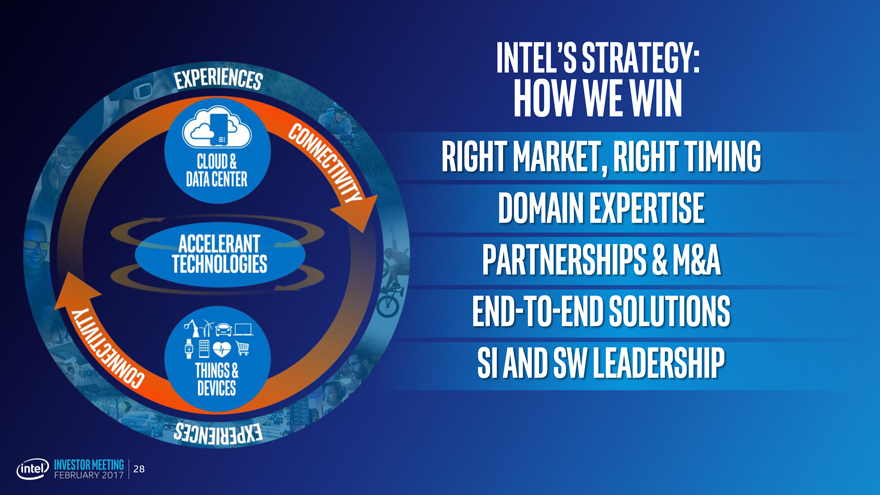
Intel’s Strategy:
How We Win
Right Market, Right Timing Domain Expertise Partnerships & M&A
End Solutions Si and SW Leadership
28
|
|
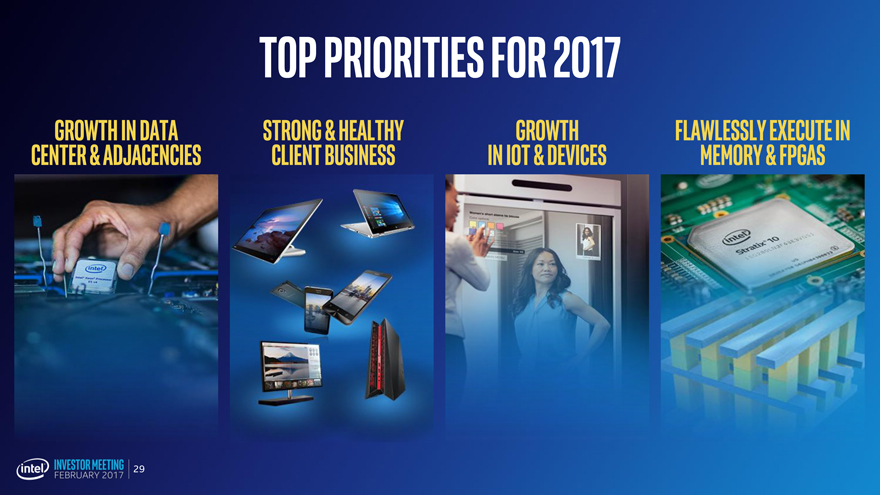
Top Priorities for 2017
Growth in Data strong & healthy growthflawlessly execute in
Center & Adjacencies Client business in IoT & devicesMemory & FPGAS
29
|
|
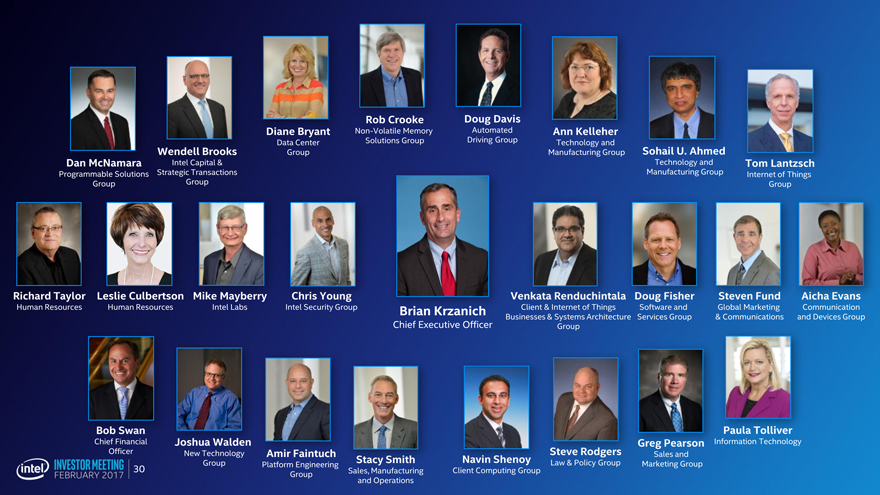
Dan McNamara Programmable Solutions Group Wendell Brooks Intel Capital & Strategic TransactionsGroup Diane Bryant Data Center Group Rob Crooke Non-Volatile Memory Solutions Group Doug Davis Automated Driving Group Ann Kelleher Technology and Manufacturing Group Sohail U. Ahmed Technology and Manufacturing Group Tom Lantzsch Internet of Things Group Richard Taylor Human Resources Leslie Culbertson Human Resources Mike Mayberry Intel Labs Chris Young Intel Security Group Brian Krzanich Chief Executive Officer Venkata Renduchintala Client & Internet of Things Businesses & Systems Architecture Group Doug Fisher Software and Services Group Steven Fund Global Marketing & Communications Aicha Evans Communication and Devices Group Bob Swan Chief Financial Officer Joshua Walden New Technology Group Amir Faintuch Platform Engineering Group Stacy Smith Sales, Manufacturing and Operations Navin Shenoy Client Computing Group Steve Rodgers Law & Policy Group Greg Pearson Sales and Marketing Group Paula Tolliver Information Technology
30
|
|
INVESTOR MEETING
FEBRUARY 2017
|
|
Appendix
32
|
|
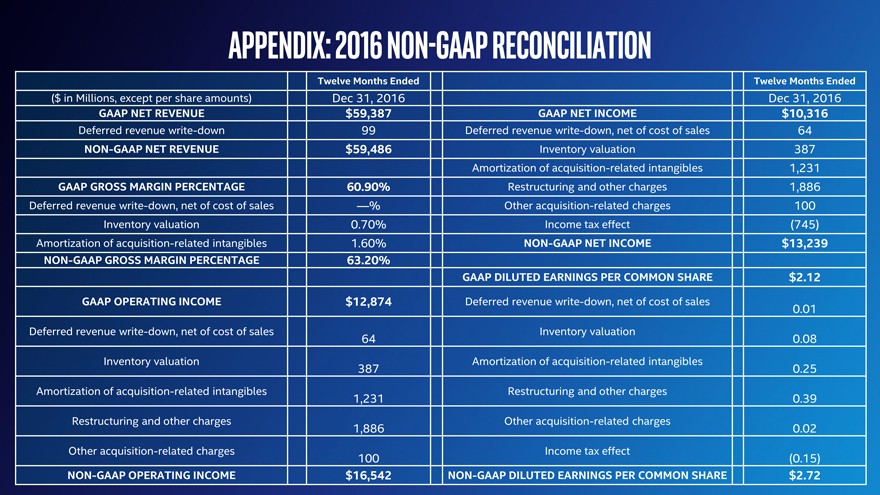
Appendix: 2016 Non-GAAP Reconciliation Twelve Months Ended Twelve Months Ended ($ in Millions, except per share amounts) Dec 31, 2016 Dec 31, 2016 GAAP NET REVENUE $59,387 GAAP NET INCOME$10,316 Deferred revenue write-down 99 Deferred revenue write-down, net of cost of sales64 NON-GAAP NET REVENUE $59,486 Inventory valuation387 Amortization of acquisition-related intangibles1,231 GAAP GROSS MARGIN PERCENTAGE 60.90% Restructuring and other charges1,886 Deferred revenue write-down, net of cost of sales —% Other acquisition-related charges100 Inventory valuation 0.70% Income tax effect(745) Amortization of acquisition-related intangibles 1.60% NON-GAAP NET INCOME$13,239 NON-GAAP GROSS MARGIN PERCENTAGE 63.20% GAAP DILUTED EARNINGS PER COMMON SHARE$2.12 GAAP OPERATING INCOME $12,874 Deferred revenue write-down, net of cost of sales0.01 Deferred revenue write-down, net of cost of sales Inventory valuation 64 0.08 Inventory valuation Amortization of acquisition-related intangibles 387 0.25 Amortization of acquisition-related intangibles Restructuring and other charges 1,231 0.39 Restructuring and other charges Other acquisition-related charges 1,886 0.02 Other acquisition-related charges Income tax effect 100 (0.15) NON-GAAP OPERATING INCOME $16,542 NON-GAAP DILUTED EARNINGS PER COMMON SHARE$2.72