Exhibit 99.2
| Exhibit 99.2
|
Dr. Murthy Renduchintala
PRESIDENT, CLIENT & IOT BUSINESS
and systems architecture group
|
|
DISCLOSURES
Statements in this presentation that refer to Business Outlook, forecast, future plans and expectations are forward-looking statements that involve a number of risks and uncertainties. Words such as “anticipates,” “expects,” “intends,” “goals,” “plans,”
“believes,” “seeks,” “estimates,” “continues,” “may,” “will,” “would,” “should,” “could,” and variations of such words and similar expressions are intended to identify such forward-looking statements. Statements that refer to or are based on projections, uncertain events or assumptions also identify forward-looking statements. Such statements are based on management’s expectations as of February 9, 2017 and involve many risks and uncertainties that could cause actual results to differ materially from those expressed or implied in these forward-looking statements. Important factors that could cause actual results to differ materially from the company’s expectations are set in Intel’s earnings release dated January 26, 2017, which is included as an exhibit to Intel’s Form 8-K furnished to the SEC on such date. Additional information regarding these and other factors that could affect Intel’s results is included in Intel’s SEC filings, including the company’s most recent reports on Forms 10-K and 10-Q. Copies of Intel’s Form 10-K, 10-Q and 8-K reports may be obtained by visiting our Investor Relations website at www.intc.com or the SEC’s website at www.sec.gov.
2
|
|
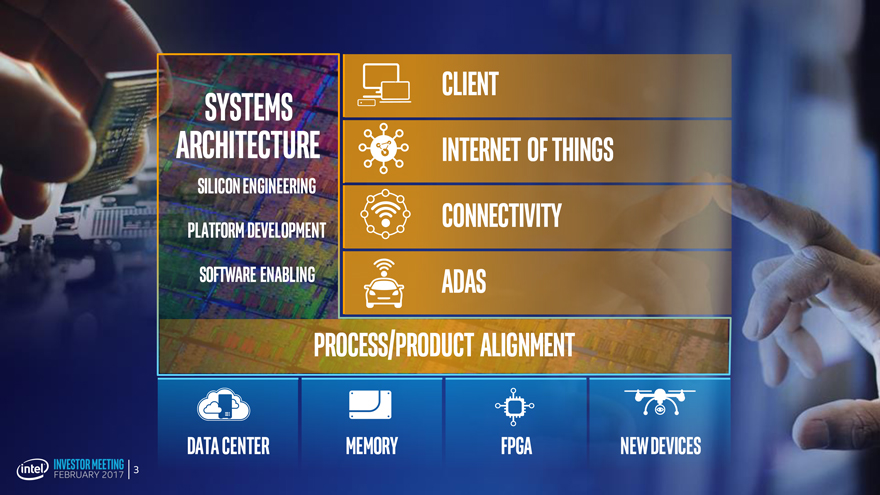
Systems
client
architecture
Internet of things
Silicon Engineering
Platform development
connectivity
Software enabling
ADAS
process/product alignment
Data center memory FPGA new devices
3
|
|
Strong Innovation Leading
results & Moore’s Law thedata revolution
4
|
|
Strong
RESULTS
Innovation
& Moore’s Law
Leading
the data revolution
5
|
|
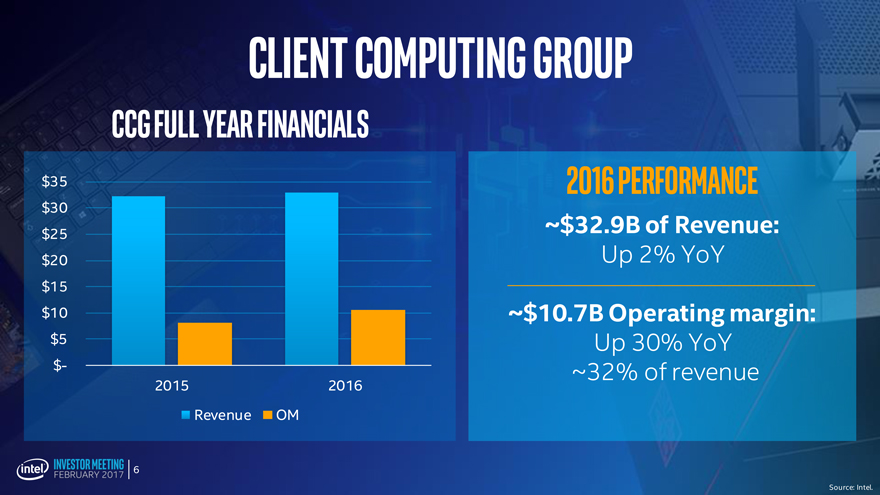
Client Computing Group
CCG Full Year Financials
$35
$30
$25
$20
$15
$10
$5
$-
2015 2016
RevenueOM
2016 PERFORMANCE
~$32.9B of Revenue:
Up 2% YoY
~$10.7B Operating margin:
Up 30% YoY ~32% of revenue
Source: Intel.
6
|
|
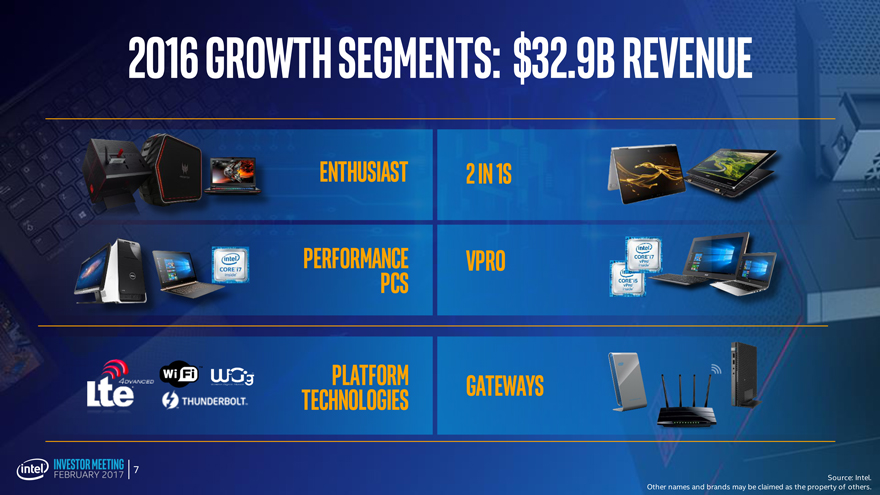
2016 growth segments: $32.9B revenue
Enthusiast 2 in 1s
Performance vPro
PCs
Platform Gateways
Technologies
Source: Intel.
Other names and brands may be claimed as the property of others.
7
|
|
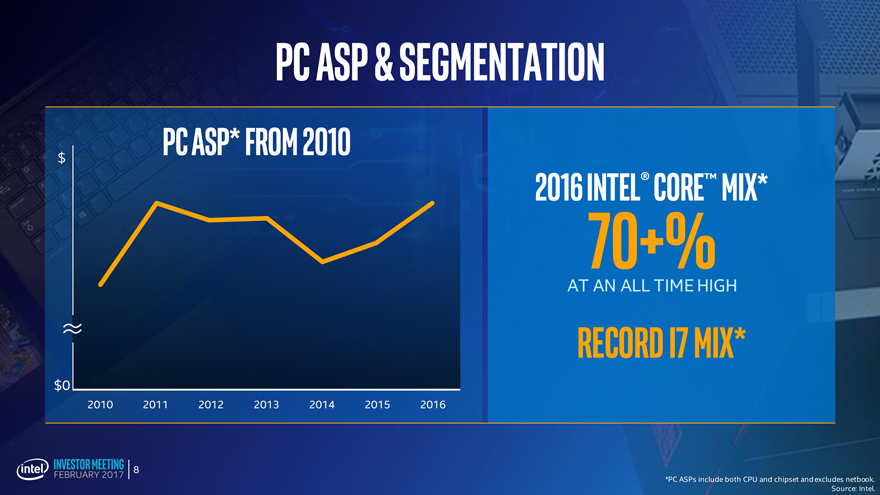
PC ASP & Segmentation
$ PC ASP*from2010
$0
2010 201120122013201420152016
2016 intel® Core™ Mix*
70+%
AT AN ALL TIME HIGH
Record i7 MIX*
*PC ASPs include both CPU and chipset and excludes netbook.
Source: Intel.
8
|
|
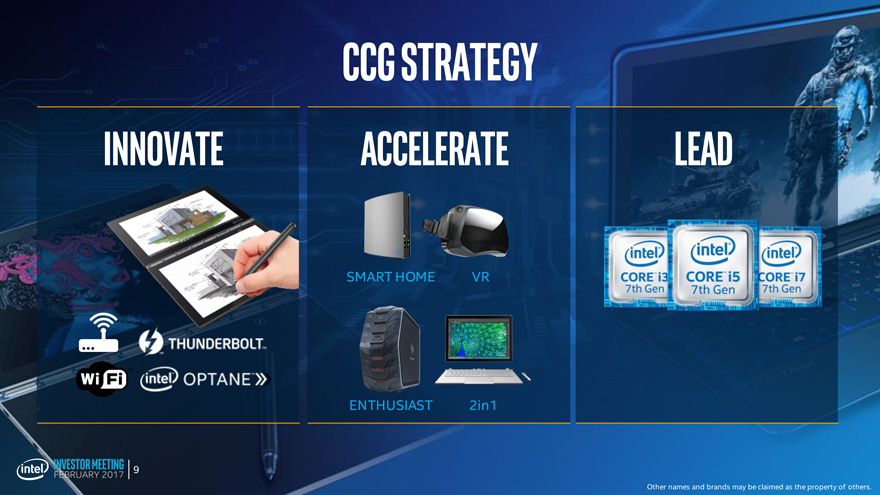
Ccg strategy
innovate accelerate lead
SMART HOME VR
ENTHUSIAST 2in1
Other names and brands may be claimed as the property of others.
9
|
|
STRONG
RESULTS
Innovation
& Moore’s Law
LEADING
THE DATA REVOLUTION
10
|
|
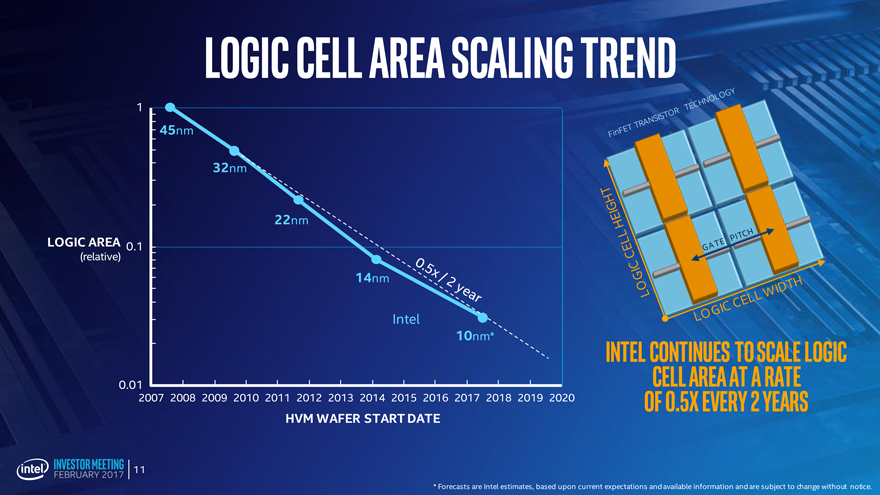
Logic Cell Area Scaling Trend
1
45nm
32nm
22nm
LOGIC AREA 0.1
(relative)
14nm
Intel
10nm*
0.01
2007 2008 2009 2010 2011 2012 2013 2014 2015 2016 2017 2018 2019 2020
HVM WAFER START DATE
Intel continues to scale logic
cell area at a rate
of 0.5x every 2 years
* Forecasts are Intel estimates, based upon current expectations and available information and are subject to change without notice.
11
|
|
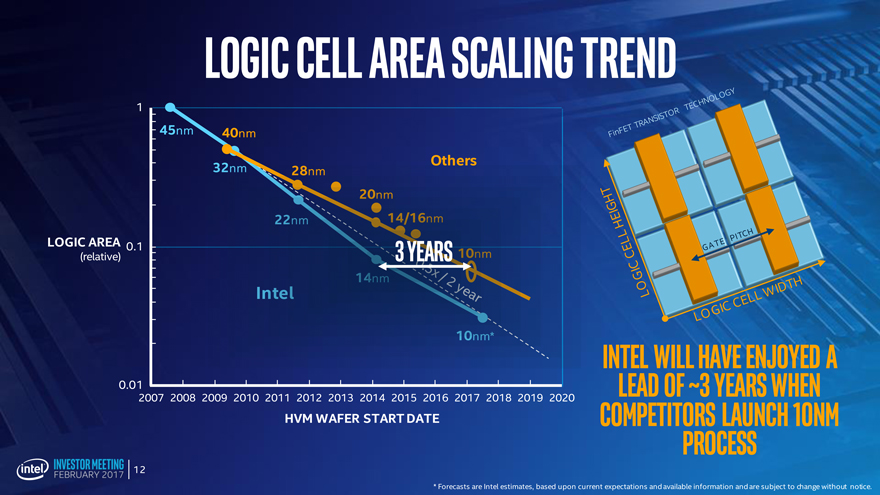
Logic Cell Area Scaling Trend
1
45nm 40nm
LOGIC AREA 0.1
(relative) 3 years
0.01
2007 2008 2009 2010 2011 2012 2013 2014 2015 2016 2017 2018 2019 2020
HVM WAFER START DATE
Intel will have enjoyed a lead of ~3 years when competitors launch 10nm process
* Forecasts are Intel estimates, based upon current expectations and available information and are subject to change without notice.
12
|
|
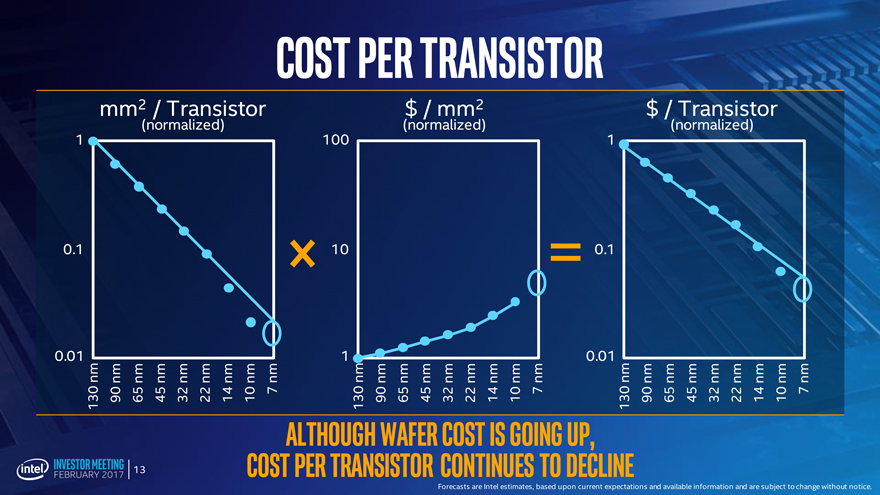
Cost per Transistor
0.01 0.1 1
130 nm
90 nm mm
65 nm 2
45 nm /
32 nm
22 nm
14 nm
10 nm (normalized) Transistor
7 nm
1 10 100
130 nm
90 nm
65 nm
$
45 nm /
32 nm
22 nm mm
(normalized) 2
14 nm
10 nm
7 nm
0.01 0.1 1
130 nm
90 nm $
65 nm /
45 nm
32 nm
22 nm
14 nm (normalized)Transistor
10 nm
7 nm
Although wafer cost is going up, cost per transistor continues to decline
Forecasts are Intel estimates, based upon current expectations and available information and are subject to change without notice.
13
|
|
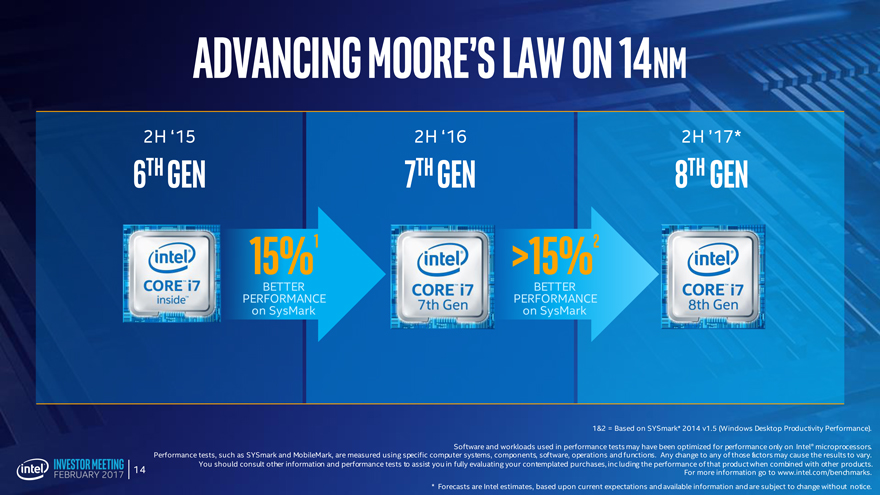
Advancing Moore’s law on 14nm
2H ‘15 2H ‘162H ’17*
6th Gen 7th gen8th gen
15%1 >15%2
BETTER BETTER
PERFORMANCE PERFORMANCE
on SysMark on SysMark
1&2 = Based on SYSmark* 2014 v1.5 (Windows Desktop Productivity Performance).
Software and workloads used in performance tests may have been optimized for performance only on Intel® microprocessors.
Performance tests, such as SYSmark and MobileMark, are measured using specific computer systems, components, software, operations and functions. Any change to any of those factors may cause the results to vary.
You should consult other information and performance tests to assist you in fully evaluating your contemplated purchases, inc luding the performance of that product when combined with other products.
For more information go to www.intel.com/benchmarks.
* Forecasts are Intel estimates, based upon current expectations and available information and are subject to change without notice.
14
|
|
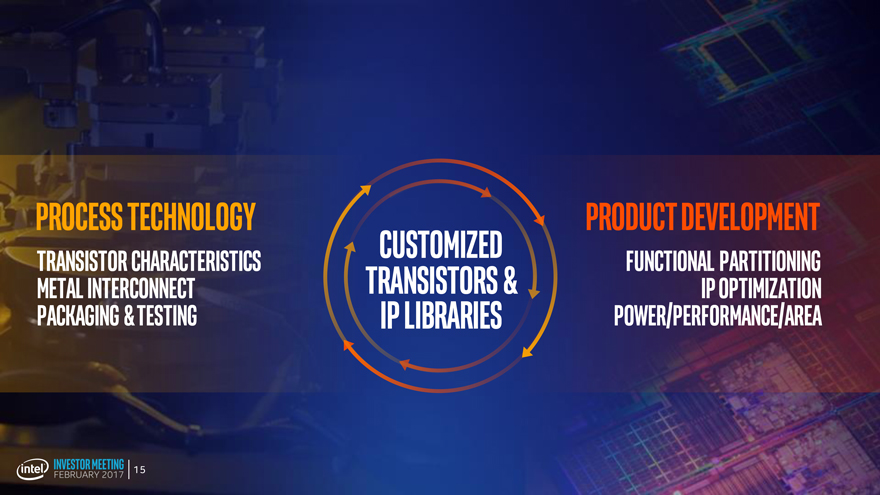
Process technology product development
Transistor characteristics Customized FUNCTIONAL PARTITIONING
Metal interconnect Transistors & IP optimization
PACKAGING & testing IP libraries Power/performance/area
15
|
|
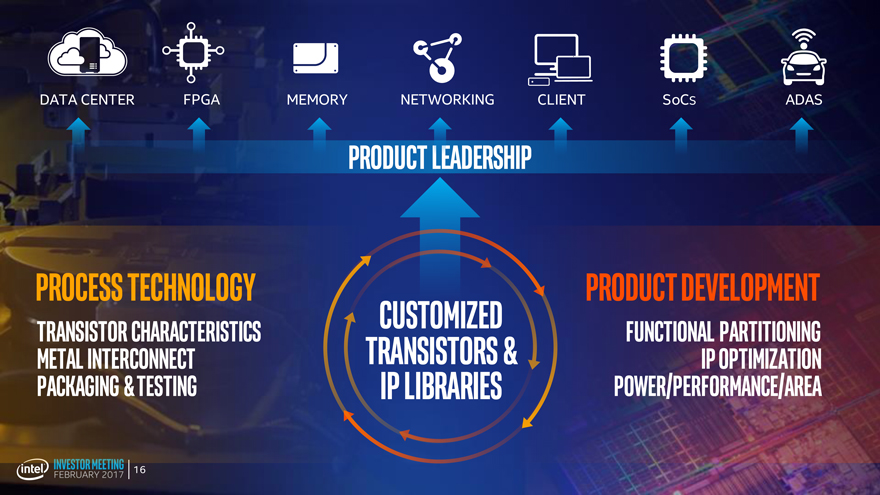
DATA CENTER FPGA MEMORYNETWORKINGCLIENTSoCSADAS
Product leadership
Process technology product development
Transistor characteristics CustomizedFUNCTIONAL PARTITIONING
Metal interconnect Transistors &IP optimization
PACKAGING & testing IP librariesPower/performance/area
16
|
|
STRONG
RESULTS
INNOVATION
& MOORE’S LAW
Leading
the data revolution
17
|
|
Data explosion
18
|
|
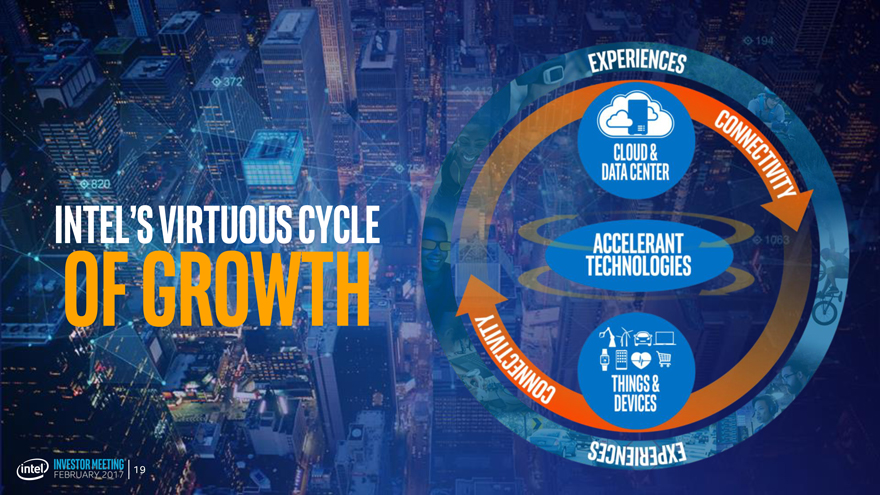
Intel’s Virtuous Cycle
of Growth
19
|
|
Intelligence strategic Driving / ADAS
bets
5g Virtu
Reality
20
|
|
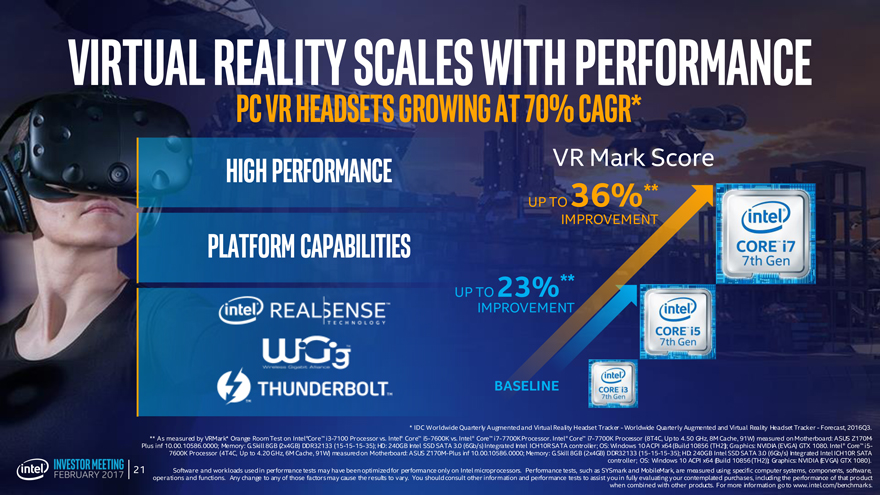
Virtual reality scales with performance
Pc VR Headsets growing at 70% CAGR*
High performance VR Mark Score
UP TO 36%**
IMPROVEMENT
Platform capabilities
UP TO 23%**
IMPROVEMENT
BASELINE
* IDC Worldwide Quarterly Augmented and Virtual Reality Headset Tracker—Worldwide Quarterly Augmented and Virtual Reality Headset Tracker—Forecast, 2016Q3.
** As measured by VRMark* Orange Room Test on Intel®Core™ i3-7100 Processor vs. Intel® Core™ i5-7600K vs. Intel® Core™ i7-7700K Processor. Intel® Core™ i7-7700K Processor (8T4C, Up to 4.50 GHz, 8M Cache, 91W) measured on Motherboard: ASUS Z170M-Plus inf 10.00.10586.0000; Memory: G.Skill 8GB (2x4GB) DDR32133 (15-15-15-35); HD: 240GB Intel SSD SATA 3.0 (6Gb/s) Integrated Intel ICH10R SATA controller; OS: Windows 10 ACPI x64 (Build 10856 (TH2)); Graphics: NVIDIA (EVGA) GTX 1080. Intel® Core™ i5-7600K Processor (4T4C, Up to 4.20 GHz, 6M Cache, 91W) measured on Motherboard: ASUS Z170M-Plus inf 10.00.10586.0000; Memory: G.Skill 8GB (2x4GB) DDR32133 (15-15-15-35); HD: 240GB Intel SSD SATA 3.0 (6Gb/s) Integrated Intel ICH10R SATA controller; OS: Windows 10 ACPI x64 (Build 10856 (TH2)); Graphics: NVIDIA (EVGA) GTX 1080).
Software and workloads used in performance tests may have been optimized for performance only on Intel microprocessors. Performance tests, such as SYSmark and MobileMark, are measured using specific computer systems, components, software, operations and functions. Any change to any of those factors may cause the results to vary. You should consult other information and performance tests to assist you in fully evaluating your contemplated purchases, including the performance of that product when combined with other products. For more information go to www.intel.com/benchmarks.
21
|
|
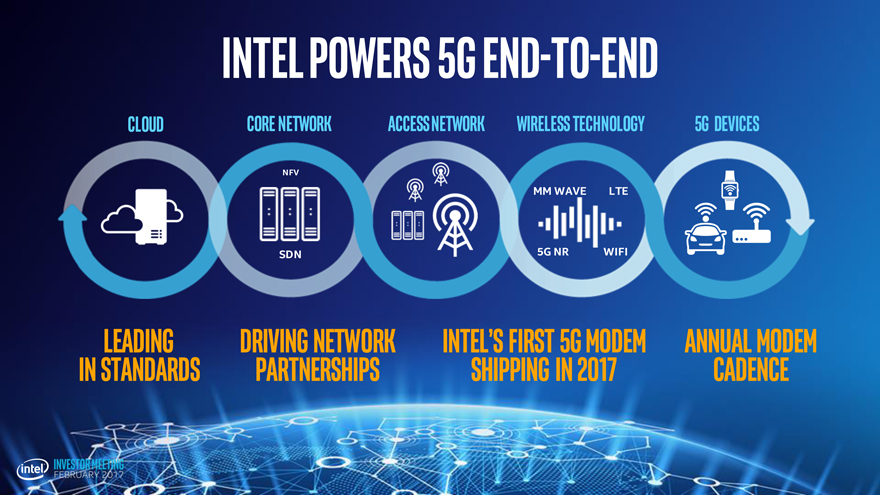
Intel powers5g end-to-end
Cloud Core NetworkAccessNetworkWireless Technology5g Devices
NFV
MM WAVELTE
SDN5G NRWIFI
Leading driving networkintel’sfirst 5g modemAnnual modem
in standards partnershipsshipping in 2017cadence
|
|
Innovation
& Moore’s Law
Strong Leading
results thedata revolution
23
|
|
INTEL®