Exhibit 99.6
| Exhibit 99.6
|
Investor MeetingFEBRUARY 2017
|
|
Bob Swan
Chief financial officer
|
|
DISCLOSURES
This presentation contains non-GAAP financial measures relating to our performance. You can find the reconciliation of these measures to the most directly comparable GAAP financial measure in the Appendix at the end of this presentation. The non-GAAP financial measures disclosed by Intel should not be considered a substitute for, or superior to, the financial measures prepared in accordance with GAAP. Please refer to “Explanation of Non-GAAP Measures” in Intel’s quarterly earnings release for a detailed explanation of the adjustments made to the comparable GAAP measures, the ways management uses the non-GAAP measures, and the reasons why management believes the non-GAAP measures provide investors with useful supplemental information.
Statements in this presentation that refer to Business Outlook, forecast, future plans and expectations are forward-looking statements that involve a number of risks and uncertainties. Words such as “anticipates,” “expects,” “intends,” “goals,” “plans,” “believes,” “seeks,” “estimates,” “continues,” “may,” “will,” “would,” “should,” “could,” and variations of such words and similar expressions are intended to identify such forward-looking statements. Statements that refer to or are based on projections, uncertain events or assumptions also identify forward-looking statements. Such statements are based on management’s expectations as of February 9, 2017 and involve many risks and uncertainties that could cause actual results to differ materially from those expressed or implied in these forward-looking statements. Important factors that could cause actual results to differ materially from the company’s expectations are set in Intel’s earnings release dated January 26, 2017, which is included as an exhibit to Intel’s Form 8-K furnished to the SEC on such date. Additional information regarding these and other factors that could affect Intel’s results is included in Intel’s SEC filings, including the company’s most recent reports on Forms 10-K and 10-Q. Copies of Intel’s Form 10-K, 10-Q and 8-K reports may be obtained by visiting our Investor Relations website at www.intc.com or the SEC’s website at www.sec.gov.
3
|
|
A BRIEF RECAP
Industry leader
Expanding TAM… investing in the future Industry trends playing to our strengths Great portfolio of businesses and assets
4
|
|
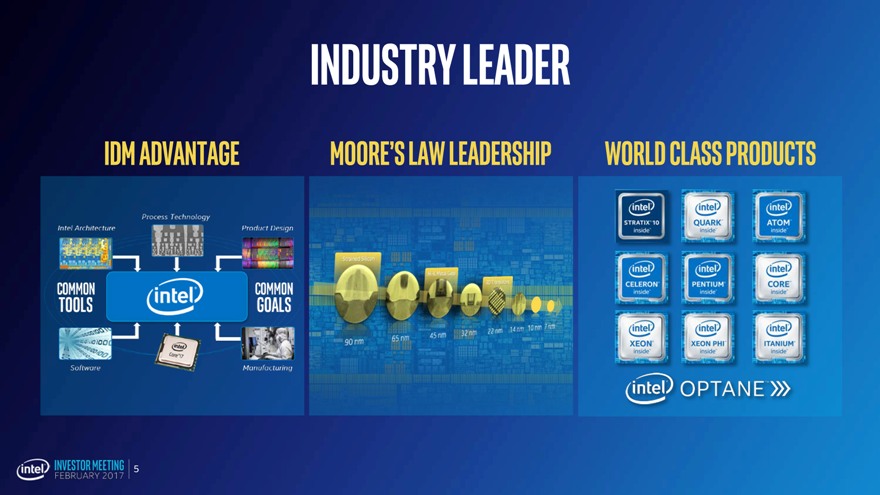
INDUSTRY LEADER
IDM Advantage Moore’s Law Leadership World Class Products
5
|
|
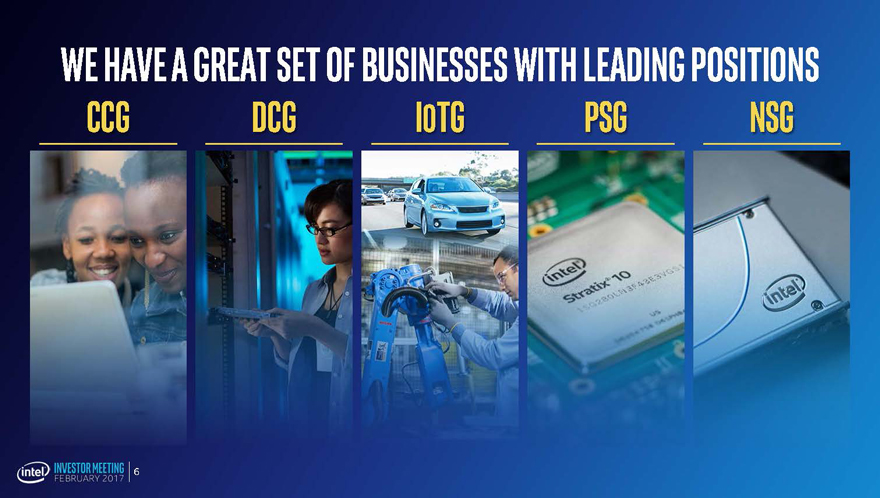
WE HAVE A GREAT SET OF BUSINESSES WITH LEADING POSITIONS
CCG DCG TG PSG NSG
6
|
|
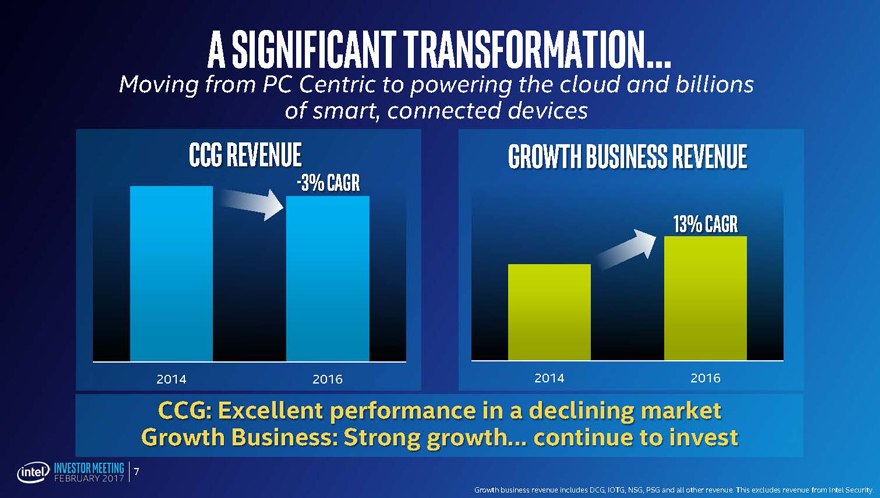
A SIGNIFICANT TRANSFORMATION…
Moving from PC Centric to powering the cloud and billions of smart, connected devices
CCG Revenue Growth Business Revenue
CAGR
13% CAGR
2014 2016 20142016
CCG: Excellent performance in a declining market
Growth Business: Strong growth… continue to invest
Growth business revenue includes DCG, IOTG, NSG, PSG and all other revenue. This excludes revenue from Intel Security.
7
|
|
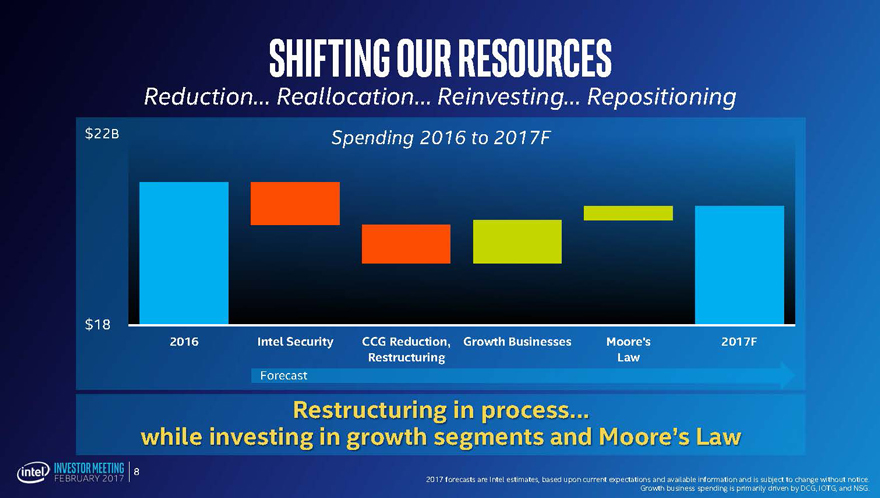
SHIFTING OUR RESOURCES
Reduction… Reallocation… Reinvesting… Repositioning
$ 22B Spending 2016 to 2017F
$ 18
2016Intel SecurityCCG Reduction, Growth BusinessesMoore’s2017F
RestructuringLaw
Forecast
Restructuring in process…
while investing in growth segment and Moore’sLaw
2017 forecasts are Intel estimates, based upon current expectations and available information and is subject to change without notice.
Growth business spending is primarily driven by DCG, IOTG, and NSG.
8
|
|
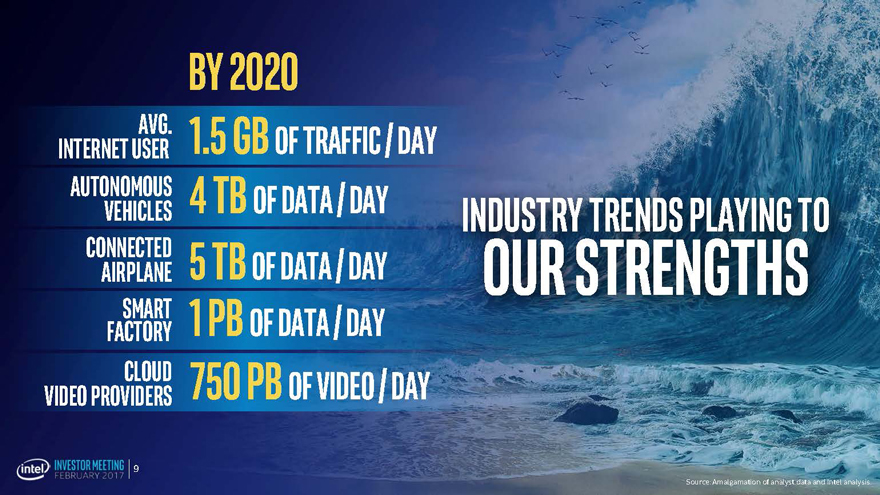
BY 2020
AVG. 1.5 GB OF TRAFFIC / DAY
INTERNET USER
AUTONOMOUS 4 TB OF DATA / DAY
VEHICLES INDUSTRY TRENDS PLAYING TO
CONNECTED 5 TB OF DATA / DAY
AIRPLANE OUR STRENGTHS
SMART 1 PB OF DATA / DAY
FACTORY
CLOUD 750 PB OF VIDEO / DA
VIDEO PROVIDERS
Source: Amalgamation of analyst data and Intel analysis.
9
|
|
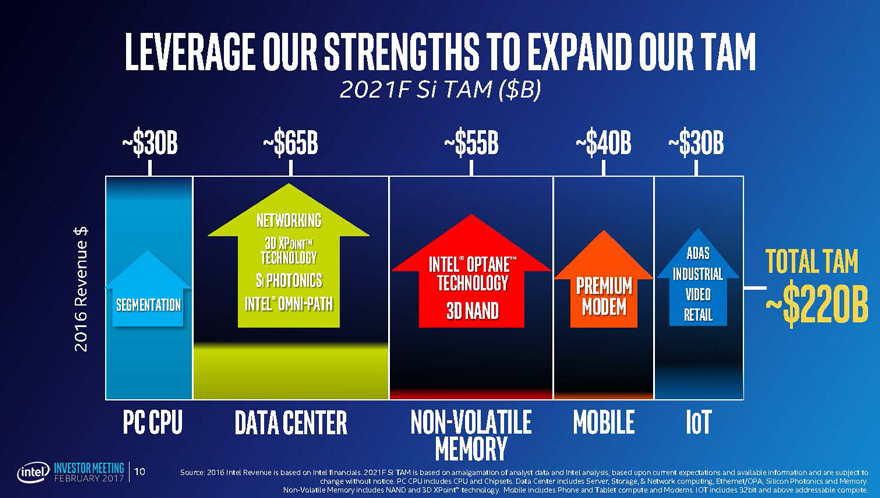
LEVERAGE OUR STRENGTHS TO EXPAND OUR TAM
2021F Si TAM ($B)
~$30B ~$65B~$55B~$40B~$30B
Networking
$
TechnologyADASTotal Tam
PhotonicstechnologyIndustrial
Video
2016 Revenue Segmentation Intel Ompath3D NANDmodemRetail~$220B
PC CPU Data centerNon-volatileMobileIoT
Memory
Source: 2016 Intel Revenue is based on Intel financials. 2021F Si TAM is based on amalgamation of analyst data and Intel analysis, based upon current expectations and available information and are subject to change without notice. PC CPU includes CPU and Chipsets. Data Center includes Server, Storage, & Network computing, Ethernet/OPA, Silicon Photonics and Memory.
Non-Volatile Memory includes NAND and 3D XPoint™ technology. Mobile includes Phone and Tablet compute and Modems. IOT includes 32bit and above addressable compute.
10
|
|
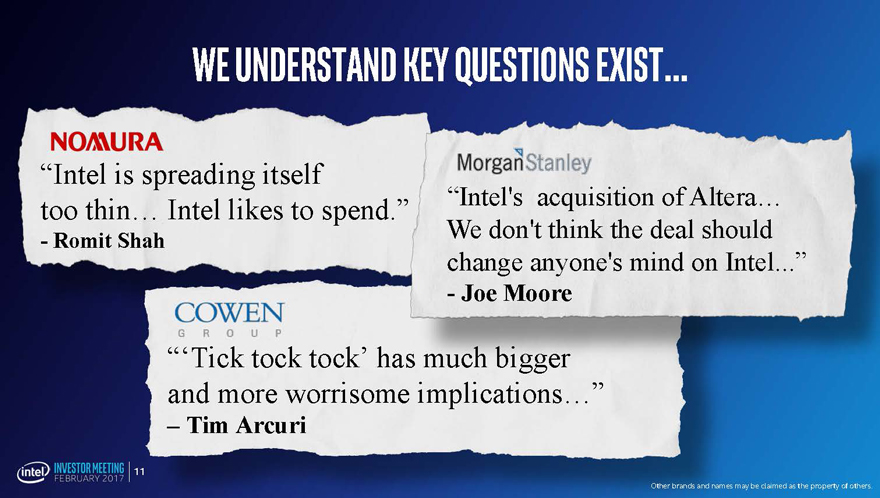
WE UNDERSTAND KEY QUESTIONS EXIST…
“Intel is spreading itself too thin… Intel likes to spend.” “Intel’s acquisition of Altera…
- Romit Shah We don’t think the deal should change anyone’s mind on Intel...”
- Joe Moore
“‘Tick tock tock’ has and more worrisome implications…”
– Tim Arcuri
Other brands and names may be claimed as the property of others.
11
|
|
DELIVER THE PRESENT…
CREATE THE FUTURE
|
|
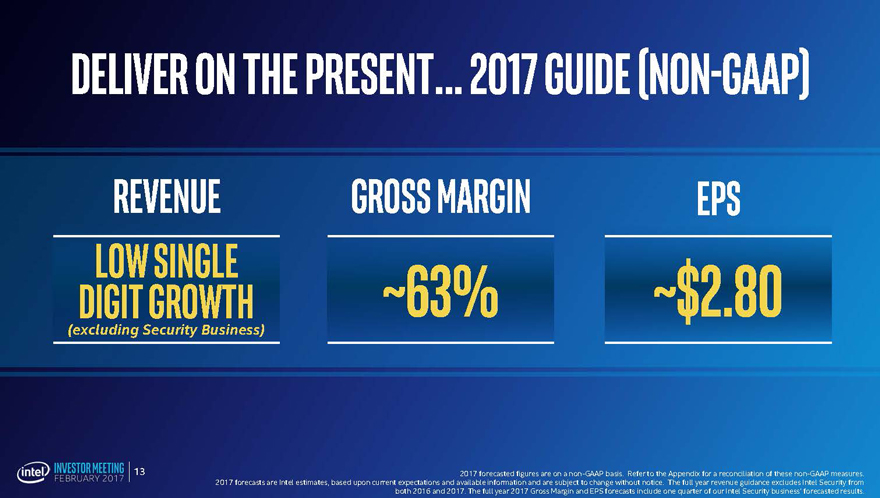
DELIVER ON THE PRESENT… 2017 GUIDE (NON-GAAP)
REVENUE GROSS MARGIN EPS LOW SINGLE ~63% ~$2.80 DIGIT GROWTH
(excluding Security Business)
2017 forecasted figures are on a non-GAAP basis. Refer to the Appendix for a reconciliation of these non-GAAP measures. 2017 forecasts are Intel estimates, based upon current expectations and available information and are subject to change without notice. The full year revenue guidance excludes Intel Security from both 2016 and 2017. The full year 2017 Gross Margin and EPS forecasts include one quarter of our Intel Security business’ forecasted results.
13
|
|
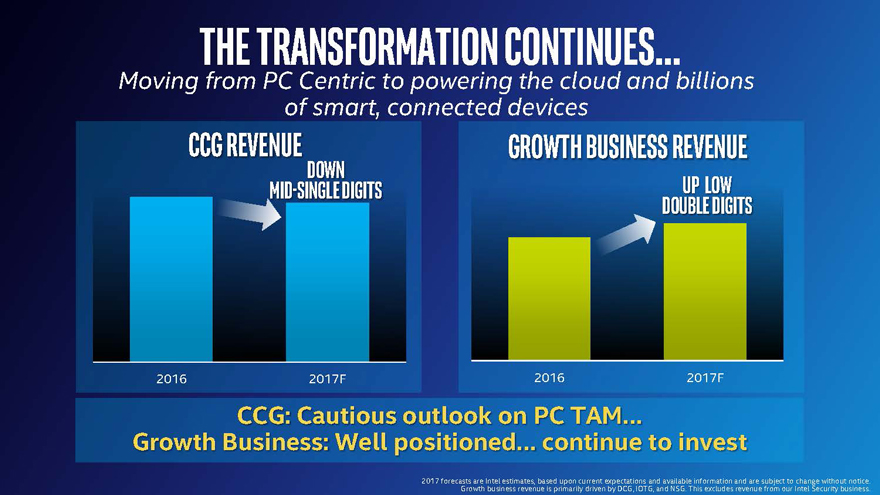
THE TRANSFORMATION CONTINUES…
Moving from PC Centric to powering the cloud and billions of smart, connected devices
CCG REVENUE GROWTH BUSINESS REVENUE
MI SINGLE DIGITS
DOUBLE DIGITS
2016 2017F 2016 2017F
CCG: Cautious outlook on PC TAM…
Growt Business Well positioned… continue to invest
2017 forecasts Growth are Intel business estimates, revenue based is primarily upon current driven expectations by DCG, IOTG, and and available NSG. This information excludes and revenue are subject from our to Intel change Security without business. notice.
|
|
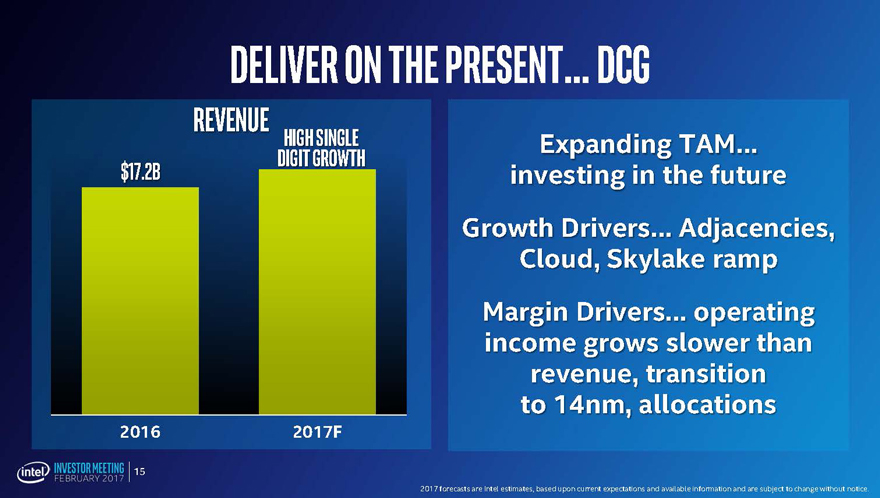
DELIVER ON THE PRESENT… DCG
Revenue
$17.2B git growth
2016 2017F
Expanding TAM… investing in the future Growth Drivers… Adjacencies, Cloud Skylak ramp Margin Drivers… operating income grows slower than revenue, transition to 14nm, allocations
2017 forecasts are Intel estimates, based upon current expectations and available information and are subject to change without notice.
15
|
|
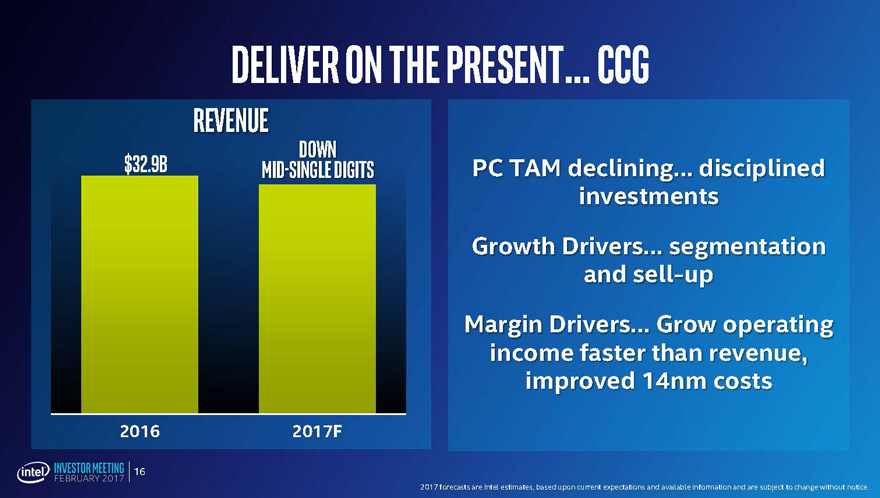
DELIVER ON THE PRESENT… CCG
Revenue
$32.9B Mi single digits
2016 2017F
PC TAM declining… disciplined investments Growth Drivers… segmentation and sel up Margin Drivers… Grow operating income faster than revenue, improved 14nm costs
2017 forecasts are Intel estimates, based upon current expectations and available information and are subject to change without notice.
16
|
|
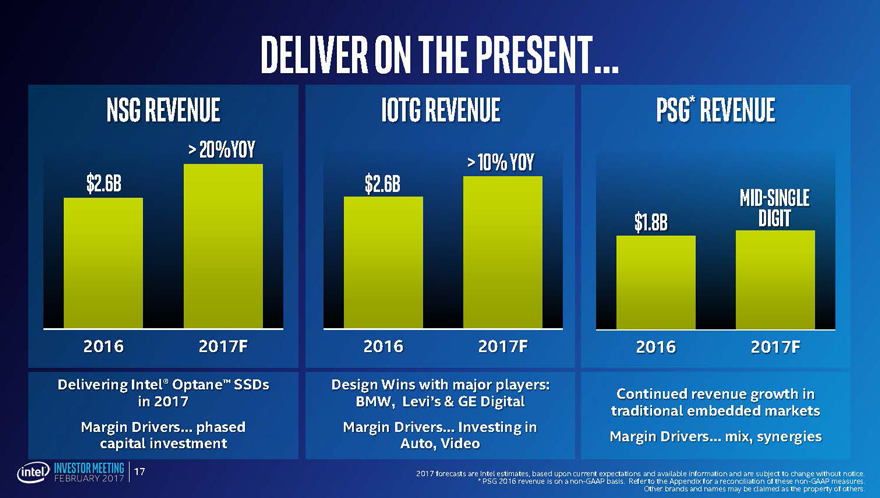
DELIVER ON THE PRESENT…
NSG Revenue IOTG Revenue PSGRevenue
oY > 1YoY
$2.6B $2.6BMi
$1.8Bdigit
2016 2017F 20162017F20162017F
Delivering Inte Optan ™ SSDs Design Wins with major players:
in 2017 BMW, Levi’s & GE Digital Continued revenue growth in
traditional embedded markets
Margin Drivers… phased Margin Drivers… Investing in
capital investment Auto, Video Margin Drivers… mix, synergies
2017 forecasts are* Intel PSG estimates, 2016 revenue based is on upon a non-GAAP current expectations basis. Refer and to the available Appendix information for a reconciliation and are subject of these to change non-GAAP without measures. notice.
Other brands and names may be claimed as the property of others.
17
|
|
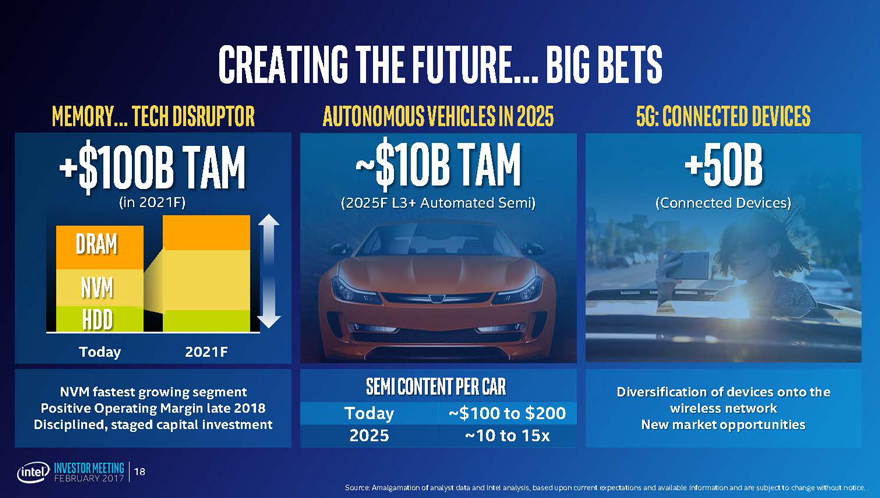
CREATING THE FUTURE… BIG BETS
+ 00B TAM ~$10B TAM5+50Bs
(in 2021F) (2025F L3+ Automated Semi)(Connected Devices)
NVM
2021F
NVM fastest growing segment Semi content Per car Diversification of devices onto the
Positive Operating Margin late 2018 Today ~$100 to $200wireless network
Disciplined, staged capital investment New market opportunities
2025~10 to 15x
Source: Amalgamation of analyst data and Intel analysis, based upon current expectations and available information and are subject to change without notice. .
18
|
|
CAPITAL ALLOCATION
19
|
|
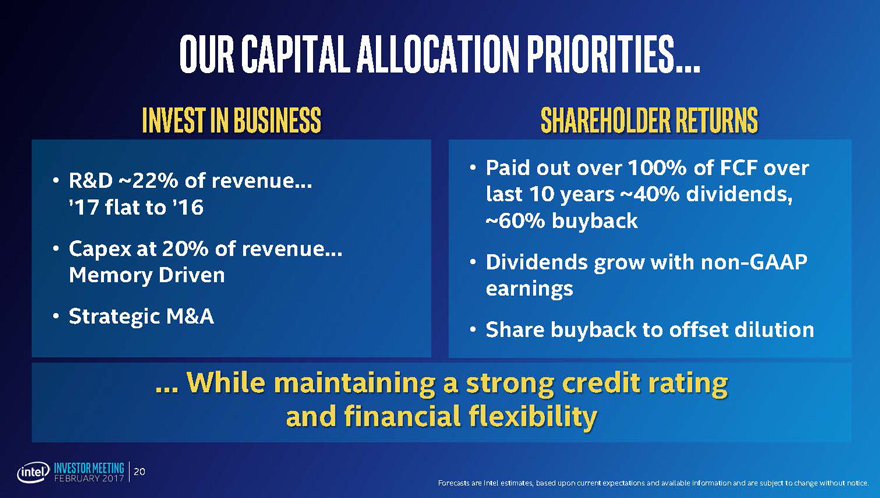
OUR CAPITAL ALLOCATION PRIORITIES…
INVEST IN BUSINESS
• R&D ~22% of revenue… ’17 flat to ’16
• Capex at 20% of revenue… Memory Driven
• Strategic M&A
Shareholder Returns
Paid ver last 10 years ~40% dividends, ~60% buyback
Dividends grow with non-GAAP earnings
Share buyback to offset dilution
… While maintaining a strong credit rating and financial flexibility
Forecasts are Intel estimates, based upon current expectations and available information and are subject to change without notice.
20
|
|
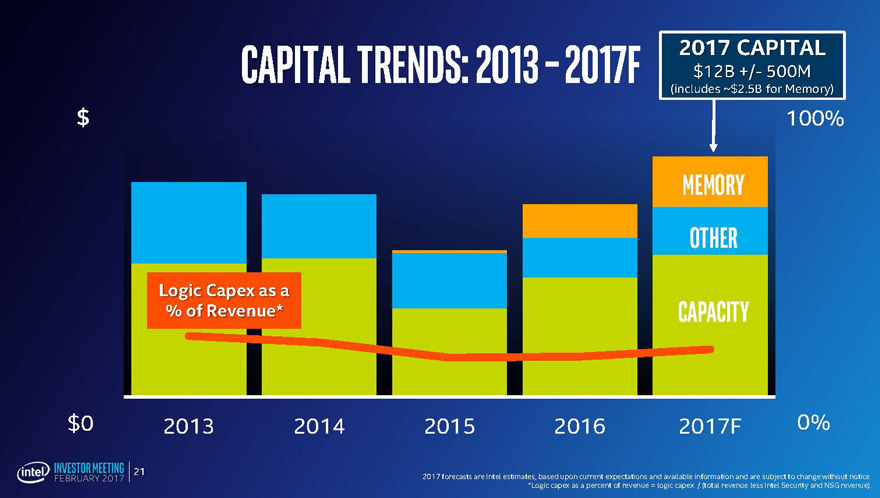
2017 CAPITAL
CAPITAL TRENDS: 2013 – 2017F $12B 500M
(includes ~$2.5B for Memory)
100%
$
Memory
Other
Logi Cape as a
% of Revenue* Capacity
$0 2013 2014201520162017F0%
2017 forecasts are Intel estimates, based upon current expectations and available information and are subject to change without notice.
*Logic capex as a percent of revenue = logic capex / (total revenue less Intel Security and NSG revenue).
21
|
|
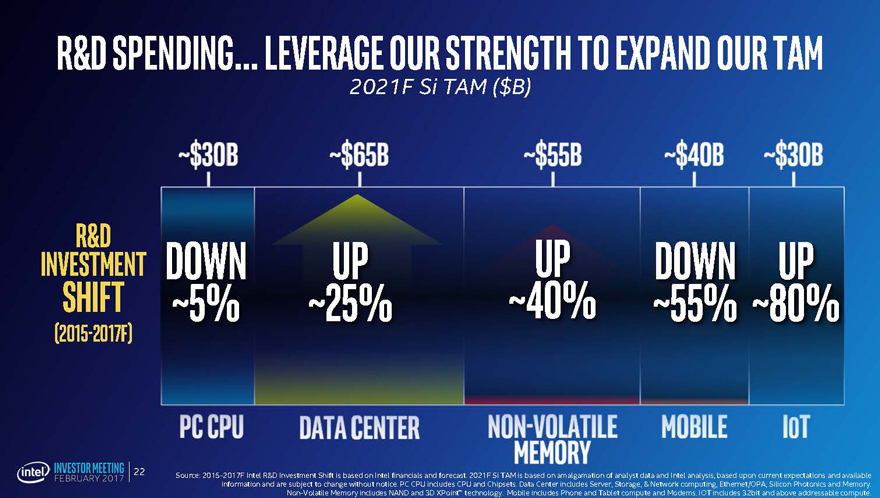
R&D SPENDING… LEVERAGE OUR STRENGTH TO EXPAND OUR TAM
2021F Si TAM ($B)
R&D
INVESTMENT
Shift ~5% ~25%~40%~55%~80%
(2015-2017F)
Source: 2015-2017F Intel R&D Investment Shift is based on Intel financials and forecast. 2021F Si TAM is based on amalgamation of analyst data and Intel analysis, based upon current expectations and available information and are subject to change without notice. PC CPU includes CPU and Chipsets. Data Center includes Server, Storage, & Network computing, Ethernet/OPA, Silicon Photonics and Memory.
Non-Volatile Memory includes NAND and 3D XPoint™ technology. Mobile includes Phone and Tablet compute and Modems. IOT includes 32bit and above addressable compute.
22
|
|
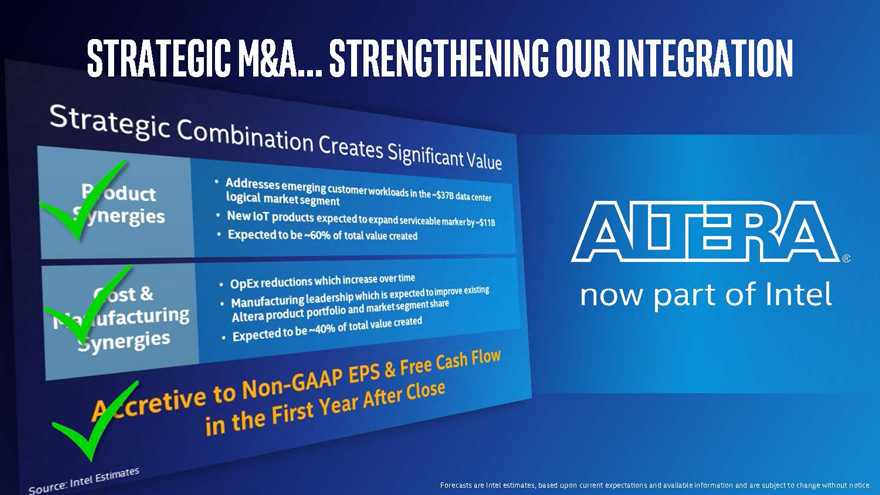
STRATEGIC M&A… STRENGTHENING OUR INTEGRATION
Forecasts are Intel estimates, based upon current expectations and available information and are subject to change without notice.
|
|
ACCELERATE
OUR CAPABILITIES
STRATEGIC M&A
24
|
|
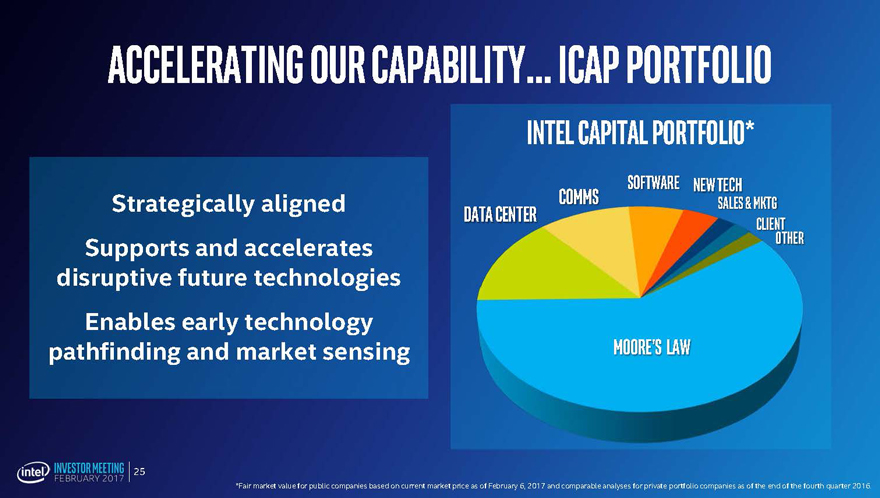
ACCELERATING OUR CAPABILITY… ICAP PORTFOLIO
Strategically aligned Supports and accelerates disruptive future technologies Enables early technology pathfinding and market sensing
Intel Capital Portfolio*
Software New Tech
Comms Sales & Mktg
Data Center Client
Other
MoorE’ LAW
*Fair market value for public companies based on current market price as of February 6, 2017 and comparable analyses for private portfolio companies as of the end of the fourth quarter 2016.
25
|
|
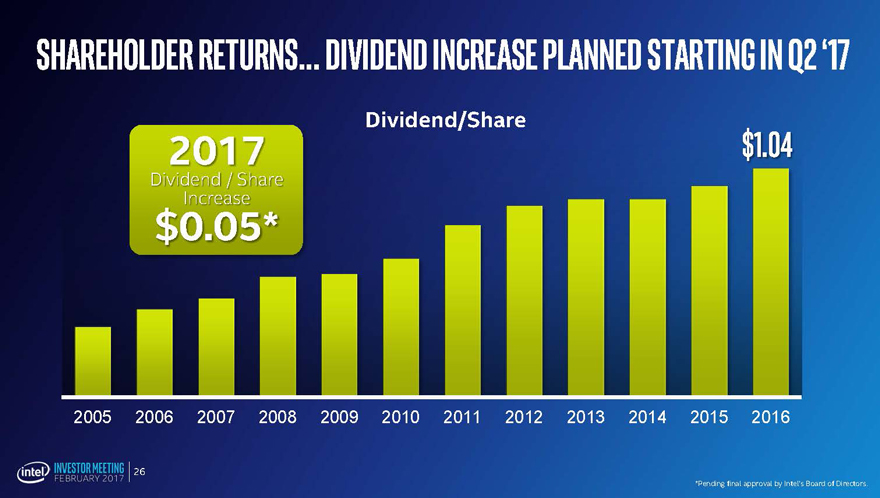
SHAREHOLDER RETURNS… DIVIDEND INCREASE PLANNED STARTING IN Q2 ‘17
Dividend/Share
2017 $1.04
$0.05*
2005 2006 2007200820092010201120122013201420152016
*Pending final approval by Intel’s Board of Directors.
26
|
|
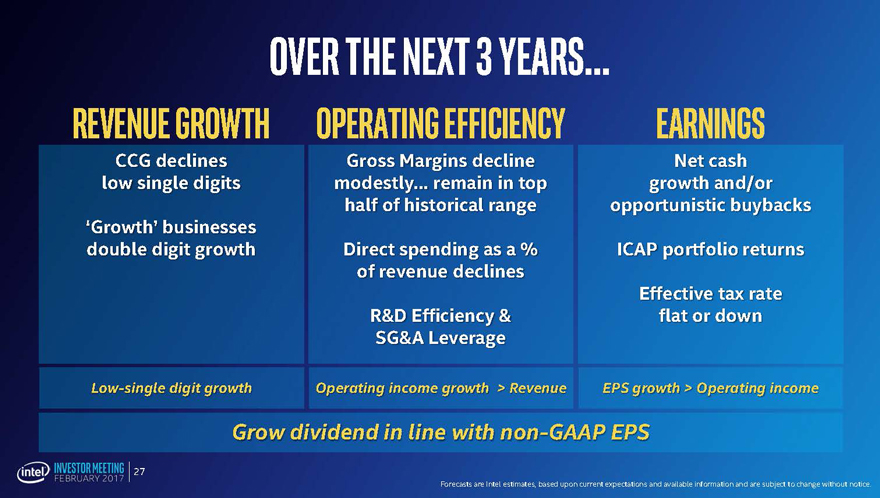
OVER THE NEXT 3 YEARS…
Revenue Growth Operating efficiency earnings
CCG declines Gross Margins decline Net cash
low single digits modestly… remain in top growt and/or
half of historical range opportunistic buybacks
Growth’ businesses
doubl digit growth Direct spending as % ICAP portfolio returns
o revenue declines
Effective tax rate
R&D Efficienc & flat or down
SG& Leverage
Lo single dig growth Operating income growth > Revenue EPS growtOperating income
Forecasts are Intel estimates, based upon current expectations and available information and are subject to change without notice.
27
|
|
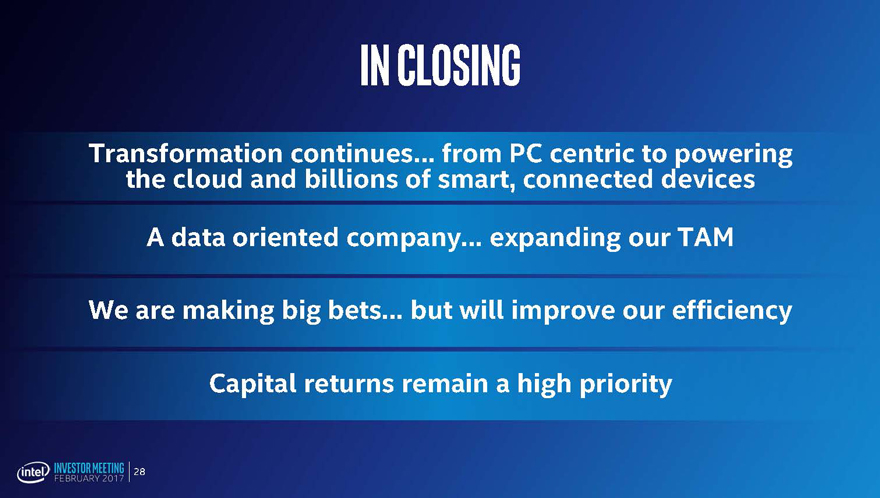
IN CLOSING
Transformation continues… from PC centric to powering the cloud and billions of smart, connected devices A data oriented company… expanding our TAM
We are making big bets… but will improve our efficiency
Capital returns remain a high priority
28
|
|
Q&A
|
|
Investor MeetingFEBRUARY 2017
|
|
APPENDIX
|
|
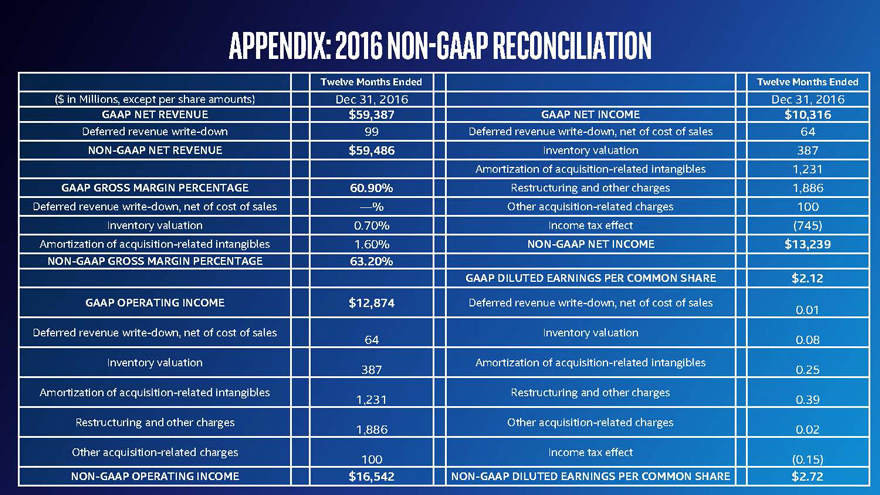
APPENDIX: 2016 NON-GAAP RECONCILIATION
Twelve Months Ended Twelve Months Ended
($ in Millions, except per share amounts) Dec 31, 2016 Dec 31, 2016
GAAP NET REVENUE $59,387 GAAP NET INCOME$10,316
Deferred revenue write-down 99 Deferred revenue write-down, net of cost of sales64
NON-GAAP NET REVENUE $59,486 Inventory valuation387
Amortization of acquisition-related intangibles1,231
GAAP GROSS MARGIN PERCENTAGE 60.90% Restructuring and other charges1,886
Deferred revenue write-down, net of cost of sales —% Other acquisition-related charges100
Inventory valuation 0.70% Income tax effect(745)
Amortization of acquisition-related intangibles 1.60% NON-GAAP NET INCOME$13,239
NON-GAAP GROSS MARGIN PERCENTAGE 63.20%
GAAP DILUTED EARNINGS PER COMMON SHARE$2.12
GAAP OPERATING INCOME $12,874 Deferred revenue write-down, net of cost of sales0.01
Deferred revenue write-down, net of cost of sales Inventory valuation
64 0.08
Inventory valuation Amortization of acquisition-related intangibles
387 0.25
Amortization of acquisition-related intangibles Restructuring and other charges
1,231 0.39
Restructuring and other charges Other acquisition-related charges
1,886 0.02
Other acquisition-related charges Income tax effect
100 (0.15)
NON-GAAP OPERATING INCOME $16,542 NON-GAAP DILUTED EARNINGS PER COMMON SHARE$2.72
|
|
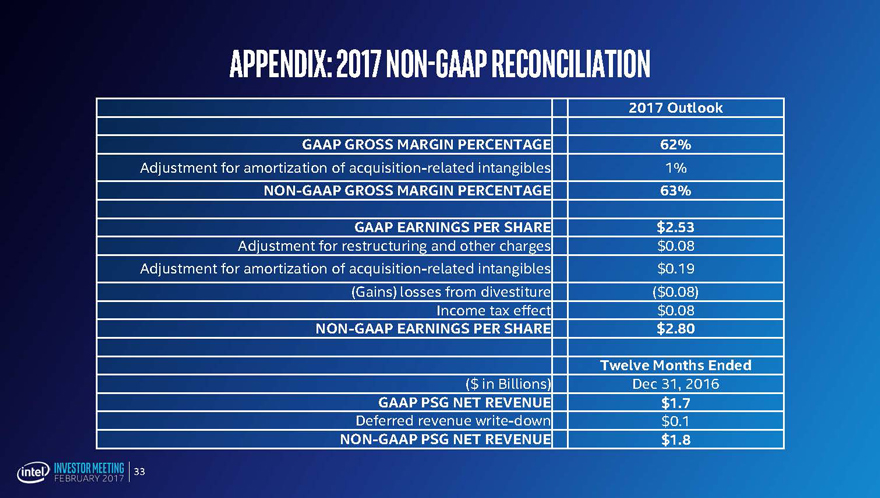
APPENDIX: 2017 NON-GAAP RECONCILIATION
2017 Outlook
GAAP GROSS MARGIN PERCENTAGE 62%
Adjustment for amortization of acquisition-related intangibles 1%
NON-GAAP GROSS MARGIN PERCENTAGE 63%
GAAP EARNINGS PER SHARE $2.53
Adjustment for restructuring and other charges $0.08
Adjustment for amortization of acquisition-related intangibles $0.19
(Gains) losses from divestiture ($0.08)
Income tax effect $0.08
NON-GAAP EARNINGS PER SHARE $2.80
Twelve Months Ended
($ in Billions) Dec 31, 2016
GAAP PSG NET REVENUE $1.7
Deferred revenue write-down $0.1
NON-GAAP PSG NET REVENUE $1.8
33