Forward-Looking Statements
•our business plans and strategy and anticipated benefits therefrom, including with respect to our IDM 2.0 strategy, the transition to an internal foundry model, updates to our reporting structure, and our AI strategy;
•projections of our future financial performance, including cost savings and operational efficiencies;
•future products, services, and technologies and expectations regarding product and process leadership;
•plans and goals related to Intel's foundry business;
•our anticipated growth, future market share, and trends in our business and operations;
•projected market and technology trends, such as AI;
•future macro environmental and economic conditions; and
•other characterizations of future events or circumstances.
Such statements involve many risks and uncertainties that could cause our actual results to differ materially from those expressed or implied, including those associated with:
•the high level of competition and rapid technological change in our industry;
•the significant long-term and inherently risky investments we are making in R&D and manufacturing facilities that may not realize a favorable return;
•the complexities and uncertainties in developing and implementing new semiconductor products and manufacturing process technologies;
•our ability to time and scale our capital investments appropriately and successfully secure favorable alternative financing arrangements and government grants;
•implementing new business strategies and investing in new businesses and technologies;
•changes in demand for our products;
•macroeconomic conditions and geopolitical tensions and conflicts, including geopolitical and trade tensions between the US and China, the impacts of Russia's war on Ukraine, tensions and conflict affecting Israel, and rising tensions between mainland China and Taiwan;
•the evolving market for products with AI capabilities;
•our complex global supply chain, including from disruptions, delays, trade tensions and conflicts, or shortages;
•product defects, errata and other product issues, particularly as we develop next-generation products and implement next-generation manufacturing process technologies;
•potential security vulnerabilities in our products;
•increasing and evolving cybersecurity threats and privacy risks;
•IP risks including related litigation and regulatory proceedings;
•the need to attract, retain, and motivate key talent;
•strategic transactions and investments;
•sales-related risks, including customer concentration and the use of distributors and other third parties;
•our significantly reduced return of capital in recent years;
•our debt obligations and our ability to access sources of capital;
•complex and evolving laws and regulations across many jurisdictions;
•fluctuations in currency exchange rates;
•changes in our effective tax rate;
•catastrophic events;
•environmental, health, safety, and product regulations;
•our initiatives and new legal requirements with respect to corporate responsibility matters; and
•other risks and uncertainties described in this retrospective revision, our most recent Annual Report on Form 10-K and our other filings with the U.S. Securities and Exchange Commission (SEC).
All information in this retrospective revision reflects management's expectations as of the date hereof, unless an earlier date is specified. We do not undertake, and expressly disclaim any duty, to update such statements, whether as a result of new information, new developments, or otherwise, except to the extent that disclosure may be required by law.
Item 7. Management's Discussion and Analysis of Financial Condition and Results of Operations
We previously announced the implementation of our internal foundry operating model, which took effect in the first quarter of 2024, and creates a foundry relationship between our Intel Products business (collectively CCG, DCAI, and NEX) and our Intel Foundry business. Intel Products consists substantially of design and development of CPUs and related solutions for third party customers. Intel Foundry consists substantially of process engineering, manufacturing, and foundry services groups that provide manufacturing, test, and assembly services to our Intel Products business and to third party customers. Both businesses utilize marketing, sales, and other support functions.
Our internal foundry model is a key component of our strategy and is designed to reshape our operational dynamics and drive greater transparency, accountability, and focus on costs and efficiency. We also previously announced our intent to operate Altera, an Intel company (previously Intel's Programmable Solutions Group), as a standalone business, with segment reporting beginning in the first quarter of 2024. Altera was previously included in our DCAI segment results. As a result of these changes, we modified our segment reporting in the first quarter of 2024 to align to this new operating model. All prior period segment data has been retrospectively adjusted to reflect the way our Chief Operating Decision Maker (CODM) internally receives information and manages and monitors our operating segment performance starting in fiscal year 2024. We have also provided additional discussion below with respect to our operating segments and results of operations for 2023 as compared to 2022. There are no changes to Intel’s consolidated financial statements for 2023, 2022 and 2021 or any other periods.
We organize our business as follows:
▪Intel Products:
▪Client Computing Group (CCG)
▪Data Center and AI (DCAI)
▪Network and Edge (NEX)
▪Intel Foundry
▪All other
▪Altera
▪Mobileye
▪Other
CCG, DCAI, and Intel Foundry qualify as reportable operating segments. NEX, Altera and Mobileye do not qualify as reportable operating segments; however, we have elected to disclose their results. When we enter into federal contracts, they are aligned to the sponsoring operating segment.
The accounting policies for our segment reporting are the same for Intel as a whole. A summary of the basis for which we report our operating segment revenues and operating margin is as follows:
Intel Products: CCG, DCAI and NEX
▪Segment revenue: consists of revenues from third party customers. The Intel Products operating segments represent a substantial majority of Intel consolidated revenue and are derived from our principal products that incorporate various components and technologies, including a microprocessor and chipset, a stand-alone SoC, or a multichip package, which are based on Intel architecture.
▪Segment expenses: consists of intersegment charges for product manufacturing and related services from Intel Foundry, external foundry manufacturing, product development costs, allocated expenses as described below, and direct operating expenses.
Intel Foundry
▪Segment revenue: consists substantially of intersegment product and services revenue for wafer fabrication and related products and services primarily sold to Intel Products, and Altera. We recognize intersegment revenue when we satisfy performance obligations as evidenced by the transfer of control of Intel Foundry products and services to Intel Products, which is generally at the completion of wafer sorting and at the completion of assembly and test services. Intersegment sales are recorded at prices that are intended to approximate market pricing. Intel Foundry also includes certain third party foundry and assembly and test revenues from external customers that were $953 million in 2023, $474 million in 2022 and $348 million in 2021.
▪Segment expenses: consists of direct expenses for technology development, product manufacturing and services provided by Intel Foundry to internal and external customers, allocated expenses as described below, and direct operating expenses. Direct expenses for product manufacturing includes excess capacity charges that were previously allocated primarily to CCG, DCAI, and NEX.
All other: Altera & Mobileye
▪Segment revenue: consists of product revenues from third party customers. Altera revenue is derived from programmable semiconductors, primarily FPGAs, structured ASICs, and related products. Mobileye revenue is derived from advanced driver-assistance systems (ADAS) and autonomous driving technologies and solutions.
▪Segment expenses: Altera expenses consist of intersegment charges for product manufacturing and related services from Intel Foundry, third party manufacturing, allocated expenses as described below, and direct operating expenses. Mobileye expenses consists of third party direct expenses for product manufacturing and related services for the manufacturing of Mobileye products and direct operating expenses.
Our "all other" category also consists of "other", which includes:
▪results of operations from non-reportable segments not otherwise presented, and from start-up businesses that support our initiatives; and
▪historical results of operations from divested businesses.
We allocate operating expenses from our sales and marketing group to the Intel Products operating segments, and allocate operating expenses from our finance and administration groups to all of our operating segments, except Mobileye. Technology development and product manufacturing costs are recorded within Intel Foundry. Previously, operating expense from all of these groups were generally allocated to all the operating segments, except Mobileye.
We estimate that the substantial majority of our consolidated depreciation expense was incurred by Intel Foundry in 2023, 2022 and 2021. Intel Foundry depreciation expense is substantially included in overhead cost pools and then combined with other costs, and subsequently absorbed into inventory as each product passes through the manufacturing process and is sold to Intel Products and other customers. As a result, it is impractical to determine the total depreciation expense included as a component of each operating segment's operating income (loss) results.
We do not allocate to our operating segments corporate operating expenses that primarily consist of:
▪restructuring and other charges;
▪share-based compensation;
▪certain impairment charges; and
▪certain acquisition-related costs, including amortization and any impairment of acquisition-related intangibles and goodwill.
We do not allocate to our operating segments non-operating expenses such as:
▪gains and losses from equity investments;
▪interest and other income; and
▪income taxes.
The CODM, who is our CEO, allocates resources to and assesses the performance of each operating segment using information about the operating segment's revenue and operating income (loss). Although the CODM uses operating income (loss) to evaluate the segments, operating costs included in one segment may benefit other segments. The measures regularly provided to and used by our CODM under our new operating model continue to evolve; currently, our CODM does not regularly review or receive discrete asset information by segment.
Intersegment eliminations: The Intel Products operating segments and Intel Foundry are meant to reflect separate fabless semiconductor and foundry companies. Intersegment sales and related gross margin on inventory recorded at the end of the period or sold through to third party customers is eliminated for consolidation purposes. Certain intersegment activity is captured within the intersegment eliminations upon consolidation and presented at the Intel consolidated level. This activity primarily relates to inventory reserves which are determined and recorded based on our accounting policies for Intel as a whole, but are only recorded by the Intel Products operating segments upon transfer of inventory. If a reserve is identified prior to the related inventory transferring to Intel Products, that reserve is presented as activity within the intersegment eliminations.
Consolidated net revenue and operating income (loss) and operating segment revenue and operating income (loss) for each period were as follows:
| | | | | | | | | | | | | | | | | | | | |
| Years Ended (In Millions) | | Dec 30, 2023 | | Dec 31, 2022 | | Dec 25, 2021 |
| Operating segment revenue: | | | | | | |
Intel Products: | | | | | | |
| Client Computing | | | | | | |
| Desktop | | $ | 10,166 | | | $ | 10,661 | | | $ | 12,437 | |
| Notebook | | 16,990 | | | 18,781 | | | 25,443 | |
| Other | | 2,102 | | | 2,331 | | | 3,201 | |
| | 29,258 | | | 31,773 | | | 41,081 | |
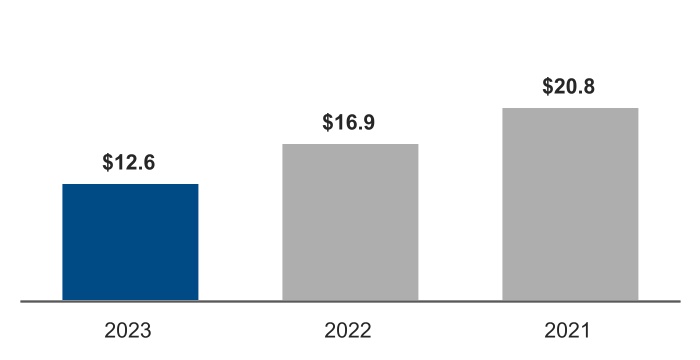
| Data Center and AI | | 12,635 | | | 16,856 | | | 20,786 | |
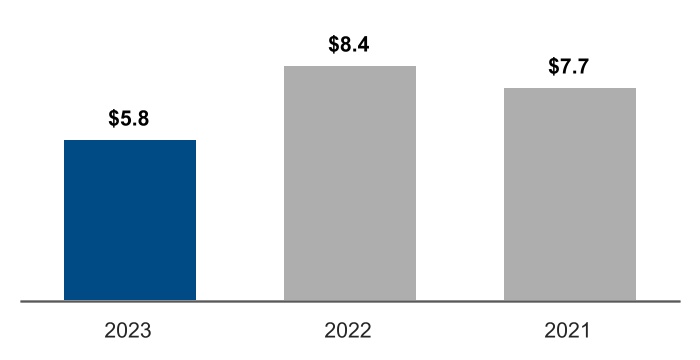
| Network and Edge | | 5,774 | | | 8,409 | | | 7,665 | |
Total Intel Products revenue | | $ | 47,667 | | | $ | 57,038 | | | $ | 69,532 | |
| | | | | | |
| Intel Foundry | | $ | 18,910 | | | $ | 27,491 | | | $ | 22,849 | |
All other | | | | | | |
| Altera | | 2,879 | | | 2,565 | | | 1,972 | |
| Mobileye | | 2,079 | | | 1,869 | | | 1,386 | |
Other | | 650 | | | 1,096 | | | 5,779 | |
Total all other revenue | | 5,608 | | | 5,530 | | | 9,137 | |
| Total operating segment revenue | | $ | 72,185 | | | $ | 90,059 | | | $ | 101,518 | |
Intersegment eliminations | | (17,957) | | | (27,005) | | | (22,494) | |
| Total net revenue | | $ | 54,228 | | | $ | 63,054 | | | $ | 79,024 | |
| | | | | | |
Segment operating income (loss): | | | | | | |
Intel Products: | | | | | | |
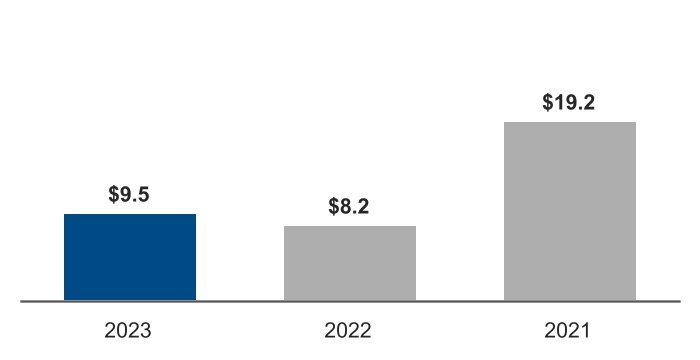
| Client Computing | | $ | 9,513 | | | $ | 8,207 | | | $ | 19,243 | |
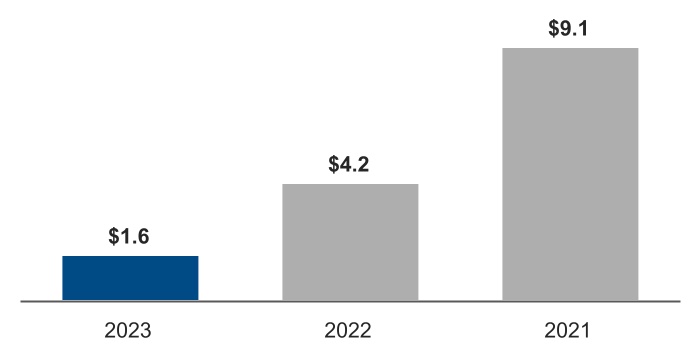
| Data Center and AI | | 1,620 | | | 4,198 | | | 9,071 | |
| Network and Edge | | 204 | | | 1,532 | | | 2,165 | |
Total Intel Products operating income | | $ | 11,337 | | | $ | 13,937 | | | $ | 30,479 | |
| | | | | | |
| Intel Foundry | | $ | (6,955) | | | $ | (5,169) | | | $ | (5,067) | |
All other | | | | | | |
| Altera | | 903 | | | 600 | | | 170 | |
| Mobileye | | 664 | | | 690 | | | 554 | |
Other | | (488) | | | (116) | | | 1,101 | |
Total all other operating income | | 1,079 | | | 1,174 | | | 1,825 | |
| Total segment operating income | | $ | 5,461 | | | $ | 9,942 | | | $ | 27,237 | |
| Intersegment eliminations | | (203) | | | (1,975) | | | (665) | |
| Corporate unallocated expenses | | (5,165) | | | (5,633) | | | (7,116) | |
Total operating income | | $ | 93 | | | $ | 2,334 | | | $ | 19,456 | |
Intel Products
Intel Products consists substantially of design and development of CPUs and related solutions for third party customers. Intel Products is comprised of three operating segments: CCG, DCAI and NEX.
Financial Performance
| | | | | | | | | | | | | | |
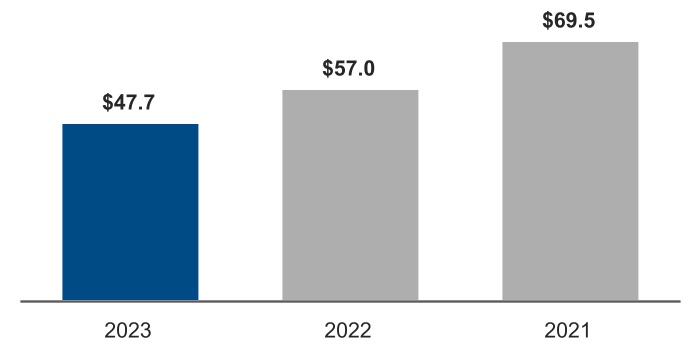
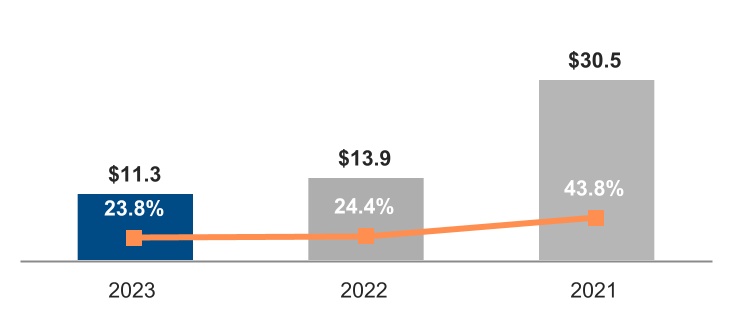
| Intel Products Operating Segments Revenue $B | | Intel Products Segments Operating Income $B | |
| | |
Operating Segments Revenue and Segments Operating Income Summary |
2023 vs. 2022
Total Intel Products revenue was $47.7 billion for 2023 and $57.0 billion for 2022, and declined due to lower revenues across all of our Intel Products operating segments. Total Intel Products operating income declined to $11.3 billion, or 23.8% operating margin for 2023 from $13.9 billion or 24.4% operating margin in 2022 due to lower revenues across all segments and higher unit costs, partially offset by lower 2023 operating expenses and lower period charges driven by the sell-through of previously reserved inventory and lower reserves taken in 2023.
Client Computing
For information regarding CCG’s market and business overview, market trends and strategy, products and competition, and certain other information, please refer to our 2023 Annual Report on Form 10-K.
Financial Performance
| | | | | | | | | | | | | | |
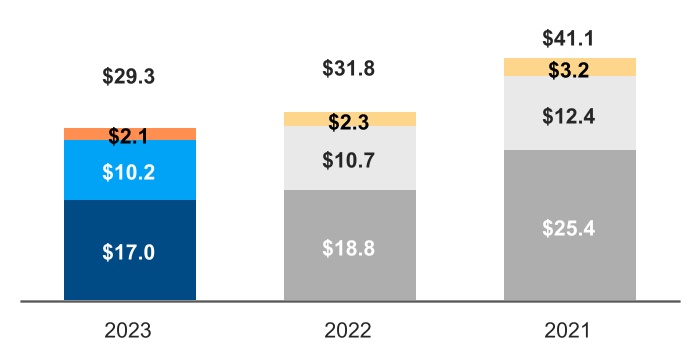
| CCG Operating Segment Revenue $B | | CCG Segment Operating Income $B | |
| | | | | | | | | | | | | | |
■ | ■ Notebook | ■ | ■ Desktop | ■ | ■ Other | |
| | |
Operating Segment Revenue Summary |
2023 vs. 2022
▪Notebook revenue was $17.0 billion, down $1.8 billion from 2022. Notebook volume decreased 5% from 2022, driven by lower demand across market segments, partially offset by increased volume in the second half of the year as customer inventory levels normalized compared to higher levels in the first half. Notebook ASPs decreased 5% from 2022 due to relative strength in the education market segment resulting in a higher mix of small core products combined with a higher mix of older generation products.
▪Desktop revenue was $10.2 billion, down $495 million from 2022. Desktop volume decreased 9% from 2022, driven by lower demand across market segments, partially offset by increased volume in the second half of the year as customer inventory levels normalized compared to higher levels in the first half. Desktop ASPs increased 5% from 2022, due to an increased mix of product sales to the commercial and gaming market segments.
▪Other revenue was $2.1 billion, down $229 million from 2022, primarily driven by the continued ramp down of our legacy smartphone modem business and lower demand for our wireless and connectivity products as a result of lower notebook volumes.
| | |
Segment Operating Income Summary |
Operating income increased 16% year over year, and operating margin was 33% in 2023 and 26% in 2022.
| | | | | | | | | | | | | | |
| (In Millions) | | | | |
| $ | 9,513 | | | 2023 Operating Income | | |
| 1,819 | | | Lower period charges primarily driven by the sell-through of previously reserved inventory and lower reserves taken in 2023 | | |
| 1,600 | | | Lower operating expenses driven by various cost-cutting measures | | |
| (1,382) | | | Lower product profit primarily from lower notebook and desktop revenue | | |
| (731) | | | Higher unit costs primarily from increased mix of Intel 7 products | | |
| | | | |
| $ | 8,207 | | | 2022 Operating Income | | |
| | | | |
Datacenter and AI
For information regarding DCAI’s market and business overview, market trends and strategy, products and competition, and certain other information, please refer to our 2023 Annual Report on Form 10-K.
Financial Performance
| | | | | | | | | | | | | | |
| DCAI Operating Segment Revenue $B | | DCAI Segment Operating Income $B | |
| | |
| Operating Segment Revenue Summary |
2023 vs. 2022
Revenue was $12.6 billion, down $4.2 billion from 2022, primarily driven by a decrease in server revenue. Server volume decreased 37% from 2022, due to lower demand in a softening CPU data center market. Server ASPs increased 20% from 2022, primarily due to a lower mix of hyperscale customer-related revenue and a higher mix of high core count products.
| | |
Segment Operating Income Summary |
Operating income decreased 61% year over year, and operating margin was 13% in 2023 and 25% in 2022.
| | | | | | | | |
| (In Millions) | | |
| $ | 1,620 | | | 2023 Operating Income |
| (2,313) | | | Lower product profit primarily due to lower server revenue |
| (1,083) | | | Higher server unit cost primarily from increased mix of Intel 7 products |
| (437) | | | Lower product profit from lower other product revenue |
| 982 | | | Lower operating expenses driven by various cost-cutting measures |
| 176 | | | Lower period charges primarily related to product development costs |
| 97 | | | Lower period charges driven by the sell-through of previously reserved inventory and lower reserves taken in 2023 |
| | |
| $ | 4,198 | | | 2022 Operating Income |
| | |
Network & Edge
For information regarding NEX’s market and business overview, market trends and strategy, products and competition, and certain other information, please refer to our 2023 Annual Report on Form 10-K.
Financial Performance
| | | | | | | | | | | | | | |
| NEX Operating Segment Revenue $B | | NEX Segment Operating Income $B | |
| | |
| Operating Segment Revenue Summary |
2023 vs. 2022
Revenue was $5.8 billion, down $2.6 billion from 2022, as customers tempered purchases to reduce inventories and adjust to a lower demand environment across product lines.
| | |
| Segment Operating Income Summary |
Operating income decreased 87% year over year, and operating margin was 4% in 2023 and 18% in 2022. | | | | | | | | | | | | | | |
| (In Millions) | | | | |
| $ | 204 | | | 2023 Operating Income | | |
| (1,801) | | | Lower product profit driven by lower revenue across NEX product lines | | |
| (143) | | | Higher period charges driven by inventory reserves taken in 2023 | | |
| 547 | | | Lower operating expenses driven by various cost-cutting measures | | |
| 69 | | | Other | | |
| | | | |
| | | | |
| | | | |
| $ | 1,532 | | | 2022 Operating Income | | |
Intel Foundry
Market and Business Overview
Overview
Intel Foundry, comprising our Foundry Technology Development, Foundry Manufacturing and Supply Chain, and Foundry Services organizations, is on a mission to deliver the best systems foundry capabilities to our customers and reshape the world’s semiconductor industry. As the stewards of Moore’s law, we continually innovate and advance world-class silicon process and advanced packaging technologies for customers. Our systems foundry offerings are strengthened by a robust design ecosystem with key industry partners, our systems of chips capabilities, and our secure, resilient and more sustainable supply chain. Our systems foundry is built on the foundation of our silicon process and advanced packaging technology offerings and enables co-optimized solutions for our customers in the AI era. We are strengthening the resilience of the global semiconductor supply chain for leading-edge and mature node semiconductor products by investing in geographically balanced and more sustainable manufacturing capacity. As a systems foundry for the AI era, Intel Foundry brings together these critical components to help our global customers drive the next phase of technology innovation.
Market Trends and Strategy
As part of our IDM 2.0 strategy, Intel Foundry combines technology, manufacturing, supply chain, and systems capabilities to enable our customers to build systems optimized for their workloads while increasing the resilience and sustainability of their supply chains. We are executing on our strategy of delivering five advanced process technology nodes in four years and committed to achieving process technology leadership by 2025. We are working closely with the US federal government on the implementation of the US CHIPS and Science Act in support of the semiconductor industry and American technological leadership and innovation; and with non-US governments including Germany, Ireland, and Poland on securing support and approval for our manufacturing projects in those countries. These planned projects support the European Union's semiconductor strategy to significantly strengthen its supply chain. Our factory network provides geographically balanced manufacturing capacity and we believe it is the most sustainable factory network in the industry; our 2023 target was to reach 95% renewable electricity use globally, and we achieved 99% renewable electricity. Intel Foundry enables external customers to benefit from our advanced technologies, systems capabilities, and manufacturing network.
The push to bring AI everywhere is driving transformational changes in the global market for semiconductors. AI demands an ever-increasing amount of computation power, ubiquitous computing for users, pervasive connectivity, cloud-to-edge systems, and networking infrastructure. To deliver the step function changes in efficient and cost-effective systems required to enable AI, a generational shift in computer architectures is underway. Architectures are shifting from general monolithic silicon chips to systems of interconnected chiplets optimized for specific workloads and market segments. This increases complexity for customers as design choices proliferate and the number of technologies to influence and optimize increases dramatically. The increasing complexity and scope are challenging for traditional fabless semiconductor companies, who must now consider system implications for their designs and for systems companies like cloud service providers and automotive OEMs, who must create chips optimized for their systems. In short, the global semiconductor industry and our customers are having to rethink the way they build chips and systems while simultaneously redesigning their supply chains to be more resilient and sustainable.
Our IDM 2.0 strategy includes our pursuit of complex manufacturing and market growth opportunities by making significant capital investments in leading-edge semiconductor technologies and foundry capacity to establish Intel Foundry as a major provider of semiconductor manufacturing solutions for third parties. We have made and expect to continue to make significant capital investments in furtherance of this strategy.
Products, Services and Competition
We seek to address the transformational shift in the semiconductor industry being driven by AI and the demand for ever-increasing computation power by creating a new category of foundry, a systems foundry for the AI era. The systems foundry for the AI era is a world-class foundry offering, delivered from a resilient, secure, more sustainable supply chain. Intel Foundry's offerings are foundational and consist of advanced process technologies enabled by an ecosystem of electronic design automation tools, intellectual property and design services from vendors used by our customers. This ecosystem enables customers to design with Intel technologies as they would with other foundries. The systems of chips capabilities include architecture, advanced packaging technologies, software, and services to accelerate time to market, and driving standards to improve system performance and power consumption.
Intel Foundry's process technologies available to third party customers are expected to include our upcoming Intel 20A and Intel 18A processes, featuring RibbonFET (gate-all-around) and PowerVia (back-side power delivery) as expected industry firsts, our new Intel 3 process using EUV lithography, our established Intel 7 and Intel 16 processes, and a new 12nm foundry process technology we are developing in collaboration with United Microelectronics Corporation (UMC). We recently announced an extension to our leading-edge roadmap beyond Intel 18A with the introduction of Intel 14A, which we expect will be the industry's first commercial use high-NA EUV lithography. Intel Foundry's Advanced Semiconductor Assembly and Test (ASAT) offerings include families of advanced technologies for packaging single chips or combining multiple chips together in a package, either adjacent to each other (EMIB), stacked on top of each other (Foveros), or through a combination thereof (EMIB 3.5D, FCBGA 2D, FCBGA 2D+). In addition to our core packaging technologies, we have differentiated capabilities to design and produce complex packaged parts with optimal performance, power, and cost at high yield. We continue to drive the technologies, capabilities, and standards needed to optimize systems of chips, including the Universal Chiplet Interconnect Express* standard for communication between chips in a system, which we demonstrated in silicon in 2023. We will accelerate our customers' designs by providing advanced technologies, services and systems software that leverage Intel's deep knowledge as a systems company.
The competitors to Intel Foundry are primarily semiconductor foundries that focus on delivering wafers and packaging technologies from fabrication plants based primarily in Asia and include Taiwan Semiconductor Manufacturing Company (TSMC), Samsung, Global Foundries, UMC, and Semiconductor Manufacturing International Corporation (SMIC). We compete with TSMC and Samsung in the advanced technology space.
We believe the systems foundry for AI model delivers differentiated capabilities for our customers to lead in their industries while bringing increased resilience and sustainability to the global semiconductor supply chain. We remain committed to achieving process technology leadership in 2025 by completing our plan to deliver five technology nodes in four years while capitalizing on the momentum with and commitments from customers based on our foundry offerings.
Financial Performance
| | | | | | | | | | | | | | |
| Intel Foundry Operating Segment Revenue $B | | Intel Foundry Segment Operating Loss $B | |
| | |
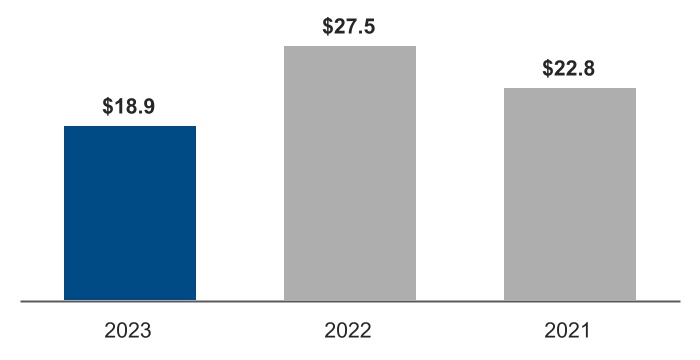
| Operating Segment Revenue Summary |
2023 vs. 2022
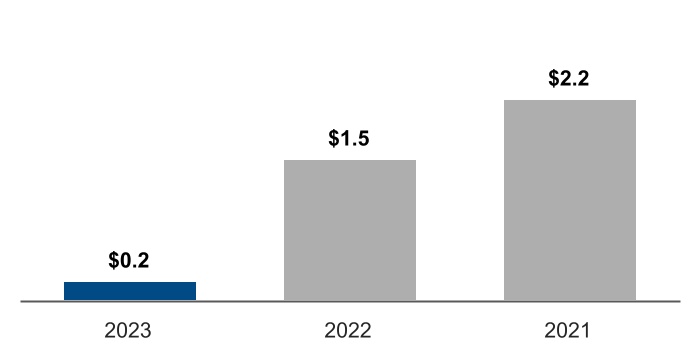
Revenue was $18.9 billion down $8.6 billion from 2022. Internal revenue was $18.0 billion, down $9.1 billion driven by lower intersegment volume. External revenue was $953 million, up $479 million from 2022, driven by higher packaging revenue.
| | |
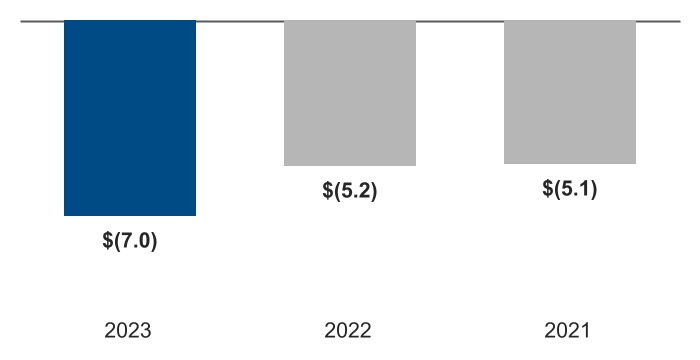
Segment Operating Loss Summary |
We had an operating loss of $7.0 billion, compared to an operating loss of $5.2 billion in 2022.
| | | | | | | | |
| (In Millions) | | |
| $ | (6,955) | | | 2023 Operating Loss |
| (2,100) | | | Lower product profit driven by lower internal revenue |
| (411) | | | Higher period charges related to excess capacity |
| (284) | | | Higher period charges driven by higher inventory reserves taken in 2023 |
| 481 | | | Lower period charges primarily driven by a decrease in product ramp costs |
| 315 | | | Higher product profit driven by external packaging revenue |
| 213 | | | Lower operating expenses driven by various cost-cutting measures |
| $ | (5,169) | | | 2022 Operating Loss |
| | |
All Other
Our "all other" category includes results of operations from our Altera and Mobileye businesses and from "other" non-reportable segments not otherwise presented, and from start-up businesses that support our initiatives; and historical results of operations from divested businesses. Altera offers programmable semiconductors, primarily FPGAs, structured ASICs, and related products, for a broad range of applications across our embedded, communications, cloud, and enterprise market segments. Mobileye is a global leader in driving assistance and self-driving solutions, with a product portfolio designed to encompass the entire stack required for assisted and autonomous driving, including compute platforms, computer vision, and machine learning-based perception, mapping and localization, driving policy, and active sensors in development.
Financial Performance
| | | | | | | | | | | | | | |
| All Other Operating Segments Revenue $B | | All Other Segments Operating Income $B | |
| | |
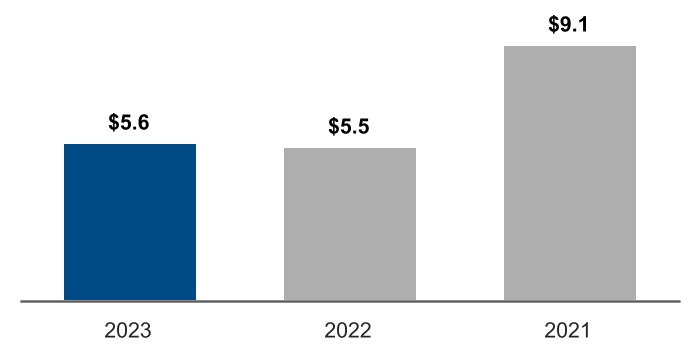
Operating Segments Revenue and Segments Operating Income Summary |
2023 vs. 2022
All other revenue was $5.6 billion, up $78 million from 2022. Altera revenue increased $314 million from 2022, driven by improved external supply, which enabled the fulfillment of customer backlog. Mobileye revenue increased $210 million from 2022, due to higher demand for EyeQ products. This was partially offset by a decrease in revenue from our remaining non-reportable segments and start-up businesses. All other operating income was $1.1 billion, down $95 million from 2022.
Corporate Unallocated Expenses
Corporate unallocated expenses represent costs incurred that are not directly attributed to an operating segment. The nature of these expenses may vary, but primarily consist of acquisition-related costs, share-based compensation, and restructuring and other charges.
| | | | | | | | | | | | | | | | | | | | | | |
| Years Ended (In Millions) | | Dec 30, 2023 | | Dec 31, 2022 | | Dec 25, 2021 | | |
| Acquisition-related adjustments | | $ | (1,407) | | | $ | (1,526) | | | $ | (1,492) | | | |
| Share-based compensation | | (3,229) | | | (3,128) | | | (2,036) | | | |
| Patent settlement | | — | | | (204) | | | — | | | |
| Optane inventory impairment | | — | | | (723) | | | — | | | |
| Restructuring and other charges | | 62 | | | (2) | | | (2,626) | | | |
| Other | | (591) | | | (50) | | | (962) | | | |
Total corporate unallocated expenses | | $ | (5,165) | | | $ | (5,633) | | | $ | (7,116) | | | |
| | | | | |
Consolidated Results of Operations | |
| |
For additional key highlights of our results of operations, see "A Year in Review" within our 2023 Annual Report on Form 10-K.
| | | | | | | | | | | | | | | | | | | | | | | | | | | | | | | | | | | | | | |
Years Ended
(In Millions, Except Per Share Amounts) | | December 30, 2023 | | December 31, 2022 | | December 25, 2021 |
| Amount | | % of Net
Revenue | | Amount | | % of Net
Revenue | | Amount | | % of Net
Revenue |
| Net revenue | | $ | 54,228 | | | 100.0 | % | | $ | 63,054 | | | 100.0 | % | | $ | 79,024 | | | 100.0 | % |
| Cost of sales | | 32,517 | | | 60.0 | % | | 36,188 | | | 57.4 | % | | 35,209 | | | 44.6 | % |
| Gross margin | | 21,711 | | | 40.0 | % | | 26,866 | | | 42.6 | % | | 43,815 | | | 55.4 | % |
| Research and development | | 16,046 | | | 29.6 | % | | 17,528 | | | 27.8 | % | | 15,190 | | | 19.2 | % |
| Marketing, general, and administrative | | 5,634 | | | 10.4 | % | | 7,002 | | | 11.1 | % | | 6,543 | | | 8.3 | % |
| Restructuring and other charges | | (62) | | | (0.1) | % | | 2 | | | — | % | | 2,626 | | | 3.3 | % |
| | | | | | | | | | | | |
| Operating income | | 93 | | | 0.2 | % | | 2,334 | | | 3.7 | % | | 19,456 | | | 24.6 | % |
| Gains (losses) on equity investments, net | | 40 | | | 0.1 | % | | 4,268 | | | 6.8 | % | | 2,729 | | | 3.5 | % |
| Interest and other, net | | 629 | | | 1.2 | % | | 1,166 | | | 1.8 | % | | (482) | | | (0.6) | % |
| Income before taxes | | 762 | | | 1.4 | % | | 7,768 | | | 12.3 | % | | 21,703 | | | 27.5 | % |
| Provision for (benefit from) taxes | | (913) | | | (1.7) | % | | (249) | | | (0.4) | % | | 1,835 | | | 2.3 | % |
| Net income | | 1,675 | | | 3.1 | % | | 8,017 | | | 12.7 | % | | 19,868 | | | 25.1 | % |
| Less: Net income (loss) attributable to non-controlling interests | | (14) | | | — | % | | 3 | | | — | % | | — | | — | % |
| Net income attributable to Intel | | $ | 1,689 | | | 3.1 | % | | $ | 8,014 | | | 12.7 | % | | $ | 19,868 | | | 25.1 | % |
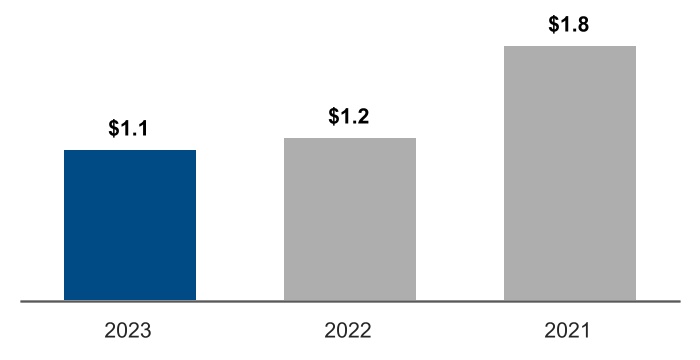
| Earnings per share attributable to Intel—diluted | | $ | 0.40 | | | | | $ | 1.94 | | | | | $ | 4.86 | | | |
Consolidated Revenue
The following presents external revenue for each of our businesses:
| | |
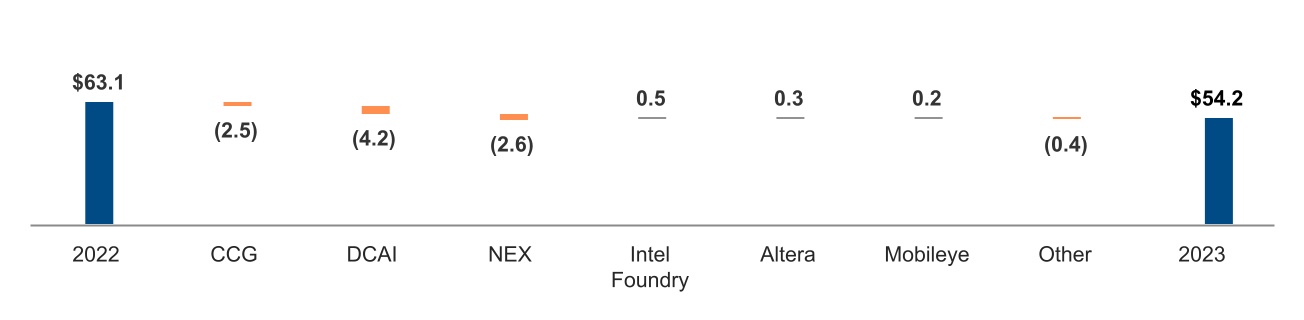
Consolidated Revenue Walk $B1 |
2023 vs. 2022
2023 revenue was $54.2 billion, down $8.8 billion, or 14%, from 2022. CCG revenue decreased 8% from 2022 primarily due to lower notebook and desktop volume driven by lower demand across market segments, partially offset by increased volume in the second half of the year as customer inventory levels normalized compared to higher levels in the first half. Notebook ASPs decreased due to the relative strength in the education market segment resulting in a higher mix of small core products combined with a higher mix of older generation products, and were partially offset by higher desktop ASPs due to an increased mix of product sales to the commercial and gaming market segments. DCAI revenue decreased 25% from 2022 due to lower server volume resulting from a softening CPU data center market, which was partially offset by higher server ASPs from a lower mix of hyperscale customer-related revenue and a higher mix of high core count products. NEX revenue decreased 31%% from 2022 as customers tempered purchases to reduce existing inventories and adjust to a lower demand environment across product lines.
Incentives offered to certain customers to accelerate purchases and to strategically position our products with customers for market segment share purposes, contributed approximately $700 million to our revenue during Q4 2023, the impacts of which were contemplated in our financial guidance for Q1 2024, as included in our Form 8-K dated January 25, 2024.
1 Presented post intersegment eliminations
Consolidated Gross Margin
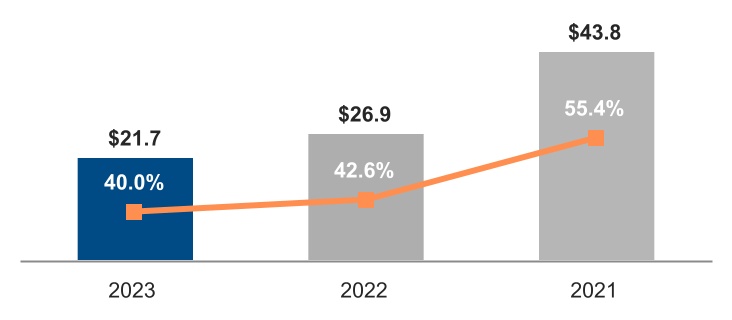
We derived most of our overall gross margin in 2023 from the sale of products in the CCG and DCAI operating segments. Our overall gross margin dollars in 2023 decreased by $5.2 billion, or 19%, compared to 2022, and in 2022 decreased by $16.9 billion, or 39%, compared to 2021.
| | | | | |
| Consolidated Gross Margin $B1 |
| (Percentages in chart indicate gross margin as a percentage of total revenue) |
| | | | | | | | |
| (In Millions) | | |
| $ | 21,711 | | | 2023 Gross Margin |
| (2,709) | | | Lower product margin primarily due to lower server revenue |
| (1,832) | | | Lower product margin driven by lower revenue across NEX product lines |
| (1,704) | | | Lower product margin primarily from lower notebook and desktop revenue |
| (1,654) | | | Higher unit cost primarily from increased mix of Intel 7 products |
| (411) | | | Higher period charges related to excess capacity charges |
| 1,973 | | | Lower period charges driven by the sell-through of previously reserved inventory and lower reserves taken in 2023 |
| 788 | | | Lower period charges primarily driven by a decrease in product ramp costs |
| 723 | | | Absence of the inventory impairment charge taken in 2022 related to the wind down of our Intel Optane memory business |
| 204 | | | Absence of corporate charges from a patent settlement in 2022 |
| (533) | | | Other |
| $ | 26,866 | | | 2022 Gross Margin |
1 Presented post intersegment eliminations
We are making capital investments in furtherance of our IDM 2.0 strategy. As of December 30, 2023, our capital investments classified as construction in progress totaled $43.4 billion ($36.7 billion as of December 31, 2022). These assets have not yet been placed into service and have not yet begun depreciating. As these construction-in-progress assets are placed into service, we expect to incur depreciation expense that impacts future production costs and, ultimately, cost of sales. To the extent we are unable to grow our revenues to offset these production costs, our gross margin and operating income will be unfavorably affected. Additionally, we could incur asset impairments on property, plant, and equipment assets if our IDM 2.0 strategy is not successful.
Effective January 2023, we increased the estimated useful life of certain production machinery and equipment from 5 to 8 years. When compared to the estimated useful life in place as of the end of 2022, we estimate total depreciation expense in 2023 was reduced by $4.2 billion. We estimate this change resulted in an approximately $2.5 billion increase to gross margin, $400 million decrease in R&D expenses, and $1.3 billion decrease in ending inventory values. These estimates are based on the assets in use and under construction as of the beginning of 2023 and are calculated at that point in time. Most of the depreciation expense associated with this useful life change is included in overhead cost pools and is combined with other costs and other depreciation expense from assets placed into service after this calculation was performed, for which such costs are subsequently absorbed into inventory as each product passes through our manufacturing process. As a result, the actual amount of impact from the useful life change that is included in our 2023 operating results and financial position is impractical to individually and specifically quantify on a year-over-year basis.
Operating Expenses
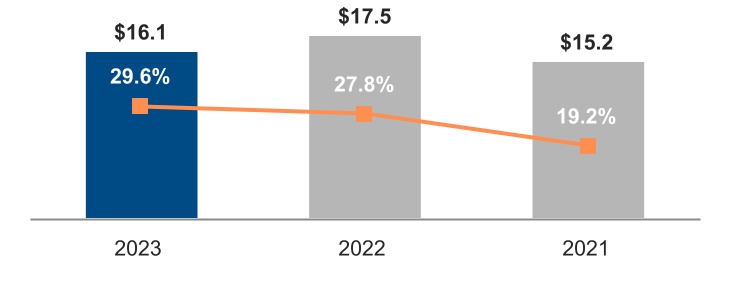
Total R&D and MG&A expenses for 2023 were $21.7 billion, down 12% compared to 2022. These expenses represent 40.0% of revenue for 2023 and 38.9% of revenue for 2022. In support of our strategy, we continue to make significant investments to accelerate our process technology roadmap. This requires increased investments in R&D and focused efforts to attract and retain talent. We have implemented certain cost-cutting measures while we continue to improve our product execution.
| | | | | | | | |
Research and Development $B1 | | Marketing, General, and Administrative $B1 |
| (Percentages indicate expenses as a percentage of total revenue) |
| | | | | | | |
| 2023 vs. 2022 | | |
| | | |
| R&D decreased by $1.5 billion, or 8%, driven by the following: | | |
| | | |
| - | The effects of various cost-cutting measures | | |
| + | Higher incentive-based cash compensation | | |
| | | |
| | | |
| | | |
| | |
| | | |
| | |
| | | |
| | | |
| | | |
| | | |
| | | |
| | | |
| | | |
| | |
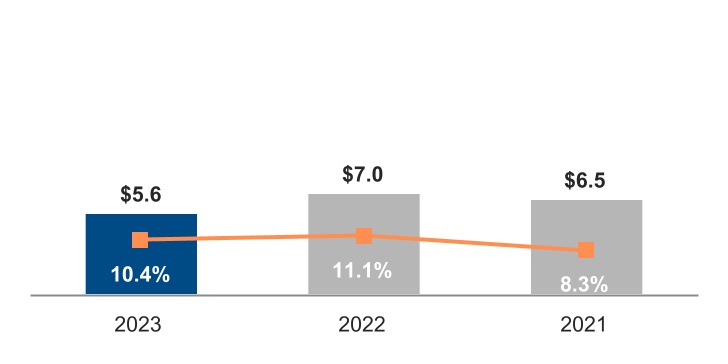
Marketing, General, and Administrative |
| | | | | | | |
| 2023 vs. 2022 | | |
| | | |
| MG&A decreased by $1.4 billion, or 20%, driven by the following: | | |
| | | |
| - | Lower corporate spending as a result of various cost-cutting measures | | |
| + | Higher incentive-based cash compensation | | |
| | | |
| | | |
| | | |
| | |
| | | |
| | |
| | | |
| | | |
| | | |
| | | |
| | | |
| | | |
1 Presented post intersegment eliminations